Introduction
Green Energy Statistics: Let me just put this out there, green energy isn’t the future anymore, it’s already happening. Everywhere. But you know what most people don’t talk about? The numbers. And trust me, the numbers are insane. That’s why I decided to break it all down in this Green Energy Statistics article.
We’re hearing about solar panels, wind turbines, electric cars, and all that, but behind these, actual data is showing just how fast this shift is happening. This isn’t just some eco-friendly trend anymore. The scale, the money, the jobs, the power, it’s all massive. And it’s moving quicker than most people even realize.
I’m going to walk you through everything, where green energy started, where we are now in 2025, and where the world is heading by 2030. So, whether you’re a student, an investor, a tech enthusiast, or just someone trying to keep up with how the world’s changing, this article on green energy statistics is for you. Let’s get into it.
Editor’s Choice
- Green energy now powers over 30% of the world’s electricity, and that number is still climbing. Back in 2000, it was barely 3.8%.
- Solar power has grown from under 10 GW in 1990 to over 1,300 GW in 2025, making it one of the fastest-growing power sources in human history.
- Global investments in green energy have crossed $1.77 trillion in 2025, proving that this shift is not just environmental, it’s economic.
- China leads the global green energy race with more than 1,400 GW of installed renewable capacity. It’s ahead in solar, wind, and hydro.
- India and the U.S. are major players, with 197 GW and 388 GW of green energy capacity, respectively. Both are aggressively expanding.
- Wind energy has reached nearly 965 GW worldwide, including 84 GW from offshore wind farms, which are now powering coastal cities and grids.
- Renewable energy jobs have surpassed 7 million globally. Solar and wind sectors are leading in employment, especially in Asia.
- Hydropower still holds over 1,300 GW in global capacity, but solar and wind have quickly narrowed the gap with aggressive growth.
- The price of solar energy has dropped by more than 82% in a decade, making it cheaper than fossil fuels in many regions.
- Over 170 countries have adopted green energy policies, up from just 60 in the year 2000. It’s now a global priority, not just an option.
| Metric | 2000 | 2025 |
| Global Renewable Energy Share | 3.8% |
30%+ |
|
Global Solar Power Capacity |
10 GW | 1,300+ GW |
| Global Wind Power Capacity | 17 GW |
965 GW |
|
Global Green Energy Jobs |
2.3 million | 13.7 million |
| Global Annual Investment | $240B |
$1.77T |
|
Countries with Green Policies |
60 | 170+ |
| Offshore Wind Capacity | 1 GW |
84 GW |
|
Top Green Energy Country |
N/A | China (1,400+ GW) |
| Leading Growth Region | Europe |
Asia |
|
Solar Cost Drop |
N/A |
Down 82% (2010 to 2025) |
Origin and Growth of Green Energy
 (Source: ren21.net)
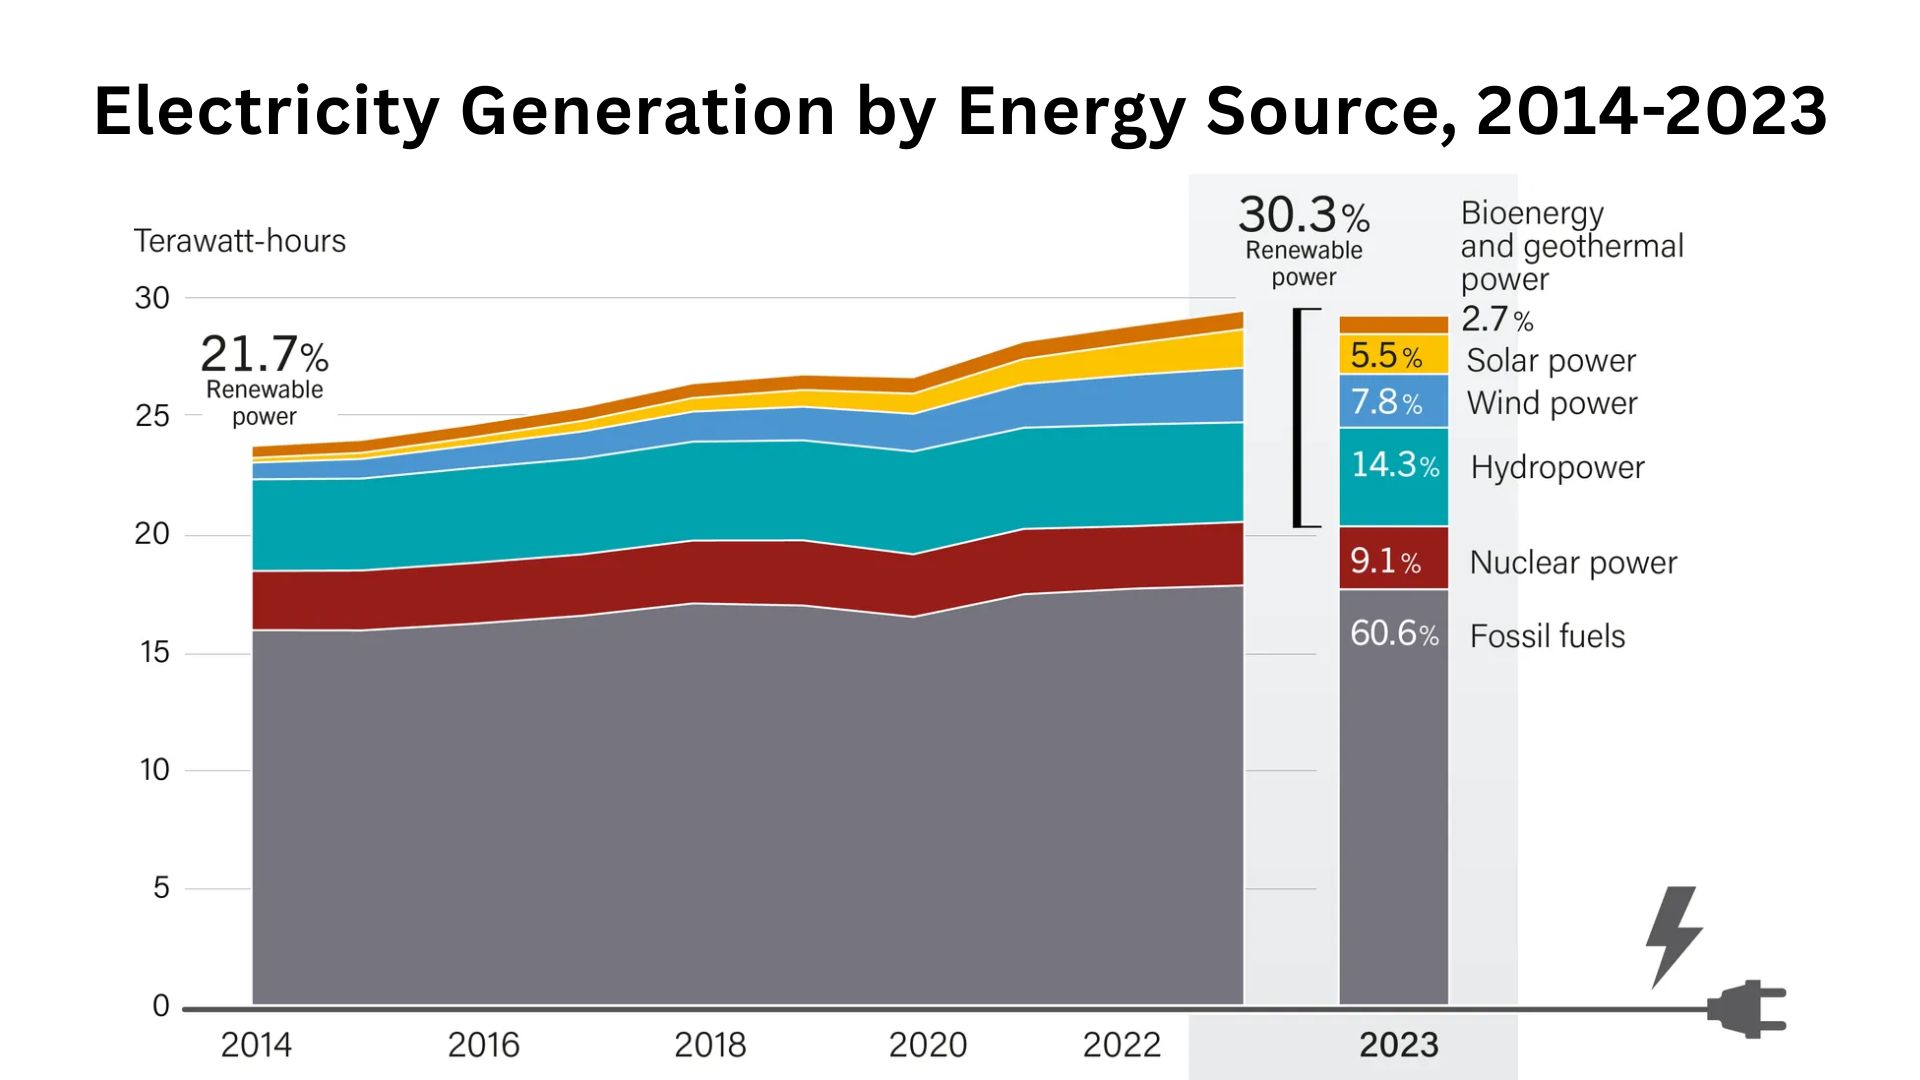
- The concept of green energy isn’t new. People have been using water wheels, sunlight, and windmills for centuries, but it was never treated as a full-scale power solution until things started heating up literally. Now, it’s become the most talked-about shift in global energy policy.
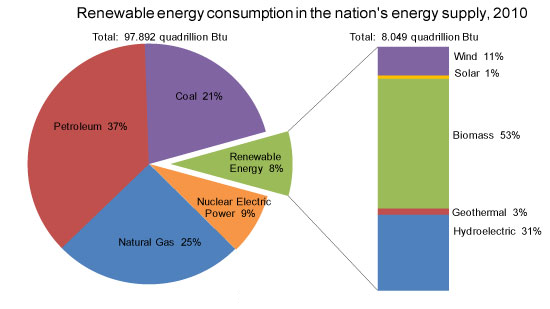
- Green energy statistics show that in the year 2000, renewable sources contributed barely 3.8% of the total global energy mix. It was mostly hydro at that time, and the rest was nearly ignored.
- By 2010, due to policy changes in Europe and rising environmental awareness, this share grew to about 6.5%. Countries like Germany took the lead with massive solar incentives and subsidy programs.
- Come 2025, the global green energy contribution will have crossed 30% of total electricity generation. That’s a huge leap in just over two decades, mostly driven by solar and wind installations.
- In 1990, solar capacity globally was under 10 GW. Compare that to today, where it has crossed 1,300 GW, showing exponential growth unlike anything we’ve seen in energy history.
- Wind power followed a similar path, growing from just 17 GW in 2000 to around 965 GW in 2025. It now powers entire cities and even countries during peak production.
- Back in 2010, the total global investment in green energy was somewhere around $240 billion. Today, in 2025, that figure stands at a record-breaking $1.77 trillion. That’s not a trend, that’s a shift.
- In the 1960s, hydroelectricity accounted for about 90% of renewable energy. Fast forward to now,and it’s under 40%, as solar and wind take the lead thanks to better tech and lower costs.
- The price of solar energy has dropped by over 82% in the last decade, making it one of the cheapest sources of electricity in sunny regions, especially across Asia and Africa.
- Interestingly, Iceland has been powered almost entirely by renewables (mostly geothermal and hydro) since the 1980s, making it one of the earliest examples of a clean energy-driven economy.
- While only around 60 countries had renewable energy targets or national strategies in 2000, today over 170 countries have written green energy into their policy books and long-term goals.
| Indicator | 2000 | 2025 |
| Renewable Energy Share | 3.8% | 30% |
| Global Solar Capacity | 10 GW | 1,300+ GW |
| Global Wind Capacity | 17 GW | 965 GW |
| Annual Green Energy Investment | $240B | $1.77T |
| Countries with Green Policies | 60 | 170+ |
Global Capacity Overview
 (Reference: researchgate.net)
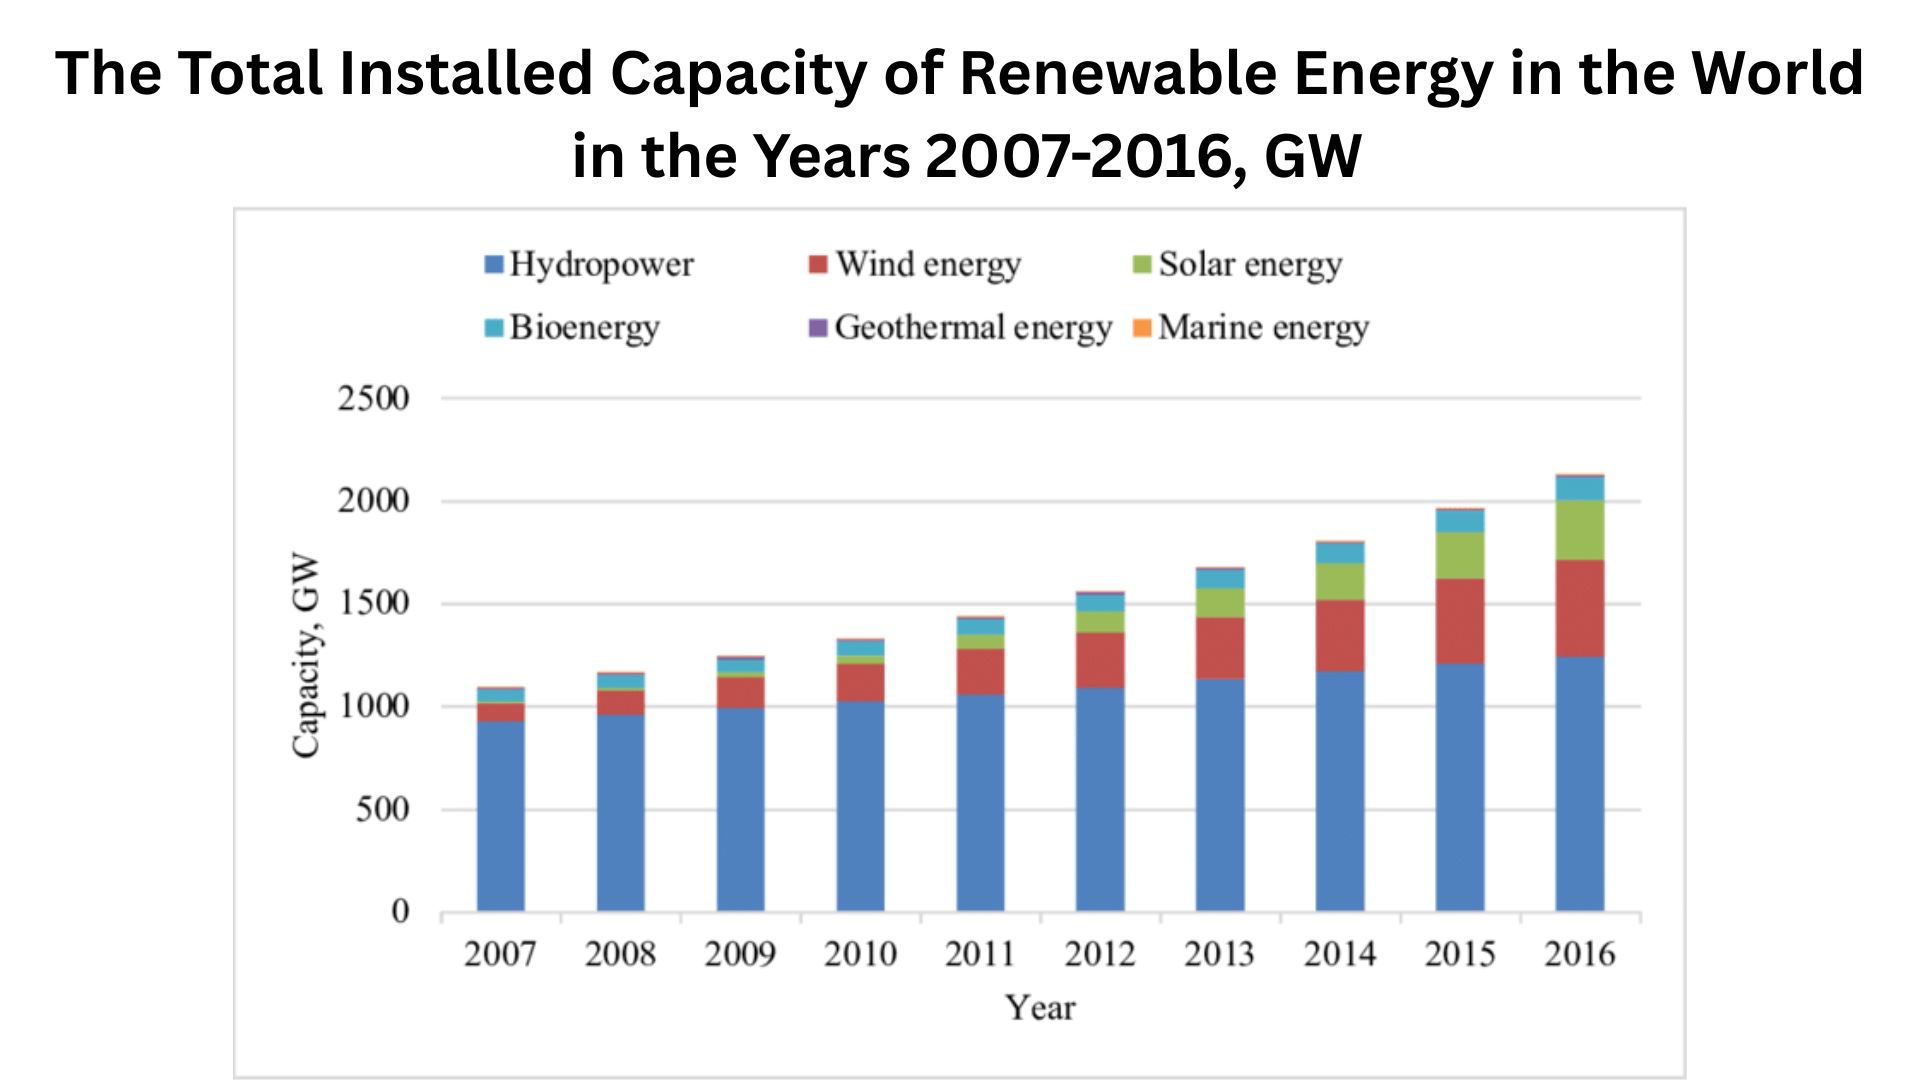
- One of the clearest signs of growth is in the numbers showing actual installed capacity. This is where green energy statistics truly reflect real-world momentum.
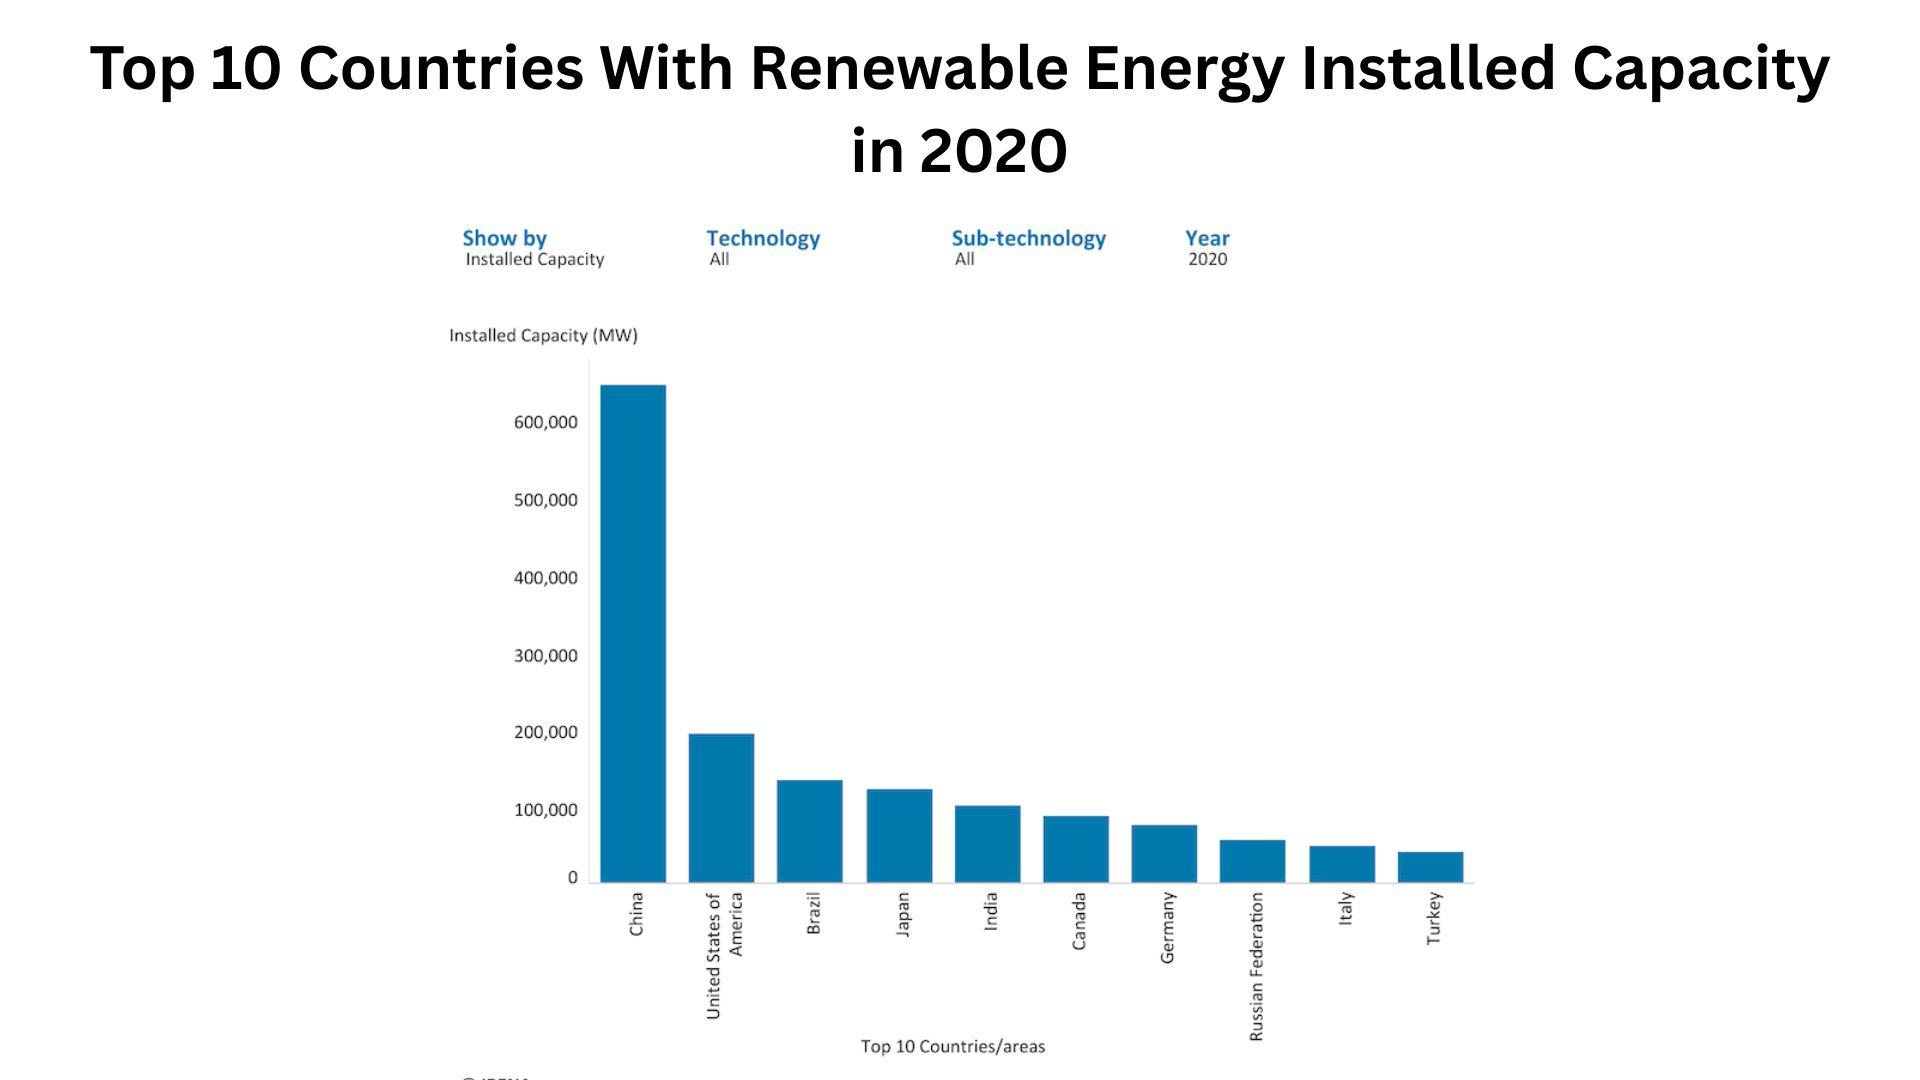
- As of mid-2025, the world’s total renewable energy capacity is over 3,870 GW. That’s more than the total combined energy output of the U.S. and Europe two decades ago.
- China stands far ahead of everyone else, with over 1,400 GW of renewable energy capacity. It’s the single biggest player in solar, wind, and hydro, backed by massive government investments.
- India comes in strong with around 197 GW of green energy, rapidly scaling up its solar installations and adding wind farms in coastal regions. Their national goal is to hit 500 GW by 2030.
- The United States, with its wind corridor in the Midwest and solar expansion in California and Texas, currently holds about 388 GW in renewable energy installations.
- Brazil leads in hydropower with over 110 GW, thanks to its vast river systems and aggressive early investment in dam-based power generation.
- Across Europe, the European Union has collectively installed over 580 GW in renewable energy capacity. Germany, Spain, and Italy make up a big portion of this, particularly in wind and solar.
- Africa, though still developing its infrastructure, has shown promising growth. Its total green energy capacity has touched 80 GW in 2025, mostly from solar farms across northern and eastern Africa.
- Germany has consistently led Europe in the transition. Today, over 52% of its electricity comes from renewable sources, even though the country gets less sunshine than most of Asia.
- In 2024 alone, more than 473 GW of new green capacity was added globally, which is a new world record. That’s about one-third of the total added capacity coming from just solar.
- Offshore wind is also making headlines, with global capacity now standing at 84 GW. The UK, China, and the Netherlands have taken the lead in building turbines deep into the ocean.
| Country / Region | Total Capacity (2025) |
| China | 1,400 GW |
| India | 197 GW |
| USA | 388 GW |
| Brazil | 110 GW |
| European Union | 580 GW |
| Africa | 80 GW |
| Global New Additions (2024) | 473 GW |
| Offshore Wind Global | 84 GW |
Solar Power Statistics
 (Source: jmkresearch.com)
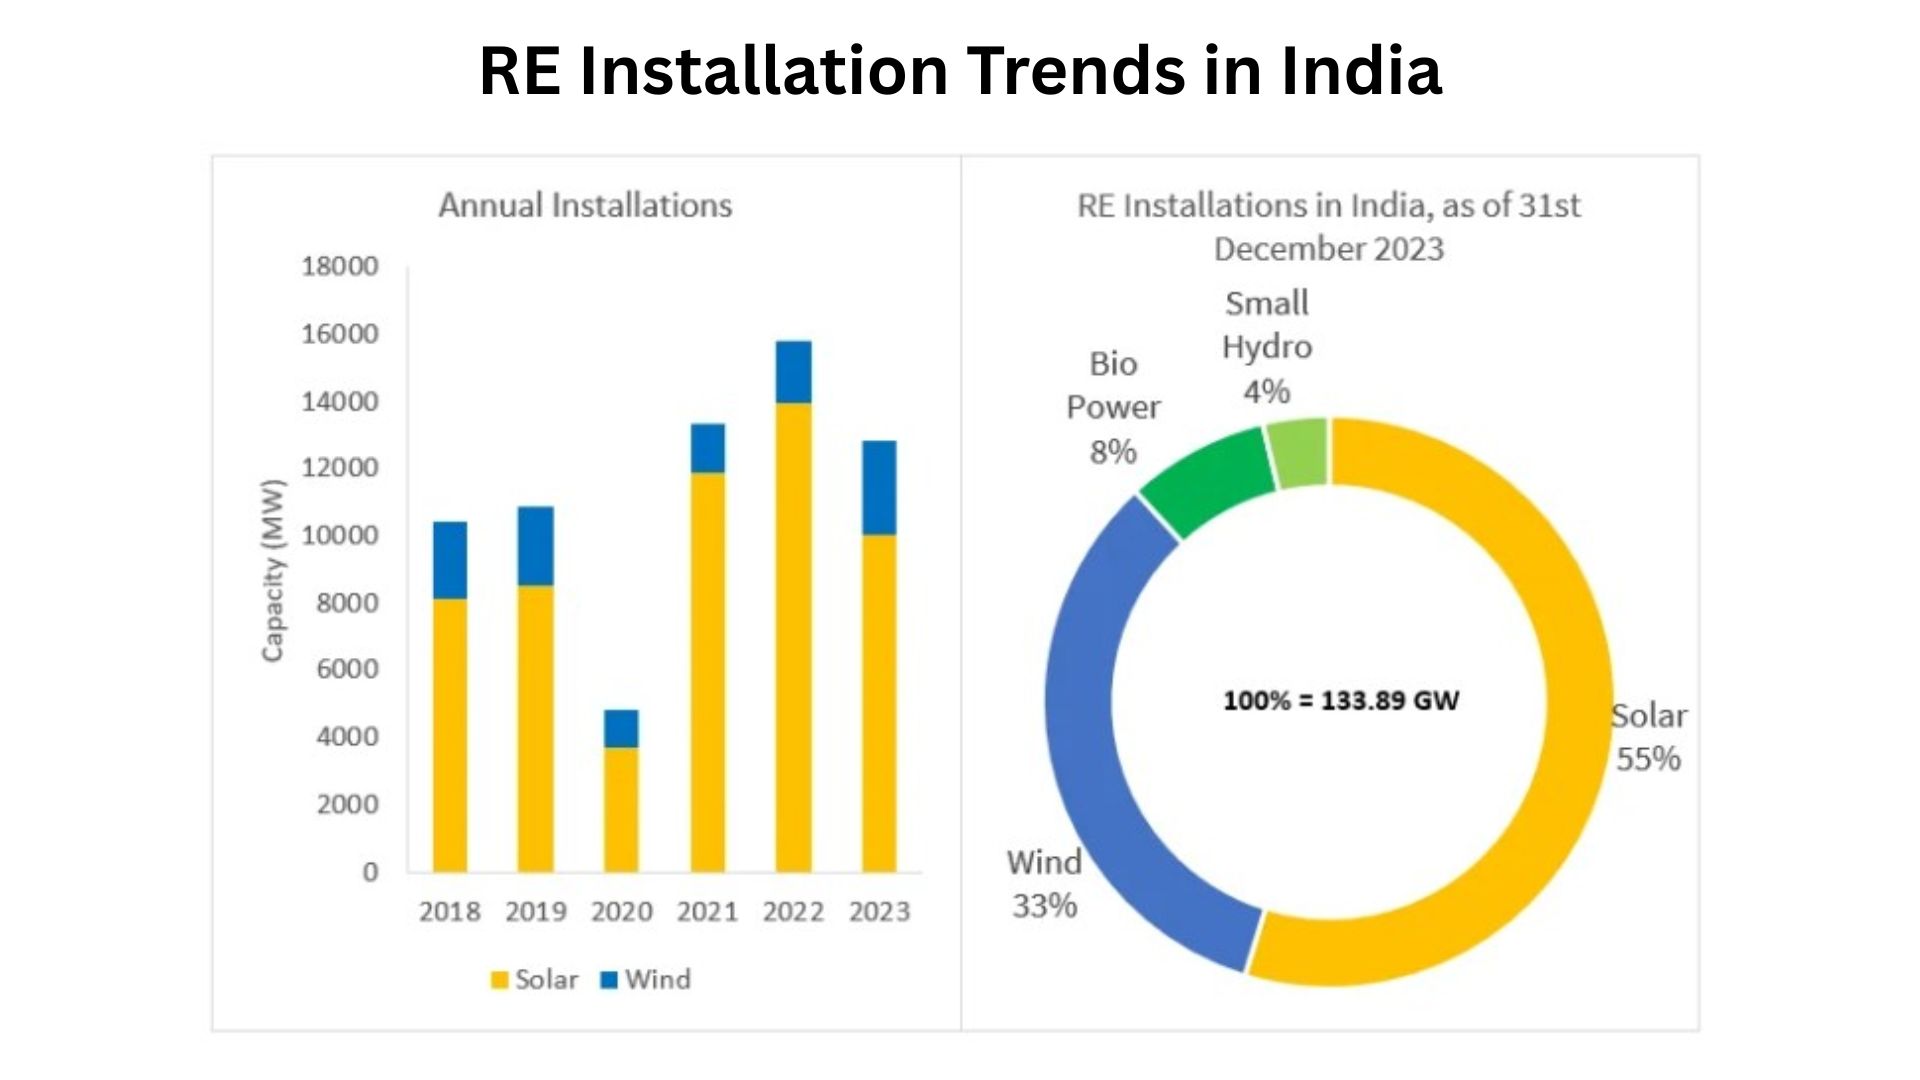
- Solar is no longer a backup option; it’s now one of the main pillars of the global power grid. The numbers prove just how dominant it’s become in the last few years.
- The total installed solar photovoltaic (PV) capacity across the globe has now passed 1,380 GW in 2025. That’s more than 130 times what it was in the year 2000, which is wild if you think about it.
- China holds the largest share of solar power on the planet, with over 590 GW installed. That means roughly 4 out of every 10 solar panels in the world are located in China.
- India has been picking up fast and now has around 90 GW of solar capacity. A huge chunk of it comes from Rajasthan and Gujarat, which have some of the best solar exposure in Asia.
- The United States has surpassed 150 GW of solar power, with states like California, Texas, and Nevada leading in residential and commercial adoption.
- Germany, despite its cloudy weather and smaller size, still holds a solid 70 GW of solar installations. That shows policy matters just as much as sunshine when it comes to renewables.
- In the year 2024 alone, the world added over 310 GW of new solar capacity. That’s the highest ever added in a single year and accounts for around 65% of all renewable additions that year.
- Rooftop solar is starting to dominate in cities, especially in Australia and the U.S. It now accounts for 21% of the total installed solar capacity worldwide.
- Solar power now touches the lives of over 1 billion people globally, either through direct household electricity, mini grids in remote areas, or industrial use.
- The average global cost of solar electricity has come down to around $0.015 per kilowatt-hour in sun-rich areas. That’s cheaper than coal, gas, or even most hydro.
- Ten countries, China, the U.S., India, Germany, Japan, Australia, Italy, South Korea, Brazil, and Spain, account for more than 80% of the world’s solar production.
| Indicator | Value (2025) |
| Global Solar Capacity | 1,380 GW |
| China’s Share | 590 GW |
| India’s Total | 90 GW |
| US Solar Capacity | 150+ GW |
| Annual Addition (2024) | 310 GW |
| Rooftop Solar Share | 21% |
| Average Cost (kWh) | $0.015 |
| Top 10 Producers’ Share | 80%+ |
Wind Energy Statistics
 (Source: eia.gov)
- Wind has quietly become one of the most dependable sources of green energy worldwide. It has a huge capacity and consistent growth, especially in large open landscapes and coastal regions.
- The global installed wind capacity now stands at 965 GW in 2025. That’s a tenfold increase from where it was just two decades ago.
- China, once again, leads in wind power with around 430 GW installed. It’s evenly split between onshore and offshore wind, and they plan to double this by 2030.
- The United States has around 146 GW of wind capacity. Most of it is concentrated in the “Wind Belt” stretching from Texas to the Dakotas, where winds are consistently strong.
- Germany has roughly 67 GW installed, with a balanced mix of onshore farms and North Sea offshore installations. Despite limited land, they’ve made it work with policy support.
- India now stands at about 47 GW of installed wind energy. Tamil Nadu and Gujarat are the two states leading the pack due to their long coastlines and strong wind speeds.
- The offshore wind sector is growing fast and now has a global capacity of 84 GW. Countries like the UK and China are investing heavily in floating turbine technology.
- Wind energy now supplies around 10% of global electricity needs. That might not sound massive, but it’s enough to power hundreds of millions of homes and businesses.
- The average cost of generating onshore wind electricity has come down to somewhere between $0.02 to $0.05 per kilowatt-hour, which makes it competitive with fossil fuels.
- The Gansu Wind Farm in China is the world’s largest, with a planned capacity exceeding 20 GW. That’s more than the total power demand of some smaller countries.
- As of 2025, over 90 countries have integrated wind power into their national energy strategies, making it one of the most widely adopted renewable technologies globally.
| Indicator | Value (2025) |
| Global Wind Capacity | 965 GW |
| China’s Wind Power | 430 GW |
| US Wind Capacity | 146 GW |
| India’s Total | 47 GW |
| Offshore Wind | 84 GW |
| Share of Global Electricity | 10% |
| Avg. Onshore Wind Cost | $0.02 to $0.05/kWh |
| Countries Using Wind | 90+ |
Hydropower Statistics
 (Reference: hydropower.org)
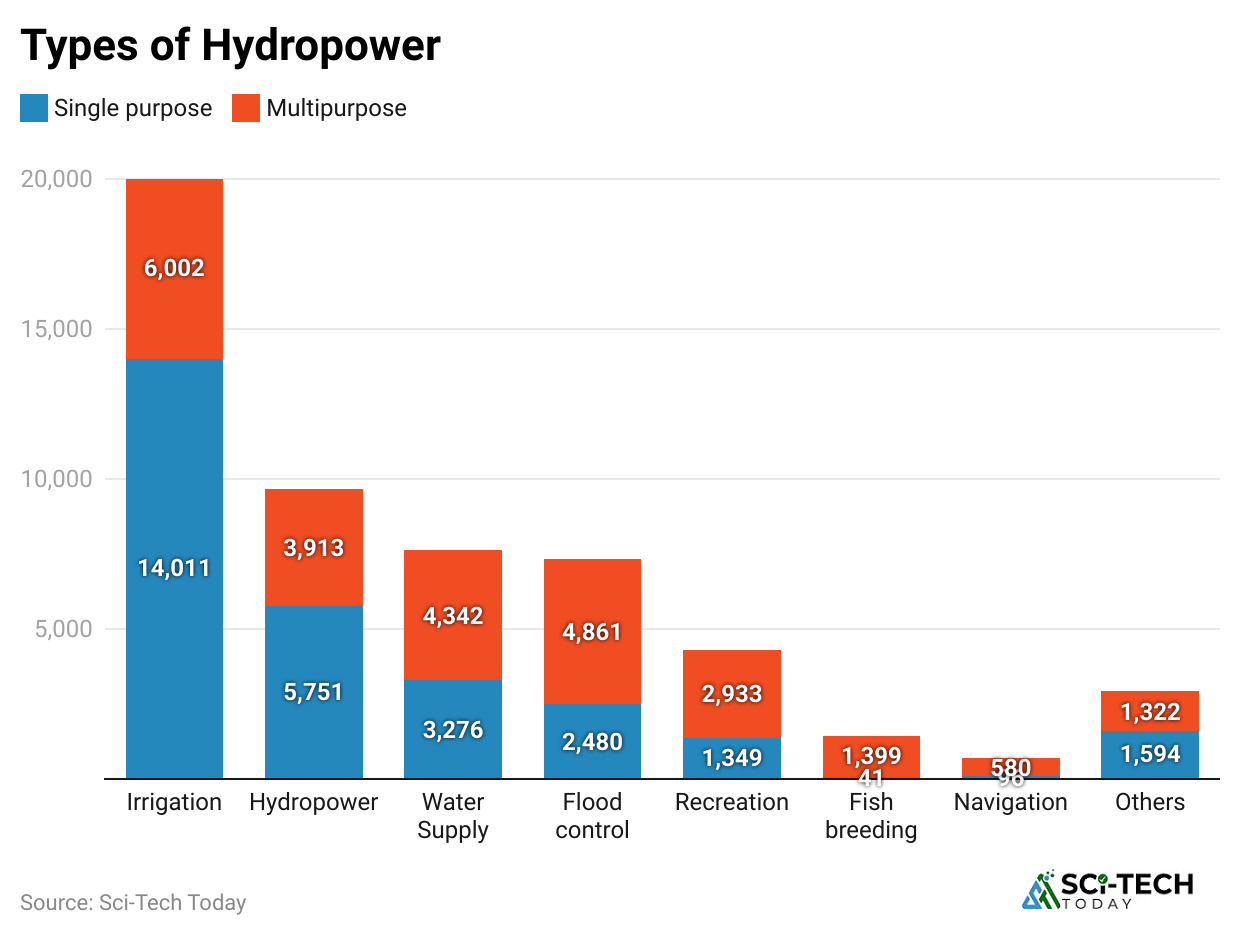
- Hydropower might not be as flashy as solar or wind, but it’s the most mature and widely used source of renewable electricity. And it still makes up the largest chunk globally.
- By 2025, global hydropower capacity will have reached about 1,250 GW. That’s nearly one-third of the world’s total renewable energy portfolio.
- China leads once again, with over 390 GW of hydropower installed. The Three Gorges Dam alone produces more electricity than most countries’ entire energy systems.
- Brazil ranks second in hydropower capacity with over 110 GW, using the Amazon and other major river systems to generate a massive portion of its electricity needs.
- The United States holds around 80 GW of hydropower, much of it built during the 20th century, and still running reliably with some modernization.
- Canada, Norway, and Russia are also among the top hydropower producers, with each country using its natural water resources to power major parts of its grid.
- Hydropower provides roughly 16% of global electricity today, which is more than wind and solar combined in some countries where rivers dominate the geography.
- Africa’s biggest hydropower project, the Grand Ethiopian Renaissance Dam, generates 6.4 GW. It has sparked both energy hopes and political debates in the region.
- Norway is a standout example, getting more than 99% of its electricity from hydropower. They’ve also become a knowledge hub for exporting hydropower tech to other countries.
- Even though it’s renewable, hydro projects come with environmental costs, including deforestation, community displacement, and ecosystem disruptions. These factors have slowed down new project approvals in recent years.
- There are around 60,000 large dams operating around the world today. Many are being upgraded with digital monitoring and flow optimization tech to increase efficiency.
| Indicator | Value (2025) |
| Global Hydro Capacity | 1,250 GW |
| China’s Hydro Output | 390 GW |
| Brazil’s Share | 110 GW |
| US Hydropower | 80 GW |
| Norway’s Hydro Dependency | 99% |
| Global Electricity Share | 16% |
| Largest Project | Three Gorges Dam |
| Active Large Dams | 60,000 |
Geothermal and Biomass Energy Statistics
 (Source: greenesa.com)
- Geothermal and biomass might not get as much attention as solar or wind, but they’re super important for steady, base-load energy, especially where the sun doesn’t always shine or wind doesn’t blow.
- In 2025, global geothermal capacity will have reached around 18 GW. While that might look small compared to solar, it’s one of the most reliable renewable sources since it operates 24/7.
- The United States leads in geothermal energy with about 3.9 GW installed, most of it concentrated in California, Nevada, and Oregon. These plants have been running for decades with stable output.
- Indonesia comes second with approximately 2.8 GW of geothermal capacity. They’ve tapped into their volcanic zones to create one of the most promising geothermal markets in Asia.
- Kenya is the standout in Africa, with geothermal now producing more than 50% of the country’s electricity. That’s a massive win for a country once heavily dependent on imports.
- On the other hand, biomass energy has a total global capacity of around 150 GW in 2025. It’s especially popular in Europe and parts of Asia, where organic waste is repurposed for energy.
- Biomass now contributes about 5% of global renewable electricity, coming from sources like agricultural waste, wood pellets, and even landfill gases.
- Japan and Germany are leaders in biomass, with Germany alone generating over 9 GW from various bio-sources. They also have strong recycling loops to fuel the system.
- Geothermal power costs somewhere between $0.05 $0.10 per kilowatt-hour. It’s not the cheapest, but the reliability makes it worth it in many regions.
- Biomass power tends to be more expensive and harder to scale due to the logistics of waste collection and fuel processing. Still, it’s growing slowly with new development.
- Together, geothermal and biomass provide cleaner base-load energy that helps balance out the fluctuations of solar and wind. That’s why many countries are looking at them as long-term additions.
| Indicator | Value (2025) |
| Global Geothermal | 18 GW |
| US Geothermal | 3.9 GW |
| Indonesia | 2.8 GW |
| Kenya’s Share | 50%+ |
| Global Biomass | 150 GW |
| Germany Biomass | 9+ GW |
| Biomass in Global RE | 5% |
| Avg. Geothermal Cost | $0.05 to $0.10/kWh |
Green Energy Employment Statistics
 (Reference: statista.com)
- Beyond power generation, green energy statistics show a huge economic impact in the form of job creation. Millions of people around the world now work in the renewable energy space.
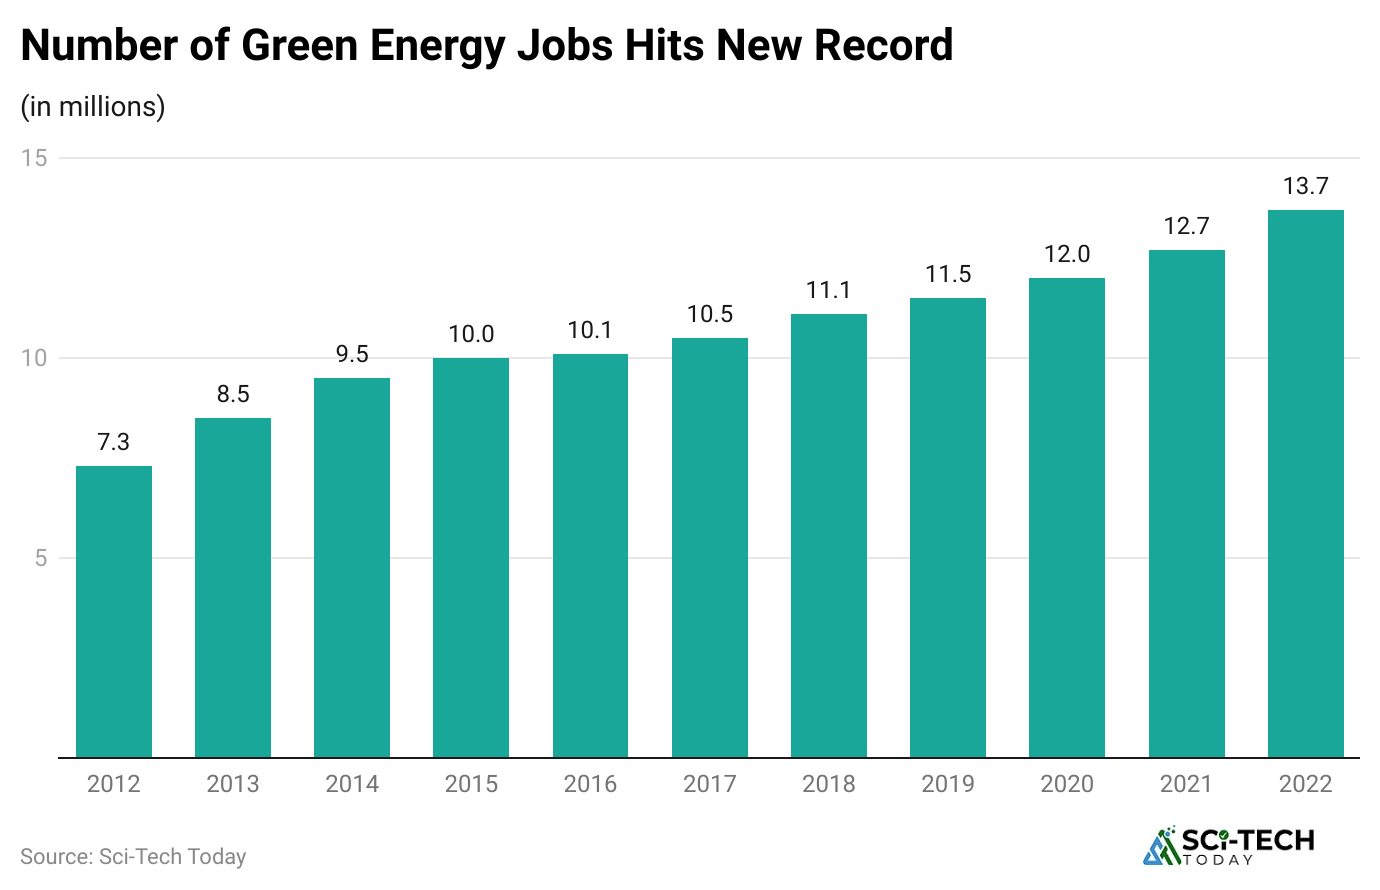
- As of 2024, there are around 13.7 million people employed in the global green energy sector. That includes direct and indirect jobs across manufacturing, installation, maintenance, and research.
- Solar PV continues to lead in employment, providing about 4.9 million jobs worldwide. These range from panel manufacturing to local rooftop installations and utility-scale plant operations.
- Wind energy follows with around 1.5 million jobs. Most of these are in turbine assembly, site development, and offshore installation, especially in Europe and China.
- Hydropower supports about 2 million jobs globally. Since many dams were built decades ago, most current jobs focus on upgrades, maintenance, and modernization.
- China alone is home to more than 4.7 million green energy workers. Their state-led investment approach has made them the top employer in renewables.
- The European Union, across all its member countries, employs roughly 1.3 million people in renewables, with strong contributions from Germany, France, and Spain.
- India has rapidly grown its workforce, with around 870,000 employed in the sector, mostly in solar and small wind projects, often supported by government schemes.
- The gender gap is narrowing, with women now representing about 32% of the renewable energy workforce. It’s still lower than it should be, but improving every year.
- Training programs and green energy certifications have grown by 65% since 2019. This shows growing demand for skilled labor in everything from grid management to climate analytics.
- Projections say by 2030, the total number of green energy jobs could hit 38 million globally. That’s three times today’s number, and it’s already creating ripple effects in education and job markets.
| Indicator | Value |
| Total Jobs (2024) | 13.7 million |
| Solar Jobs | 4.9 million |
| Wind Jobs | 1.5 million |
| Hydropower | 2 million |
| China’s Workforce | 4.7 million |
| India’s Jobs | 870,000 |
| Female Workforce | 32% |
| Jobs by 2030 (projected) | 38 million |
Investment and Financial Trends
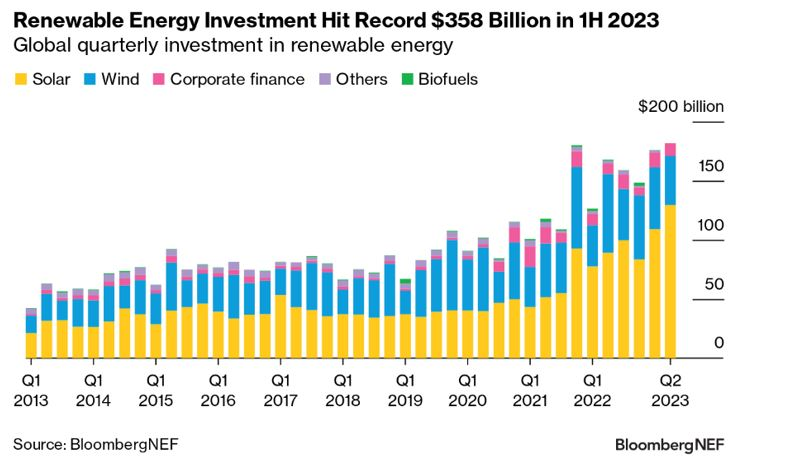 (Reference: bnef.com)
- No matter how good the tech is, nothing moves without funding. And the money behind renewables is now bigger than ever before. Green energy statistics show investors are going all in.
- In 2024, global investments in renewable energy hit $1.77 trillion, which is the highest recorded in history. This includes both private capital and government-backed initiatives.
- Solar power attracted the biggest chunk of this money, with more than $600 billion in new investments. It’s easy to see why solar is scalable, fast to deploy, and cheap to maintain.
- Wind energy followed with $410 billion in investments, including big funding rounds for offshore wind farms and floating turbine prototypes in countries like the UK and Japan.
- Hydropower, though stable, saw around $150 billion in investment. Most of this went into modernizing older dams and building small, community-based hydro projects.
- Battery storage saw a major jump, getting over $145 billion in funding. With energy demand shifting by the hour, reliable storage has become just as important as generation.
- China was the top investor again, pouring over $676 billion into clean energy last year alone. That’s almost 40% of the world’s total green energy funding.
- The United States came next with around $303 billion invested, mostly in solar and battery projects led by both private firms and federal programs like the IRA (Inflation Reduction Act).
- Green bonds, financial instruments specifically for renewable projects, now account for over $1.5 trillion in global markets. They’re helping institutional investors get back into clean energy in a structured way.
- The average return on investment (ROI) for utility-scale solar projects now ranges between 9 to 12% annually, which makes renewables not just sustainable, but also profitable.
- Offshore wind remains the fastest-growing investment sector. It’s pulling in big money from governments and energy giants looking for long-term, stable returns in coastal and marine zones.
| Indicator | Value (2024) |
| Total Investment | $1.77 trillion |
| Solar Funding | $600 billion |
| Wind Funding | $410 billion |
| Hydro Investment | $150 billion |
| Battery Storage | $145 billion |
| China’s Share | $676 billion |
| US Investment | $303 billion |
| Green Bonds | $1.5 trillion |
| Avg. ROI (Solar) | 9 to 12% annually |
Energy Storage, Grid, and Infrastructure
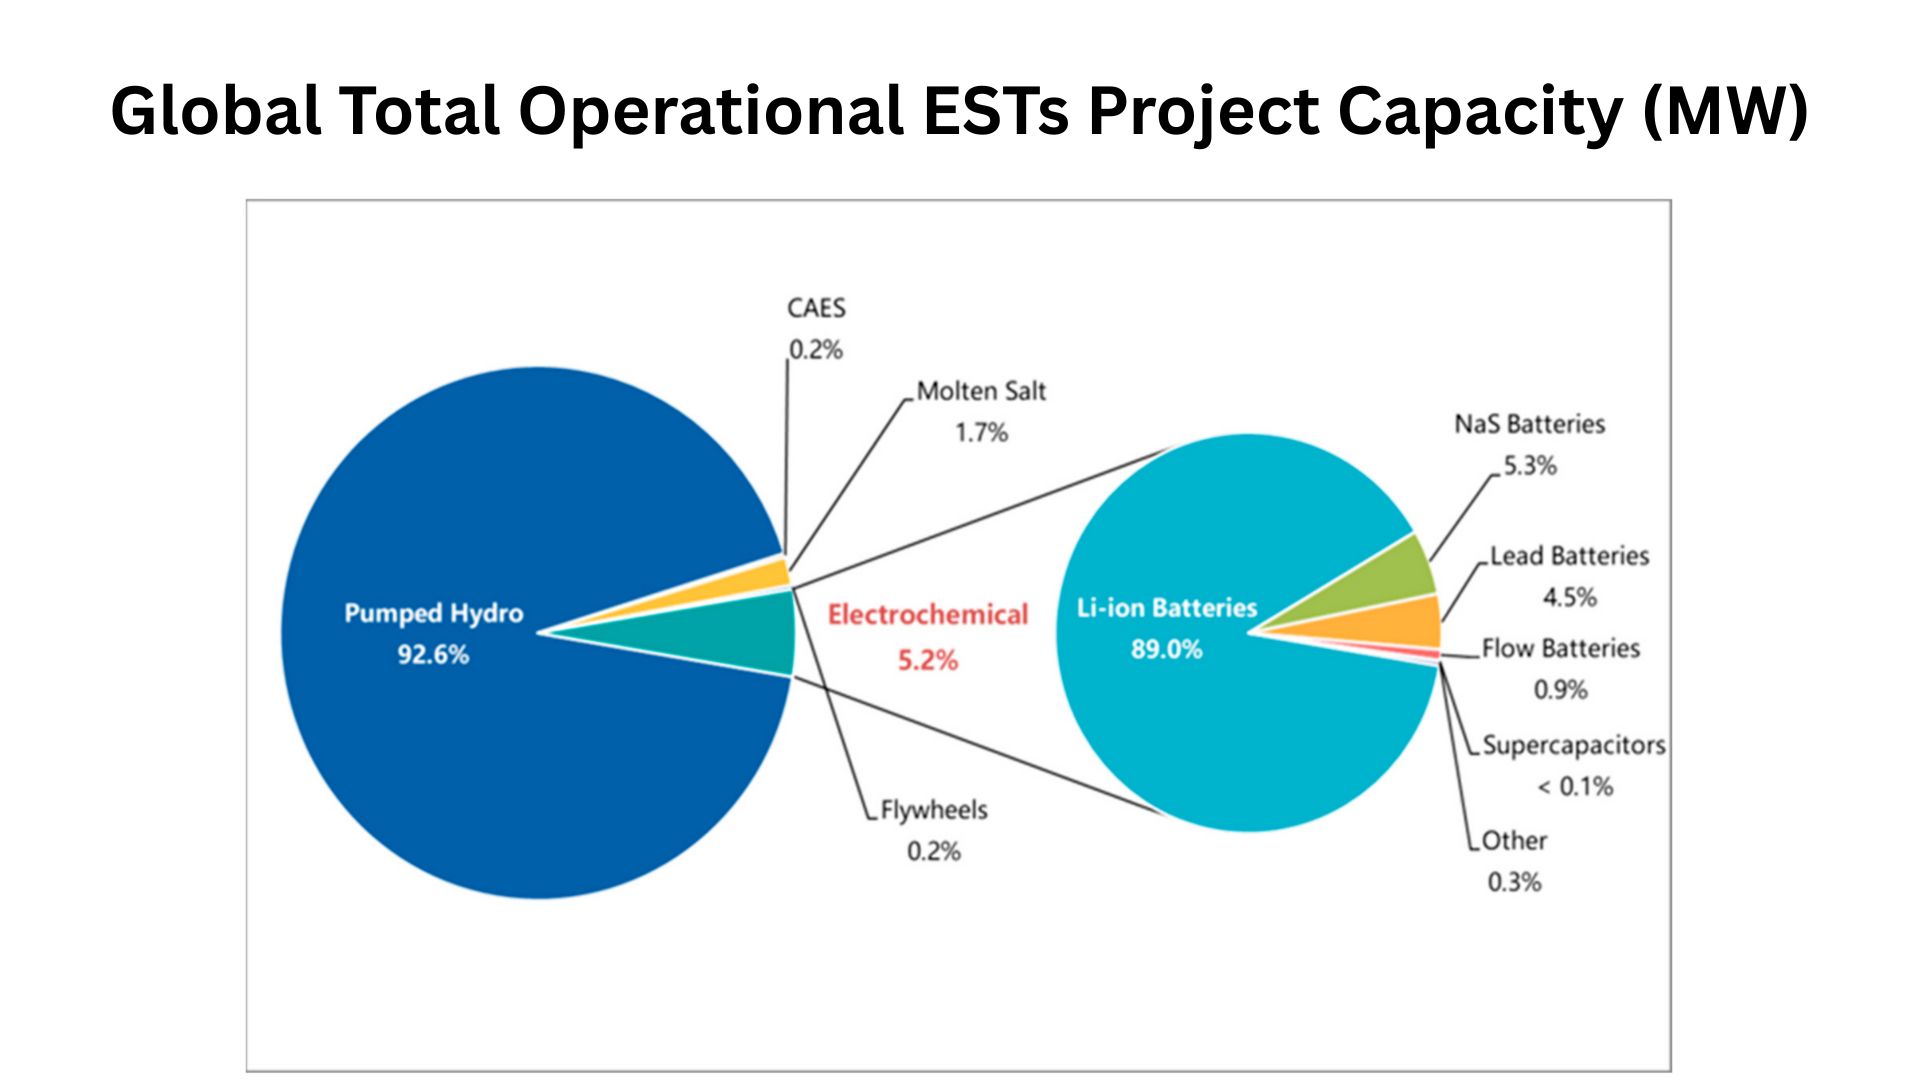 (Source: mdpi.com)
- Green energy can’t function properly without matching investments in storage and smart grid systems. This is the backbone that supports everything else. You can’t power a city with solar if you can’t store or route that power when the sun’s not out.
- In 2025, global battery storage capacity will have surpassed 550 GWh. That’s enough to store several hours’ worth of power for entire countries during high-demand periods.
- Lithium-ion batteries dominate the market, holding a 95% share of all large-scale battery installations. These batteries are also what power most electric vehicles and off-grid solar setups.
- China leads in storage, too, with over 280 GWh installed. Most of this is paired with solar farms in remote areas where grid access is limited.
- The U.S. follows with about 125 GWh of grid-scale battery storage. California alone has rolled out massive projects like Moss Landing and multiple Tesla Megapack farms.
- The global average cost of battery storage is now down to $102 per kilowatt-hour. A decade ago, this was over $1,200. That cost drop is one of the biggest enablers of renewable energy.
- Pumped hydro storage remains the largest form of energy storage globally, with about 170 GW installed. It stores energy by moving water between two reservoirs at different elevations.
- Smart grid investment hit $160 billion in 2024, focused on automated load balancing, real-time analytics, and AI-based distribution controls to prevent outages.
- Grid losses (wasted electricity during transmission) have dropped by 40% in regions using smart grid systems. That’s a huge win for both cost and efficiency.
- Tesla Megapack projects have added over 10 GWh of distributed storage globally. These pre-built units can power small towns and are being used in Australia, the U.S., and parts of Europe.
- Virtual power plants, networks of connected small energy sources, are starting to show real results. Germany and Australia are leading experiments where homes with solar + batteries form collective mini-grids.
| Indicator | Value (2025) |
| Battery Storage | 550 GWh |
| China’s Share | 280 GWh |
| US Storage | 125 GWh |
| Avg. Battery Cost | $102/kWh |
| Pumped Hydro | 170 GW |
| Tesla Megapack Global | 10+ GWh |
| Smart Grid Investment | $160B |
| Grid Loss Reduction | 40% |
Future Projections- 2025 to 2030
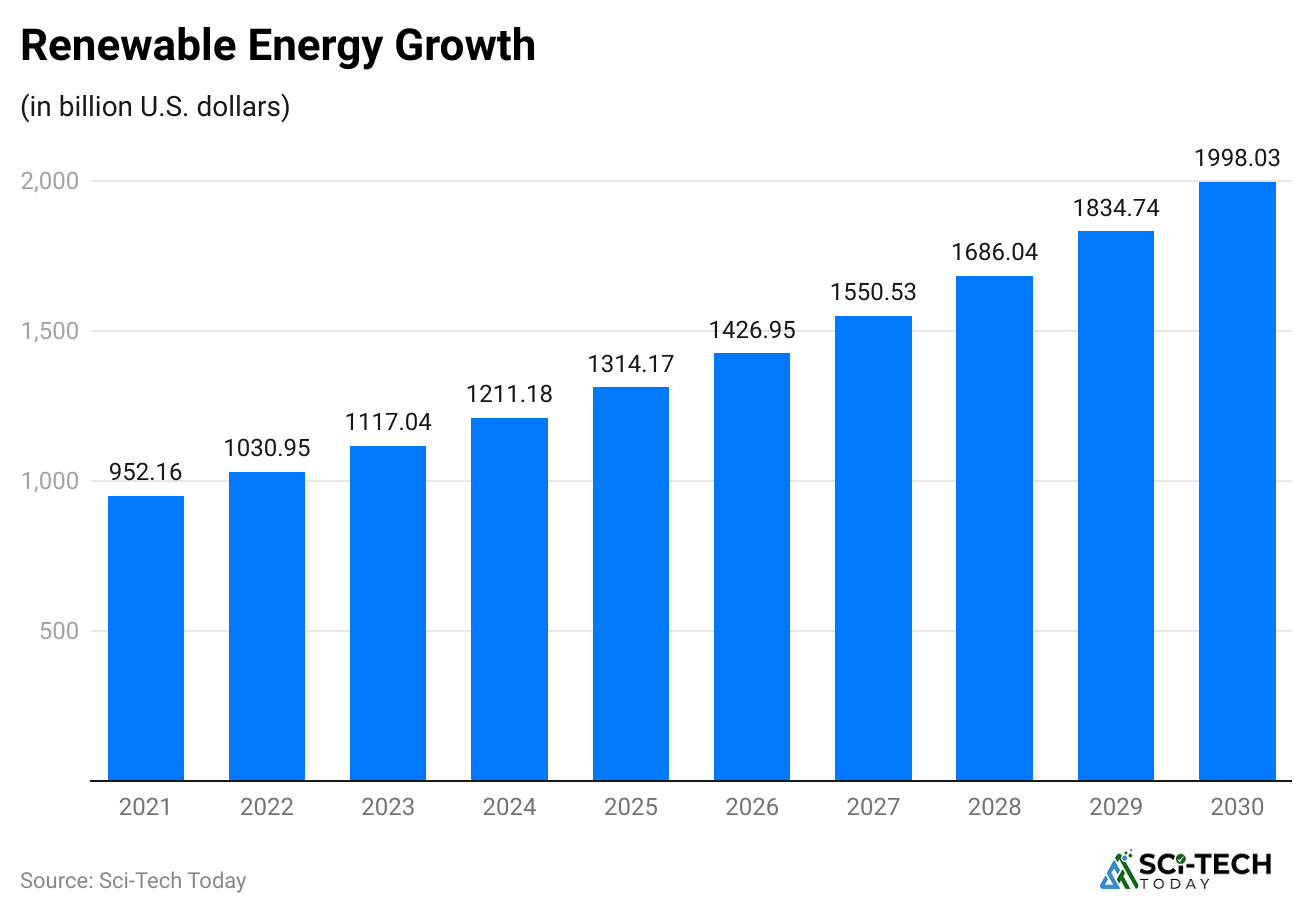 (Reference: studyiq.com)
- This is where green energy statistics stop being about the past and give us a window into what the next 5 years might look like. Spoiler: it’s all going to accelerate faster than most people think.
- Global renewable energy capacity is expected to reach around 6,000 GW by 2030. That’s almost double what we have in 2025, and much of it will come from solar and offshore wind.
- Solar alone could surpass 3,000 GW by 2030. This includes everything from utility-scale plants to residential rooftops in cities across Africa, Asia, and Latin America.
- Wind capacity is expected to reach at least 2,200 GW, with offshore wind playing a much bigger role. Countries like South Korea, Vietnam, and the Philippines are late but scaling fast.
- Green hydrogen production could hit 100 million tons annually. It’s currently small, but governments are betting big on it to power industries and shipping that electricity can’t easily reach.
- Energy storage capacity is expected to cross 1,200 GWh by 2030. Most of this will come from battery technologies, though newer methods like thermal and gravity storage are emerging.
- Global employment in green energy could hit 38 million jobs by 2030. That includes direct, indirect, and induced jobs across energy, transport, agriculture, and construction.
- The cost of solar and wind energy is expected to drop by another 15 to 20% over the next five years. Better manufacturing and local production are key reasons behind this.
- China is expected to account for nearly 50% of all new renewable installations between now and 2030. Their Belt and Road green energy expansion will also push growth in partner nations.
- Africa’s renewables sector is forecast to grow by 250%. Countries like Egypt, Morocco, and Kenya are leading utility-scale projects, while off-grid solar expands in rural zones.
- The share of fossil fuels in global electricity generation is expected to fall below 40% by 2030. That’s down from over 60% just a decade ago, and possibly the most important milestone of all.
| Indicator | Expected by 2030 |
| Global Renewable Capacity | 6,000 GW |
| Solar Total | 3,000 GW |
| Wind Total | 2,200 GW |
| Energy Storage | 1,200 GWh |
| Green Hydrogen | 100M tons/year |
| Green Energy Jobs | 38 million |
| Fossil Fuel Share | 40% |
| Africa’s Growth | +250% |
| Cost Drop (Solar/Wind) | -15% to -20% |
Conclusion
So, if you made it this far, you’ve probably realized something. Every figure in this article tells the story of a world in transition. Whether it’s a billion solar panels, millions of green jobs, or trillions of dollars flowing into the sector, the message is clear.
Green energy statistics aren’t about hype anymore. They’re about measurable change that’s already happening. From China to Kenya, from Tesla batteries to rooftop panels in Tamil Nadu, this is no longer a side movement; it’s becoming the system.
If you’re reading this because you’re curious about where the world is headed, thanks for staying up till the end. If you have any questions, kindly let me know in the comments section.
