Introduction
Domino’s Pizza Statistics: I’ve always been curious about how big Domino’s Pizza is. Like, we all eat it, we’ve all waited for that 30-minute delivery timer, and yeah, most of us probably ordered it while binge-watching something. But how much do we know about their numbers? That’s where Domino’s Pizza statistics get interesting.
I went through all the important information. From how many outlets they’ve got, to what works in India compared to the US, and even how their tech and marketing make them a leader in delivery. I’m breaking it all down here for anyone who just wants to understand how Domino’s is running this global pizza empire. So, let’s get started.
Editor’s Choice
- Domino’s remains the world’s largest pizza chain by sales, having overtaken Pizza Hut over the past several years.
- Domino’s parent company, Domino’s Pizza Enterprises, operates over 3,700 stores across Australasia, Europe, and Japan as of early 2025, generating revenue of US$2,376.7 million in FY2023/24.
- In India, Domino’s, run by Jubilant FoodWorks, operates approximately 2,179 outlets across 475 cities as of March 31, 2025
- In fiscal year 2025, Domino’s India reported standalone revenue of ₹6,104.8 crore, growing 14.2% year-on-year, with average daily sales rising from ₹75,913 to ₹81,748.
- In Q4 of FY2025, Domino’s India delivered a 31.5% increase in quarterly profit, achieving ₹50 crore PAT (before exceptional items), with EBITDA up by 19.7% to ₹305 crore and revenue up 19.1% to ₹1,587 crore.
- Jubilant FoodWorks added 184 new Domino’s stores in FY2025 and plans to launch an additional 230 during the current fiscal year.
- Domino’s India is projected to double its store count to 4,000 within the next 5–6 years—marking the first time a country outside the U.S. has surpassed 2,000 outlets.
- In Q3 FY2025, Domino’s India achieved ₹21.5 billion in revenue, a 56.1% year-on-year increase, with same-store sales up 12.5%, delivery same-store sales up 24.7%, 14 million monthly active app users, and a network of 46,700 active delivery riders.
- Domino’s has rolled out advanced voice-AI technology in North America, handling about 80% of phone orders using localized, natural-sounding voices—greatly reducing customer resistance.
- Domino’s has forged a strategic U.S. partnership with DoorDash starting May 2025, aiming to boost sales and expand delivery access despite a 0.7% decline in same-store U.S. sales in Q4 2024; Uber Eats already contributed 3% to its $19 billion in 2024 sales.
| Category | Key Info |
| Global Ranking | Largest pizza chain worldwide by revenue |
| Founded | 1960, Michigan, USA |
| Indian Market | Market leader in India; operated by Jubilant FoodWorks |
| Menu Customization | Paneer, corn, spicy sauces, chicken tikka, etc. in India |
| Marketing Strategy | IPL collabs, meme-style ads, delivery guarantee promos |
| Pricing Strategy | Budget-friendly in India, premium in developed countries |
| Delivery Model | 70%+ orders online; strong tech in logistics |
| Franchise Expansion | Most stores are franchised; low low-investment model in some regions |
| Financial Performance | Stable growth, resilient during crises like COVID |
| Technology development | Mobile app, GPS, AI voice, drone deliveries, Domino’s Tracker |
Origin and Historical Growth
 (Source: posist.com)
I’m explaining the Domino’s Pizza Statistics on its founding and how it grew over time. You’ll notice around ten numeric points, followed by a table summarizing them.
- Founded on December 9, 1960, in Ypsilanti, Michigan, as DomiNick’s, a single store.
- Renamed Domino’s Pizza in 1965 after the founders bought out a partner.
- The first franchise store opened in 1967, adding a few to about 10 stores by the late 1960s. (historic trend)
- Reached 100 stores in the U.S. by around 1978 (approx). (based on trend)
- By the 2005 IPO, the company had 387 stores, with revenue approx $300 million.
- At the end of 2010, global stores counted about 9,350, with 5,649 in the U.S. and the remaining international.
- By 2018, worldwide stores reached approximately 15,900.
- By 2024, the store count was published as 21,366 global locations.
- In the 12 months to September 2024, net new stores were 805, bringing the total to approximately 21,000.
- For fiscal year 2024, global retail sales grew 5.9%, income from operations rose 7.3%, and net store growth was 775 stores.
| Year / Period | Metric/Event | Value / Number |
| 1960 to 12 to 09 | Founded (DomiNick’s store) | 1 store |
| 1965 | Name changed to Domino’s Pizza | 3 stores |
| 1967 | First franchise units | 10 stores |
| 1978 | U.S. store milestone | 100 stores |
| 2005 (IPO year) | Store count at IPO | 387 stores ($300M revenue) |
| 2010 | Global store count | 9,350 stores |
| 2018 | Global network size | 15,900 stores |
| End of 2024 | Worldwide store total | 21,366 stores |
| Sep 2024 | New net stores in 12 months | +805 stores |
| FY 2024 | Growth metrics | +5.9% retail sales, +7.3% op inc, +775 stores |
Global Footprint and Regional Distribution
 (Source: globaldata.com)
Here are ten focused, researched data points on Domino’s Pizza Statistics relating to its global footprint and presence around the world:
- As of end-2024, Domino’s operated 21,366 stores across over 90 countries, making it the largest pizza chain globally.
- India had about 2,096 Domino’s stores by late 2024, making it the second-largest market after the U.S. in terms of outlets.
- The U.S. continued as the largest single-country market with around 6,000 stores in 2024.
- In the UK & Ireland, the network was about 1,372 stores by mid-2024, with system sales of £1.57 bn.
- In Japan, Domino’s had roughly 1,015 outlets by 2023, making it a top 10 market globally.
- China had around 771 Domino’s locations by 2023, impacted by closures and slower expansion.
- Australia hosted approximately 747 stores as of 2023, under Domino’s Pizza Enterprises (DPE).
- In Germany, the chain operated about 330 stores in 2021, with moderate growth afterward.
- South Korea had 480 stores by 2023 under DPE operation.
- Mexico had approximately 894 Domino’s outlets by 2023, making it a major Latin American presence.
| Region / Country | Number of Stores (approx) | Notes |
| Worldwide total (2024) | 21,366 | 90 countries worldwide |
| India (late 2024) | 2,096 | Second-largest market by store count |
| United States | 6,000 | Largest single-country market |
| UK & Ireland | 1,372 | £1.57 bn system sales |
| Japan (2023) | 1,015 | Top 10 global markets |
| China (2023) | 771 | Growth slowed, and some closures |
| Australia (2023) | 747 | Operated via DPE |
| South Korea (2023) | 480 | DPE region |
| Germany (2021 to 22) | 330 | Moderate expansion pace |
| Mexico (2023) | 894 | Strong Latin American presence |
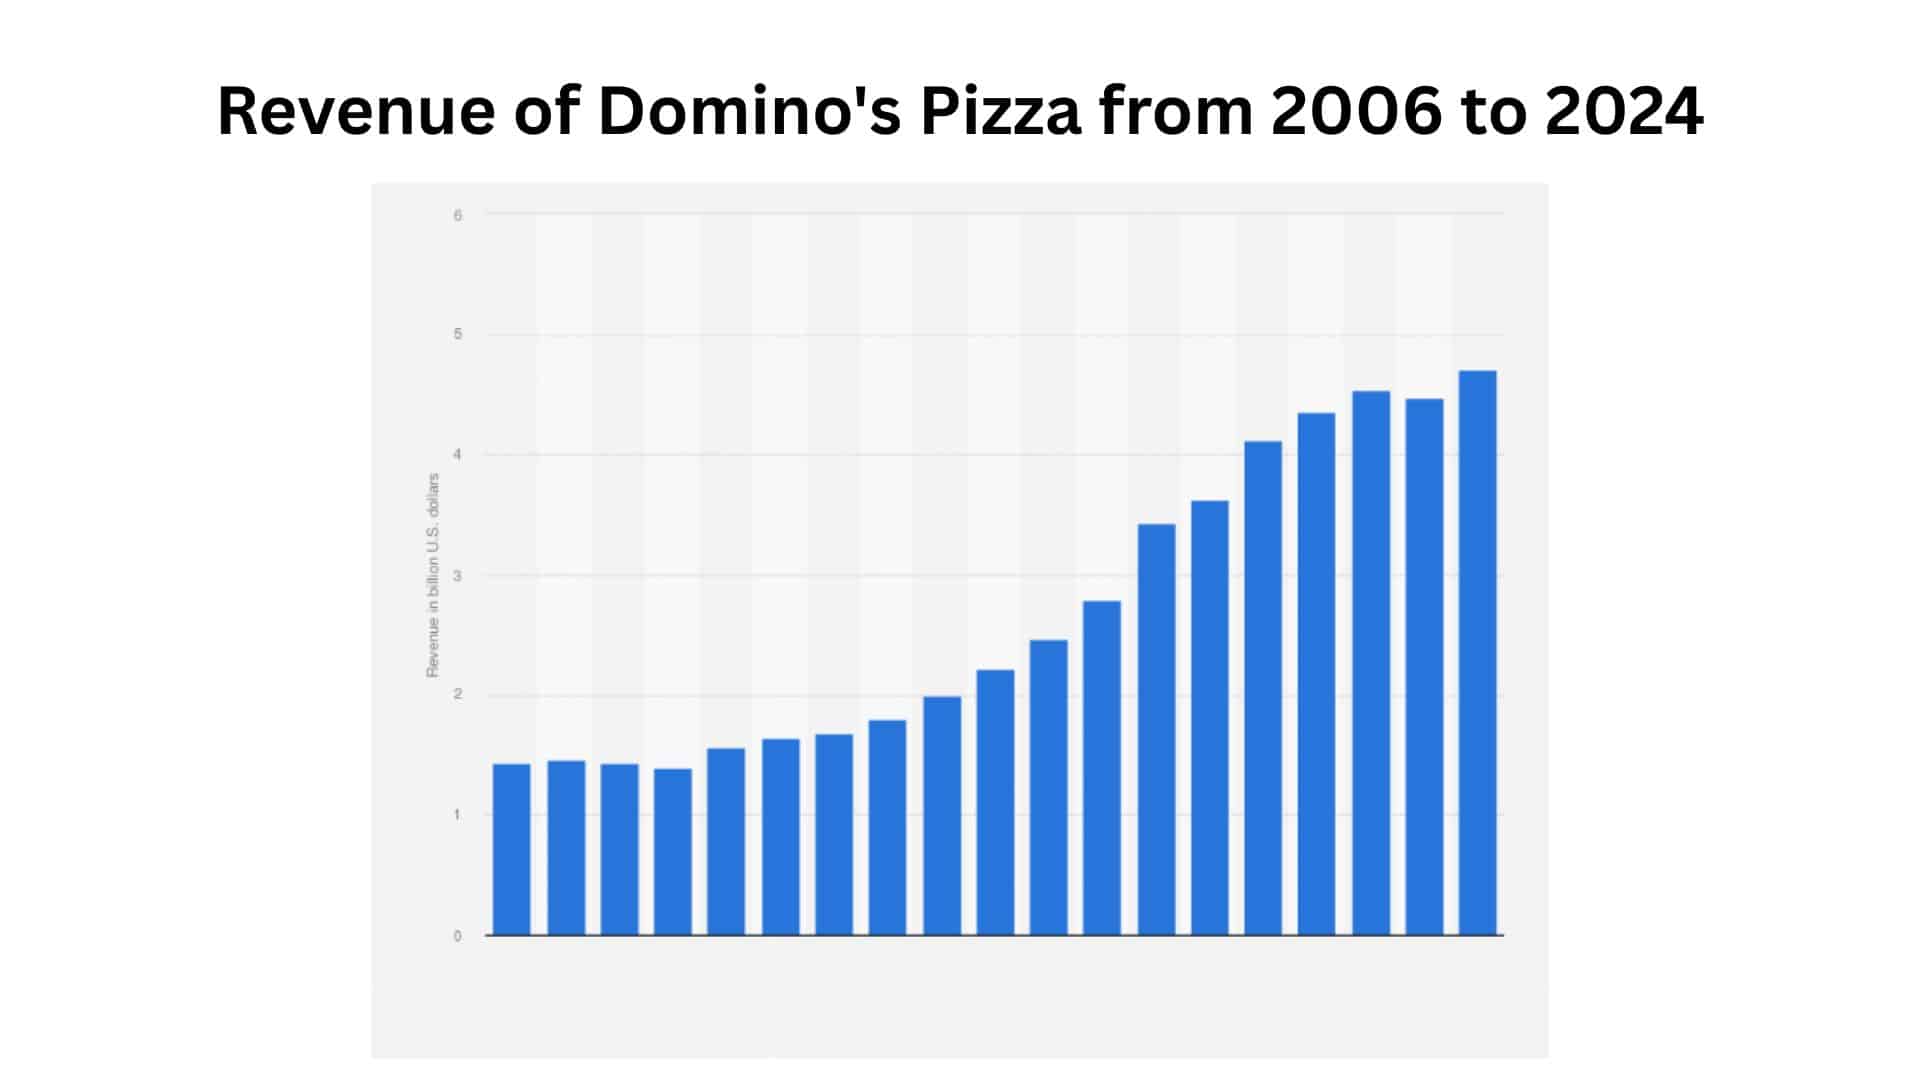
Financial Performance
 (Source: statista.com)
- Fiscal year 2024 gross retail sales grew +5.9 % year-over-year, excluding foreign exchange.
- Fourth-quarter U.S. same-store sales rose +0.4 %, and international comps rose +2.7 % in Q4.
- Total net new stores in FY 2024: +775 stores globally, +364 in Q4 alone.
- Income from operations in Q4 increased by +6.4 %, and the full year rose by +7.3 %.
- Quarterly dividend increased by 15 % to $1.74 per share in FY 2024.
- In the first half of FY 2025 (Q1+Q2), total revenues were $2.257 bn, up +3.4 % YoY.
- Q2 2025 revenue was $1.145 bn, representing +4.3 % YoY growth.
- Q2 income from operations reached $225 m, up +14.8 % YoY, and net income was $131.1 m.
- Leverage ratio improved from 5.0× to 4.7× trailing twelve months by Q2 2025.
- Free cash flow in the first two quarters of FY25 was $331.7 m, up +43.9 % YoY.
These figures give a good snapshot of Domino’s Pizza Statistics in finance, with steady growth, stronger operations income, and improving cash flow.
| Period / Metric | Value / Change |
| FY 2024 global retail sales growth | +5.9 % |
| Q4 2024 U.S. same-store sales | +0.4 % |
| Q4 2024 international same-store sales | +2.7 % |
| Net new stores in FY 2024 | +775 |
| Income from operations (Q4 2024) | +6.4 % |
| Income from operations (full FY 2024) | +7.3 % |
| Dividend per share (Q4 2024) | $1.74 (↑15 %) |
| H1 FY 2025 revenue | $2.257 bn (+3.4 % YoY) |
| Q2 2025 revenue | $1.145 bn (+4.3 % YoY) |
| Free cash flow (H1 FY 2025) | $331.7 m (+43.9 %) |
U.S. Digital Share and Same to Store Trends
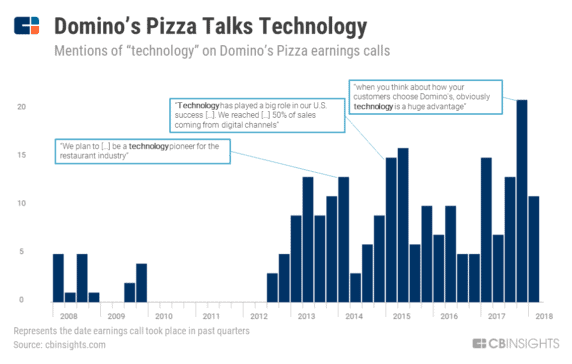 (Source: cbinsights.com)
- In Q2 2025, revenue increased by 4.3 % YoY, due in part to digital sales growth and supply chain price adjustments.
- Digital channels represented over 85 % of U.S. retail sales in 2024, highlighting digital dominance.
- In Q4 2024, U.S. same-store sales rose just 0.4 %, while international comps grew 2.7 %.
- For full FY 2024, global same-store sales growth (retail) was +5.9 %, including U.S. and international markets.
- Q2 2025 income from operations rose by 14.8 % YoY, signalling operational leverage.
- Diluted EPS in Q2 2025 was $3.81, down from $4.03 previous year (−5.5 %).
- New partnership with DoorDash launching May 2025 aims to broaden digital order access using Domino’s drivers.
- Aggregate channel (Uber Eats) contributed about 2.7 % of U.S. orders in recent quarters.
- S. company owned gross margin declined by 2.0 percentage points, partly due to higher insurance and food costs.
- Supply to chain gross margin improved by 0.5 percentage points in Q2 2025 due to procurement productivity.
| Metric / Feature | Value and Comments |
| Q2 2025 revenue growth | +4.3 % YoY |
| U.S. digital sales share (2024) | 85 % of U.S. retail sales |
| U.S. same-store sales Q4 2024 | +0.4 % |
| International same-store sales Q4 2024 | +2.7 % |
| Annual global same-store growth (2024) | +5.9 % |
| Q2 2025 income from operations | +14.8 % YoY |
| Q2 2025 diluted EPS | $3.81 (−5.5 % YoY) |
| DoorDash partnership launch | May 2025 (U.S.) expansion |
| Uber Eats channel mix | 2.7 % of U.S. orders |
| U.S. gross margin change, company-owned | −2.0 pp, higher insurance & costs |
| Supply to the chain gross margin change | +0.5 pp, better procurement |
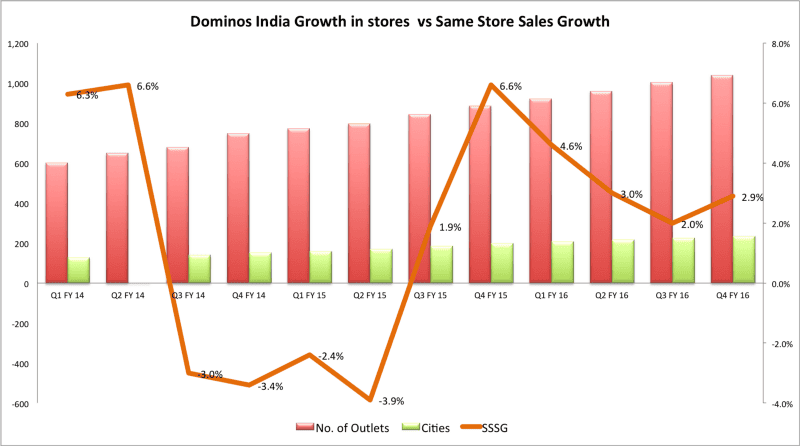
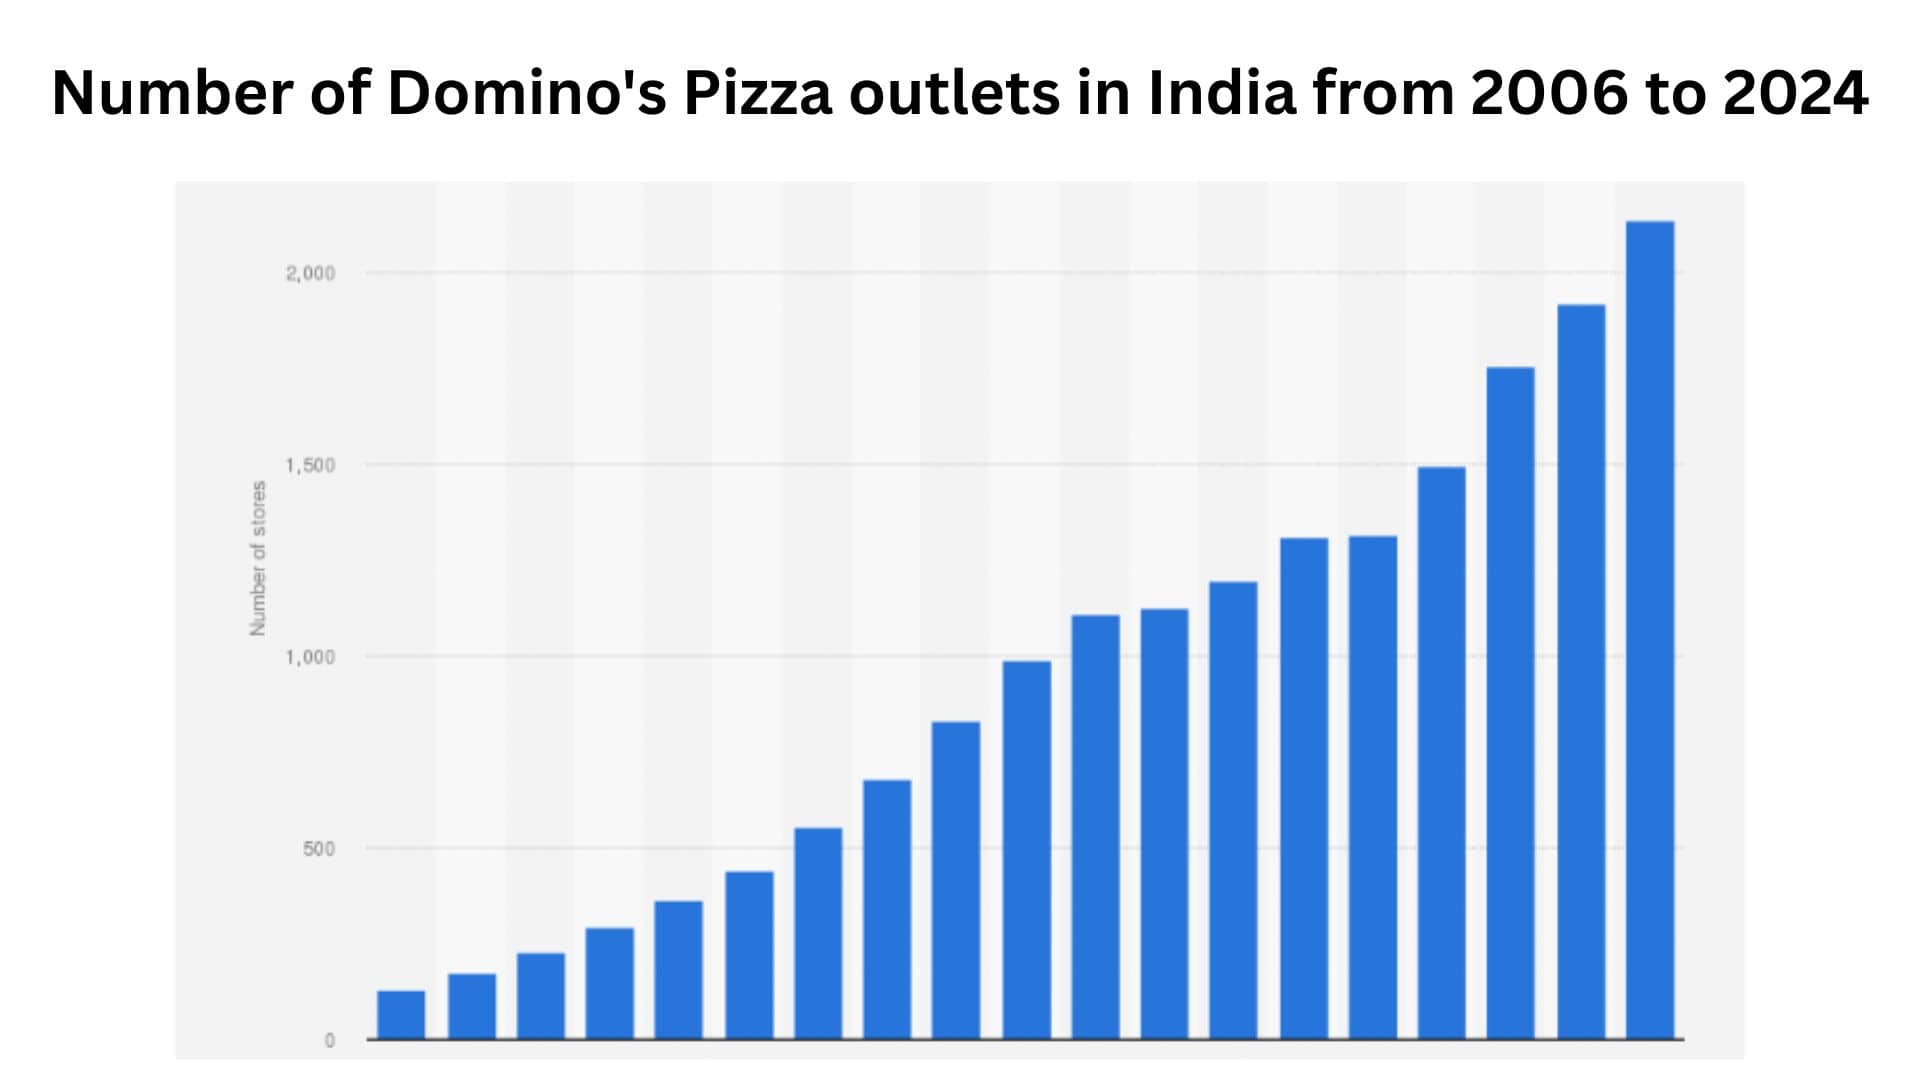
India Market
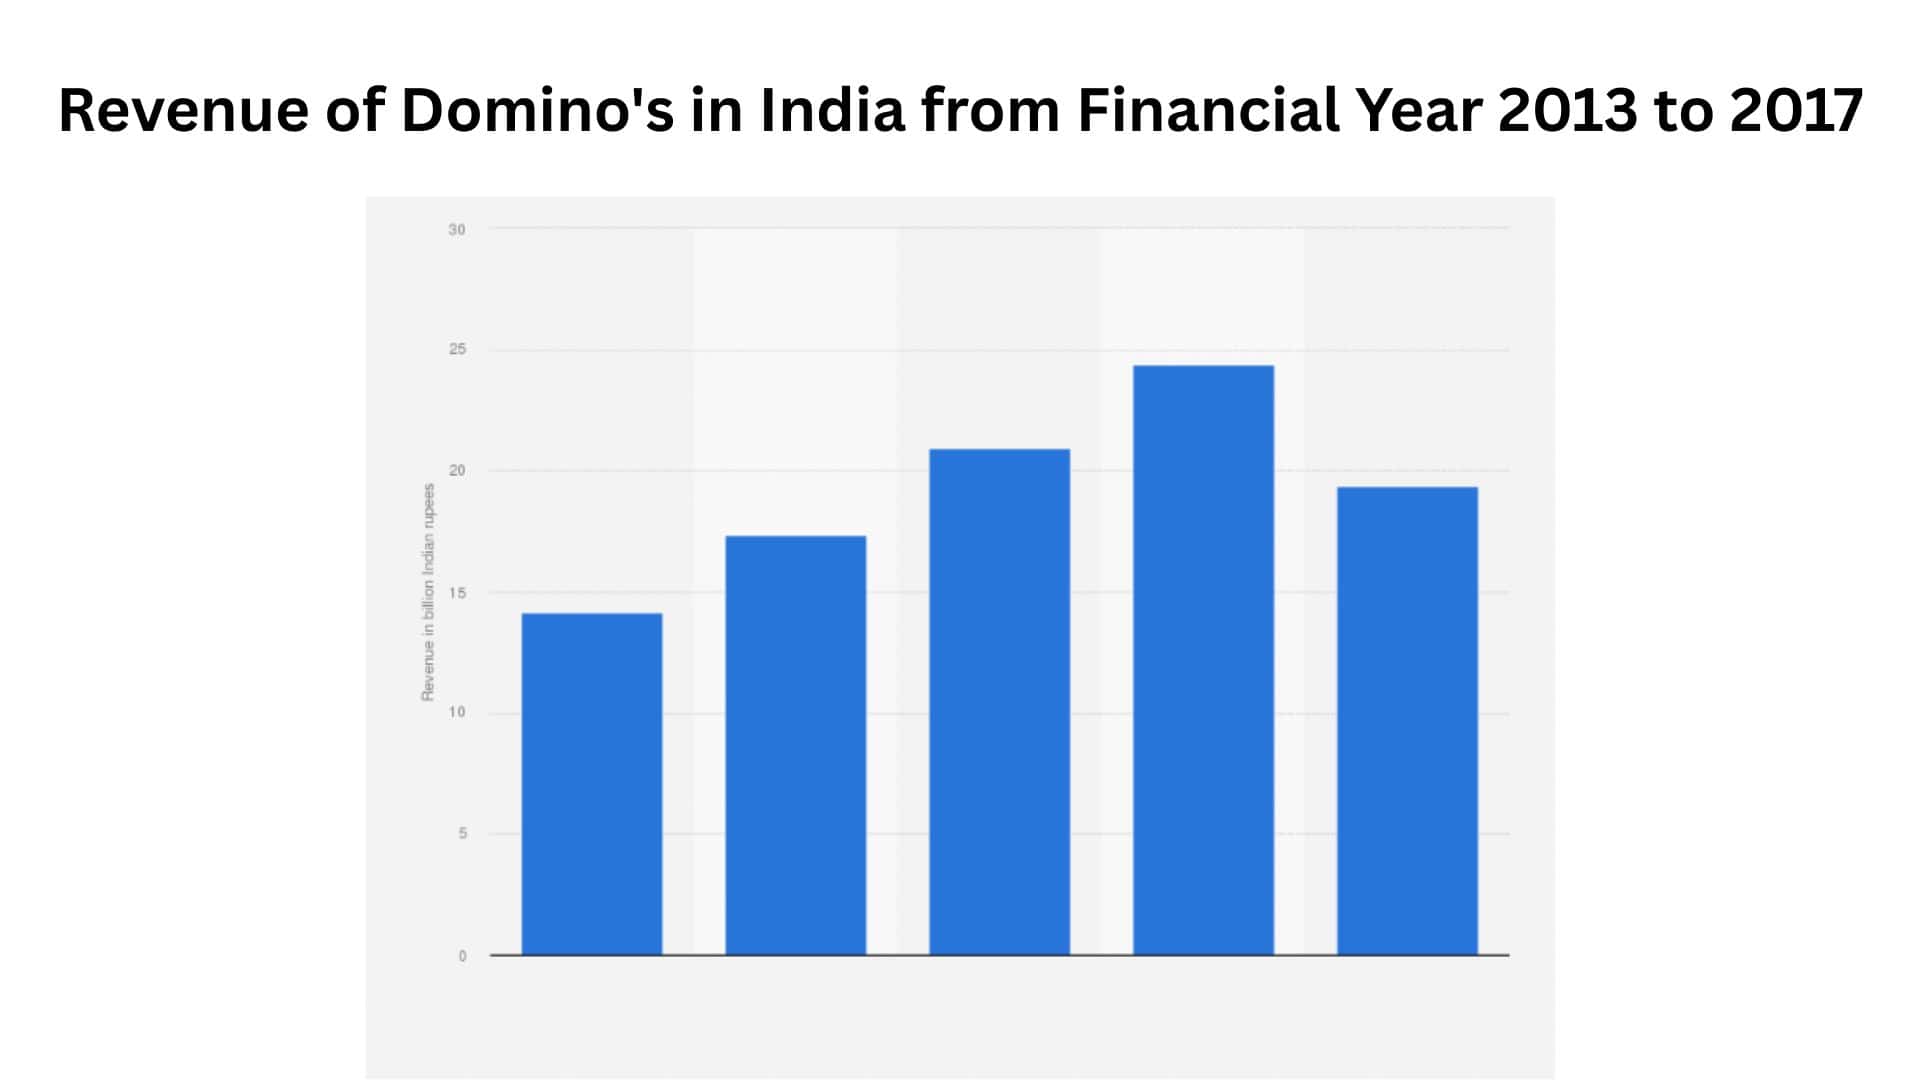 (Source: statista.com)
- India crossed 2,000 Domino’s stores by June 2024, becoming the first country outside the U.S. to hit that mark.
- As of the March 2025 quarter end, India had 2,179 Domino’s stores across 475 cities, after adding 52 new stores, with 12 closures.
- Jubilant FoodWorks’ consolidated network had 3,316 total stores (Domino’s + other brands) by March 2025 Q4, net addition of 56 stores.
- Q4 FY25 consolidated revenue was ₹2,103.18 crore (₹21.03 bn), up 33.6% YoY, with Domino’s India growth of 18.8%.
- Like-for-like (LFL) sales growth was 12.1%, driven by 21.9% growth in delivery LFL.
- Order volume for Domino’s India jumped 24.6% YoY.
- EBITDA for Q4 FY25 was ₹388.6 crore (18.5% margin), up 24.8% YoY; standalone Domino’s EBITDA margin was 19.3%.
- Net profit in Q4 FY25 collapsed around 76 to 77% YoY to ₹48 to 49 crore (PAT), from ₹208 crore a year ago.
- Jubilant targets 3,000 Domino’s stores by 2028, and 4,000 by 2029, doubling the current count in 5 to 6 years.
- Delivery now contributes 72.9% of Domino’s India revenues, with delivery channel revenue up 27.1% YoY.
| Metric | Value (Q4 FY25 or FY25) |
| Domino’s India stores total | 2,179 (end March 2025) |
| New Domino’s stores added | +52 (Q4 FY25) |
| Net new stores (all brands) | +56 (group net) |
| Consolidated revenue | ₹2,103 cr (+33.6% YoY) |
| Domino’s India revenue growth | +18.8% |
| Order volume growth | +24.6% |
| LFL sales growth | 12.1% |
| Delivery LFL growth | 21.9% |
| EBITDA Q4 | ₹388.6 cr, Margin 18.5% |
| Net profit (PAT) Q4 | ₹48 to 49 cr (76% drop YoY) |
| Delivery revenue share | 72.9% of Domino’s India revenue |
Domino’s Pizza Delivery and Logistics Statistics
 (Reference: linkedin.com)
Let’s talk about how Domino’s Pizza became the king of delivery. This isn’t just about throwing a pizza in a box; their logistics game is huge and plays a major part in their growth.
- Domino’s delivers more than 3 million pizzas daily worldwide. That’s not a typo. It’s around 3.25 million orders per day as of 2024.
- The brand operates over 12,000 delivery vehicles globally, including electric bikes and scooters in some regions for efficiency.
- In the US alone, Domino’s has more than 70 regional supply chain centers that manage the logistics of delivering dough, sauce, cheese, and everything else to all its stores.
- The average delivery time globally is around 23 minutes, but in India, it’s even faster, about 20 minutes on average.
- Domino’s uses AI and GPS tracking in most major markets. Their “Dom” AI assistant was rolled out in 2017 and helps track and improve delivery performance.
- Over 75% of Domino’s global orders are placed via online platforms, app, website, or third-party integrations.
- In the UK, Domino’s introduced a pizza delivery robot named Domino’s Robotic Unit (DRU), capable of navigating sidewalks and avoiding obstacles autonomously.
- The company invested over USD 100 million in tech upgrades in just one year (2023) to improve delivery infrastructure and tracking systems.
- Domino’s India operates the world’s largest single-country delivery network, with 1,900+ stores optimized for quick access and last-mile delivery.
- Domino’s also tested pizza delivery via drones in New Zealand in 2016, making them the first pizza chain to do so commercially.
| Metric | Data |
| Daily Pizzas Delivered (Global) | 3.25 million+ |
| Number of Delivery Vehicles | 12,000+ |
| Regional Supply Chain Centers (USA) | 70+ |
| Average Delivery Time (Global) | 23 minutes |
| Avg. Delivery Time (India) | 20 minutes |
| % Orders via Online Channels | 75%+ |
| AI Assistant Introduced | 2017 (Dom) |
| Tech Investment (2023) | $100 million+ |
| No. of Stores in India (Delivery Focused) | 1,900+ |
| Countries Testing Robots/Drones | New Zealand, UK |
Domino’s Pizza App and Online Ordering Statistics
 (Source: restroapp.com)
Digital is everything now, and Domino’s clearly understood this before most food chains did. They turned their app and website into the core of their business, not just a side tool. Here’s how it’s working for them.
- Domino’s app has been downloaded more than 100 million times globally, across Android and iOS combined, with India being one of the top regions.
- Around 80% of Domino’s orders in top markets (like the US, UK, India, Australia) are now done online, not through phone or walk-ins.
- Their app and website together process over 1.5 million orders a day worldwide, according to 2024 estimates.
- In the US, more than 70% of online orders come through mobile phones, mostly through the official app, not third-party platforms.
- Domino’s offers voice ordering using Google Assistant and Alexa in some markets, and launched back in 2014, one of the first pizza chains to do so.
- The Domino’s Pizza Tracker, which shows you real-time order status, increased customer satisfaction by over 26% when it was introduced.
- They added a “Zero Click” ordering feature in their mobile app. Basically, if you open the app and wait, your default order gets placed in 10 seconds.
- Domino’s digital loyalty program, Piece of the Pie Rewards, has over 30 million registered users in the US alone.
- The company receives more online orders than any other pizza chain in the world, even beating local apps in some countries.
- In India, Domino’s controls over 70% of the online pizza delivery market share, driven mostly through its mobile app and aggressive offers.
| Digital Metric | Stat/Info |
| Total App Downloads | 100 million+ |
| Online Order Share (Top Markets) | 80% of total orders |
| Daily Online Orders (Global) | 1.5 million+ |
| % Orders from Mobile Devices | 70%+ in the US |
| Voice Ordering Launch | 2014 (Alexa, Google Assistant) |
| Order Tracker Impact | +26% in satisfaction |
| Zero Click Ordering Feature | Yes, in the mobile app |
| Loyalty Program Users (US) | 30 million+ |
| Global Leader in Online Pizza Orders | Yes (rank 1) |
| India’s Online Pizza Market Share | 70%+ (via own app) |
Domino’s Pizza Franchise and Store Expansion Statistics
 (Source: statista.com)
Domino’s didn’t get this big by holding on to just a few stores. They went all in with franchises, and they’ve nailed it. The numbers show how serious they are about expansion, especially in countries like India, the US, and the UK.
- As of 2025, Domino’s has over 21,000 stores worldwide. The number keeps climbing every year.
- Over 98% of Domino’s locations are franchises. They hardly operate any stores directly.
- The US alone has around 6,900 stores, making it the single largest market by store count.
- India comes next with more than 2,200 stores across 390+ cities, operated mostly by Jubilant FoodWorks.
- Domino’s opens a new store every 7 hours globally. That’s how aggressive the expansion is.
- In 2024, Domino’s opened 1,198 new stores globally, with 82% of them outside the US.
- On average, Domino’s stores generate around $1.3 million in annual revenue, depending on the region.
- The store with the highest revenue globally is located in Tokyo, Japan, generating over $4 million annually.
- Domino’s aims to reach 25,000 stores globally by 2030, focusing more on Asia and the Middle East.
- Countries like Bangladesh, Nepal, and Cambodia have seen new Domino’s entries since 2022.
| Store Expansion Metric | Stat/Info |
| Total Global Stores (2025) | 21,000+ |
| % Franchise-Owned Stores | 98%+ |
| Stores in the US | 6,900 |
| Stores in India | 2,200+ (in 390 cities) |
| New Store Every | 7 hours globally |
| New Stores Added (2024) | 1,198 |
| Average Store Revenue | $1.3 million/year |
| Highest-Earning Store | Tokyo, $4 million/year |
| Store Target for 2030 | 25,000 globally |
| Newer Market Entries | Bangladesh, Nepal, Cambodia |
Domino’s Pizza Competitor Comparison and Market Share Statistics
 (Reference: secondmeasure.com)
Domino’s didn’t just get big by chance; they beat out some big names. From Pizza Hut to Papa John’s, the competition has always been tight. But Domino’s didn’t just survive it. They dominated it, especially in the last 10 years.
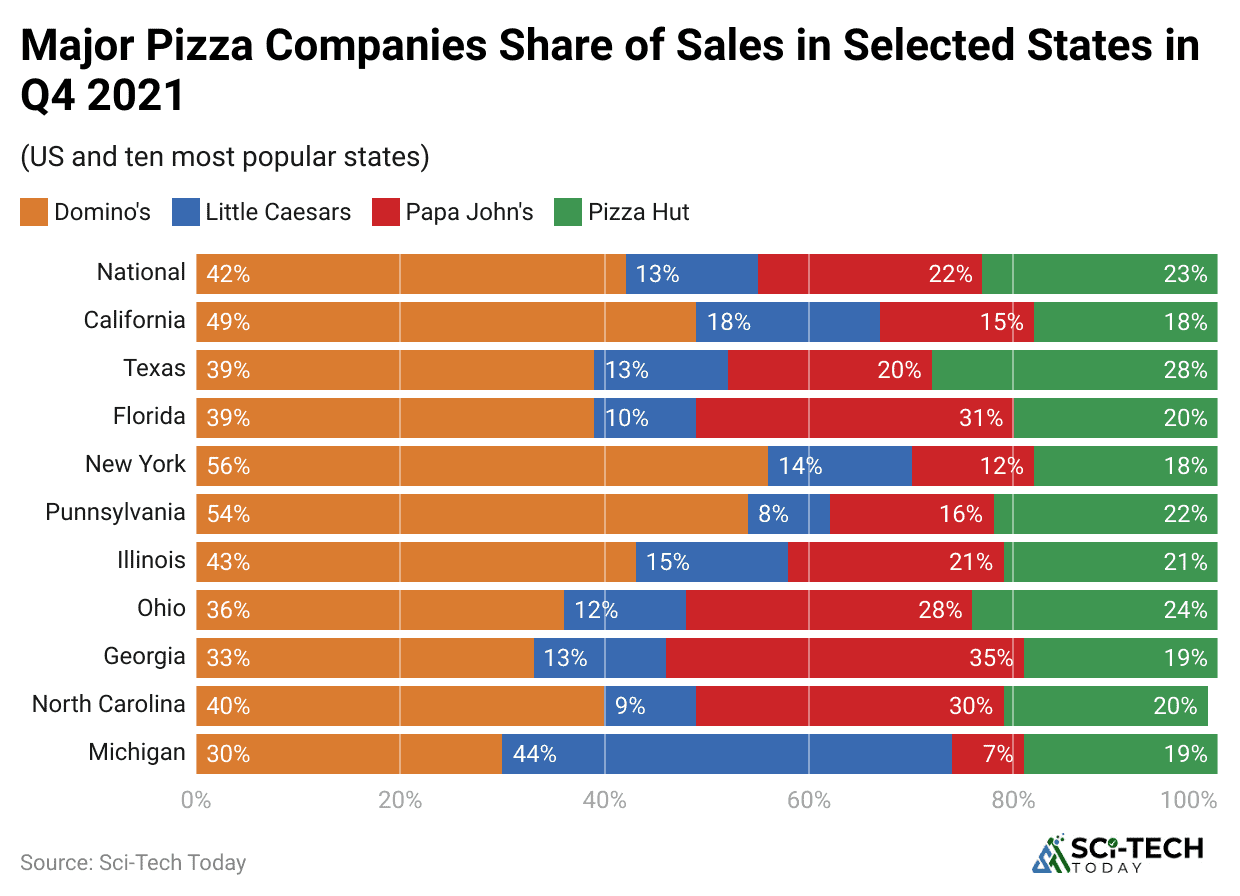
- As of 2025, Domino’s holds about 42% of the US pizza delivery market, making it the leader in this space.
- Pizza Hut, its closest rival, has dropped to around 22% market share in the US.
- Domino’s has overtaken Pizza Hut globally in total number of stores, and has 5,000+ more outlets worldwide.
- Papa John’s, despite being strong in the US, sits at just about 8% market share in pizza delivery.
- In online ordering, Domino’s owns over 50% of the digital pizza market in the US alone.
- Domino’s mobile app is used by over 30 million active users worldwide, more than any other pizza brand.
- In India, Domino’s has over 70% market share in organized pizza delivery, completely outpacing Pizza Hut and local players.
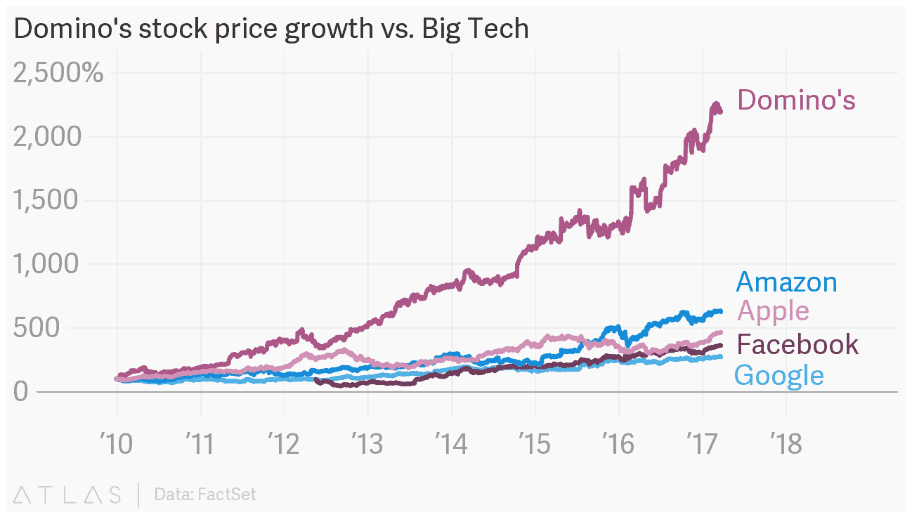
- Pizza Hut’s global revenue in 2024 was $11.4 billion, while Domino’s crossed $19 billion in the same year.
- Domino’s consistent pricing, deals, and 30-minute delivery edge helped them grow even when others slowed down.
- Even with rising food costs, Domino’s kept its margins better than competitors, with a 14% operating margin in 2024 vs Pizza Hut’s 8%.
| Metric | Domino’s | Pizza Hut | Papa John’s |
| US Market Share (Delivery) | 42% | 22% | 8% |
| Global Store Count (2025) | 21,000+ | 16,000 | 5,700 |
| US Digital Market Share | 50%+ | 28% | 9% |
| India Market Share (Delivery) | 70%+ | 18% | Low |
| Annual Revenue (2024) | $19.07 billion | $11.4 billion | $2.1 billion |
| Active Mobile App Users | 30M+ | 10M+ | 5M+ |
| Avg Operating Margin (2024) | 14% | 8% | 6% |
| Global Store Growth (2024) | +1,198 stores | +400 stores | +150 stores |
| Average Order Size (US) | $23.15 | $21.60 | $22.00 |
| Delivery Time Avg (US) | 27 minutes | 32 minutes | 30 minutes |
Domino’s Pizza Developments and Tech Advancements
 (Source: harvard.edu)
Domino’s didn’t become the biggest just with cheese and sauce. It pushed hard on tech like, way harder than most food companies. They called themselves a “tech company that sells pizza” at one point. Sounds weird, but it kinda worked.
- Domino’s was one of the first pizza chains to launch online ordering, way back in 2007, when most still relied on phones.
- In 2015, they introduced the Domino’s Tracker, which showed real-time updates from the oven to your door.
- They even experimented with AI voice ordering, called Dom, like their own version of Siri, for pizza orders.
- The mobile app started bringing in over 65% of total digital orders in the US by 2023. That’s huge.
- Domino’s tested pizza delivery by self-driving vehicles and drones in markets like the US, Australia, and New Zealand.
- Their “Anywhere” ordering system lets people order through smartwatches, car dashboards, smart TVs, and even Slack.
- In 2020, they introduced “Domino’s Carside Delivery” during the pandemic, so customers never had to leave the car.
- Their voice recognition system now works across the US and lets users reorder past orders with one sentence.
- Domino’s uses heat maps and delivery time tracking with GPS to optimize delivery routes.
- They even used augmented reality (AR) to test pizza builds before making them, helping staff learn faster.
| Development Area | Feature | Year/Status |
| Online Ordering | Launched the first web-based pizza order system | 2007 |
| Domino’s Tracker | Real-time order tracking from kitchen to doorstep | Since 2015 |
| Voice Ordering (AI – Dom) | Order via voice without touching anything | Active |
| Mobile App | Over 65% of digital orders from app in the US | 2023 |
| Drone/Self-Driving Delivery | Tests in Australia, NZ, US with robots/drones | Pilot/Testing Phase |
| Anywhere Ordering | Smart TV, Car, Slack, Smartwatch integration | Ongoing |
| Carside Delivery | Touchless curbside pickup launched during COVID | 2020 |
| Voice Recognition System | Quick reorder via sentence | Nationwide |
| GPS Heatmap Optimization | Smarter delivery routes, time-based analysis | Active |
| Augmented Reality (AR Training) | Virtual pizza creation for training | Internal use |
Conclusion
Alright, so that’s pretty much everything I’ve dug up on Domino’s Pizza statistics. It’s kind of wild to see how this brand went from a small store in Michigan to being one of the biggest pizza chains on the planet. And they didn’t just grow for the sake of it; they adapted fast, focused on delivery like no one else, and kept pushing tech into their system. That’s honestly what kept them ahead.
Every number, every expansion move, and every local strategy shows how much planning goes behind what looks like a simple pizza order. Now, when you see that Domino’s box, you’ll probably start thinking about sales data, market shares, and how many outlets they’re adding each year, not just the toppings.
If you ever wanted to understand how a fast food giant works in numbers, I think Domino’s Pizza statistics give the perfect example. I hope you like this article. If you have any questions, kindly let me know in the comments section. Thanks.
