
Introduction
Renewable Energy Adoption Statistics: It’s truly fascinating to see how the world is shifting away from traditional fossil fuels to renewable energy. I would like to discuss more about the renewable energy adoption statistics. In the article, what really fascinated me is the numbers; it tells us we’ve come a long way from what we had.
In recent years, renewable energy has grown from being just an alternative to becoming the main driver of electricity generation in mass markets in many parts of the world. Solar, wind, and hydro are leading the global shift. So, by looking closely at these latest renewable energy adoption statistics, we can understand which countries are pushing ahead, how costs are dropping, and why investments are high.
Overall, this article will be a complete breakdown of the adoption of renewable energy, completely explained with facts and figures. If you’ve ever wanted a clear picture of how big renewable energy is, you have landed in the right place. Let’s get started.
Editor’s Choice
- In 2024, 585 GW of renewable energy capacity was added, making up over 90% of new power additions worldwide.
- Total global renewable capacity hit 4,448 GW in 2024, showing a 1% growth compared to the previous year.
- Clean energy (renewable + nuclear) supplied 9% of the world’s electricity in 2024, the highest share since the 1940s.
- Solar power crossed 2,000 TWh in generation for the first time and now accounts for 9% of global electricity.
- Wind power reached 8.1% of global electricity, making it a critical driver of renewable growth.
- China leads the world, adding more than 278 to 373 GW in one year, with solar and wind dominating.
- India achieved 220 GW of renewables by March 2025, equal to 48% of its installed power capacity.
- Britain generated 08 TWh from solar in just half of 2025, already beating all of 2024’s total output.
- Africa’s renewable boom is driven by massive solar imports, with Algeria seeing a 6,300% surge in panel imports.
- Renewables are now cheaper than fossil fuels, solar costs have fallen 41%, and wind 53% compared to the cheapest coal or gas.
- Investments in clean energy hit $2 trillion in 2024, and installations of solar and wind are happening five times faster than all other sources combined.
- To meet climate goals, the world needs 2 TW of renewables by 2030, requiring 1,044 GW added each year. The current pace is 585 GW, so we’re behind.
- By 2030, renewables are projected to supply 46% of global electricity, with solar overtaking hydropower and wind surpassing nuclear power.
| Category | Data |
| New renewable capacity (2024) |
585 GW (90% of all new power) |
|
Total renewable capacity (2024) |
4,448 GW |
| Clear energy share of electricity (2024) |
40.9% |
|
Solar generation (2024) |
2,000+ TWh (6.9% share) |
| Wind generation (2024) |
8.1% share |
|
China additions (2024) |
278 to 373 GW solar + wind |
| India’s renewable capacity (2025) |
220 GW (48% share of power capacity) |
|
UK solar output (mid-2025) |
220 GW (48% share of power capacity) |
| Africa imports (2025) |
14.08 TWh (33% higher than 2024) |
|
Cost decline |
Solar 41%, wind 53% vs fossil fuels |
| Investments (2024) |
$2 trillion |
|
Needed by 2030 |
11.2 TW capacity (1,044 GW/year) |
| Projection for 2030 |
46% of electricity from renewables |
The Early Stages of Renewable Energy Adoption
 (Source: wernerantweiler.ca)
- Human beings have been using renewable sources for ages now, such as firewood, wind for sailing, and water power for milling grain. That goes back thousands of years.
- Fast-forward to the late 19th century, and the photovoltaic effect was discovered in 1885, though solar wasn’t practical until decades later.
- In 2008, renewable power surpassed conventional power capacity additions in the EU and the US. By 2010, renewables made up about one-third of newly built capacity.
| Era | Moments |
| Ancient times | Biomass, wind, and water power are used for basic needs |
| Late 19th and early 20th century | Solar theory begins with early renewables |
| 2008 to 2010 | Renewables overtake fossil additions in major economies |
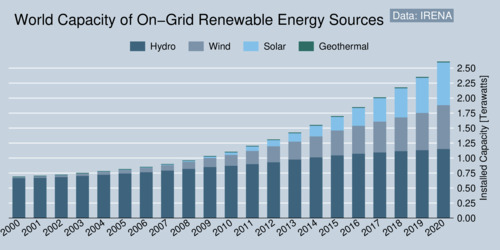
Global Scale Renewable Energy Adoption Today
 (Source: ren21.net)
- In 2024, renewables added 585 GW of capacity, over 90% of all new power capacity.
- Total installed renewable capacity reached about 4,448 GW, a 15.1% increase compared to the previous year.
- Clean energy (renewables plus nuclear) supplied 40.9% of global electricity in 2024, for the first time since the 1940s.
- Solar generation doubled in three years, exceeding 2,000 TWh in 2024.
- Solar made up 6.9% of global electricity; wind around 8.1%and hydro remains the biggest single low-carbon source.
| Renewable Capacity | 2024 Value |
| New renewable capacity added | 585 GW |
| Total global renewable capacity | 4,448 GW |
| Share of global electricity (renewable + nuclear) | 40.9% |
| Solar generation | 2,000 TWh |
| Solar share | 6.9% |
| Wind share | 8.1% |
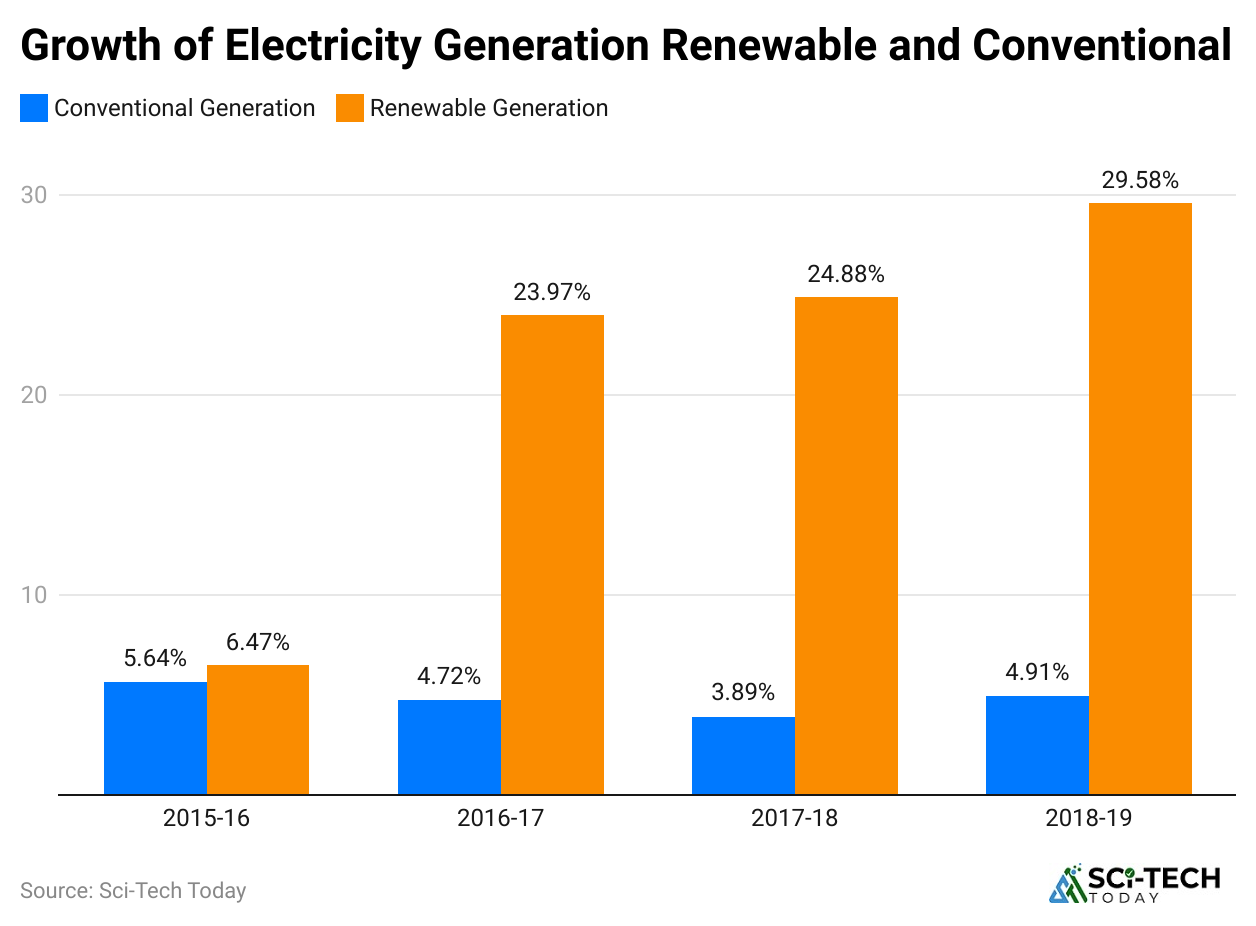
Where It’s Growing Fast – Drivers and Regions
 (Reference: biomedcentral.com)
- Asia led with 72% of new capacity in 2024, driven by China, which added 373 to 278 GW alone (solar + wind).
- India reached 220 GW renewable capacity (by March 2025), including 106 GW solar and 50 GW wind, which is 48% of its total installed power capacity.
- In Britain, by mid-August 2025, solar has produced 14.08 TWh, beating all of 2024, up 33% year-on-year.
- China’s addition, 212 GW solar and 51 GW wind in the first half of 2025; its solar investments helped cut CO2 by 1%.
- Africa is booming in solar imports, in May alone, 1,57 GW of Chinese panels; Algeria’s imports soared 6,300%.
| Region/Country | Highlights |
| Asia/China | Massive additions, leading global growth |
| India | At 220 GW of renewables, aiming for 500 GW by 2030 |
| UK | Solar up 33%; storming past 2024 output mid 2025 |
| Africa | Solar imports surging; solar seen as viable alternative |
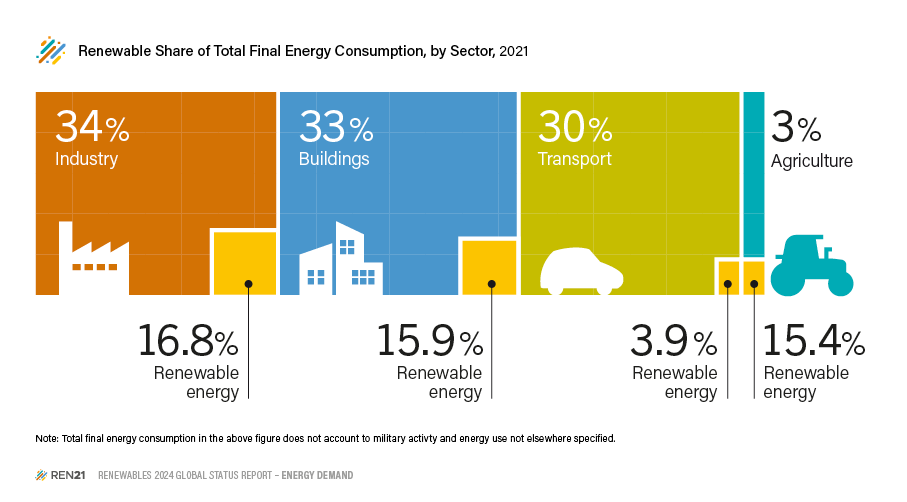
Adoption Momentum and Costs
 (Source: loganwealth.com)
- The UN says in 2024, renewables accounted for 74% of new power growth and 92.5% of new capacity.
- Solar is now 41% cheaper, and wind is 53% cheaper than the cheapest fossil fuels. Investments hit $2 trillion.
- In 2023, zero-carbon sources exceeded 40% of global electricity for the first time, wind & solar 14%, hydro 15%, nuclear 9%.
- Solar and wind installations are happening 5x faster than all other sources combined; solar alone is 100x faster than nuclear.
| Stat | Detail |
| Share of new power growth by renewables | 74% |
| Share of new capacity in 2024 | 92.5% |
| Cost reductions | Solar is 41% cheaper; wind is 53% cheaper |
| Clean electricity share 2023 | 40% |
| Speed of installations | Solar/wind is 5x faster than others |
Goals and Gaps – Still Need More
 (Source: mdpi.com)
- To hit climate goals, we need 11.2 TW of renewables by 2030, which means 1,044 GW of new capacity each year. At current growth (585 GW), we fall short.
- Growth must be 16.6% per year to reach that; 2024 managed 15.1%, so close but not enough.
- Still, in some spots, fossil fuels are adding to global demand, and fossil fuels increased a bit due to heat waves.
| Challenge | Reality |
| Capacity gap | Need 11.2 TW by 2030; current trajectory is short. |
| Growth needed | 16.6% annual vs actual 15.1%. |
| Fossil persistence | Fossil gen grew during heatwave demand spikes. |
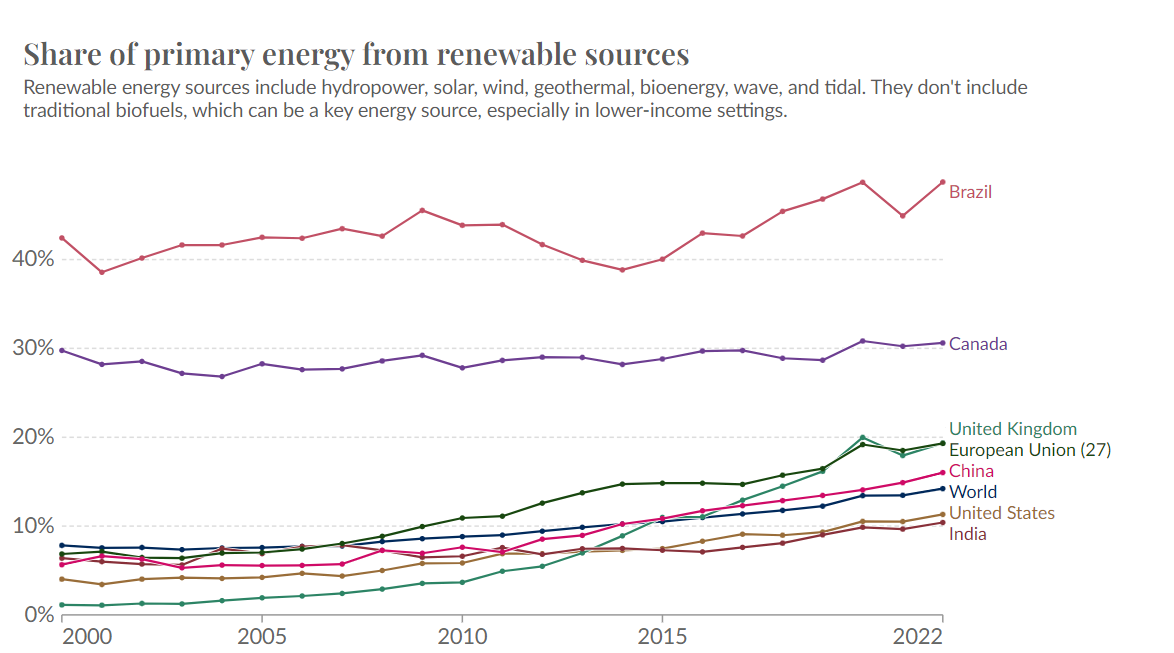
Forecasts and Visions
 (Source: grandviewresearch.com)
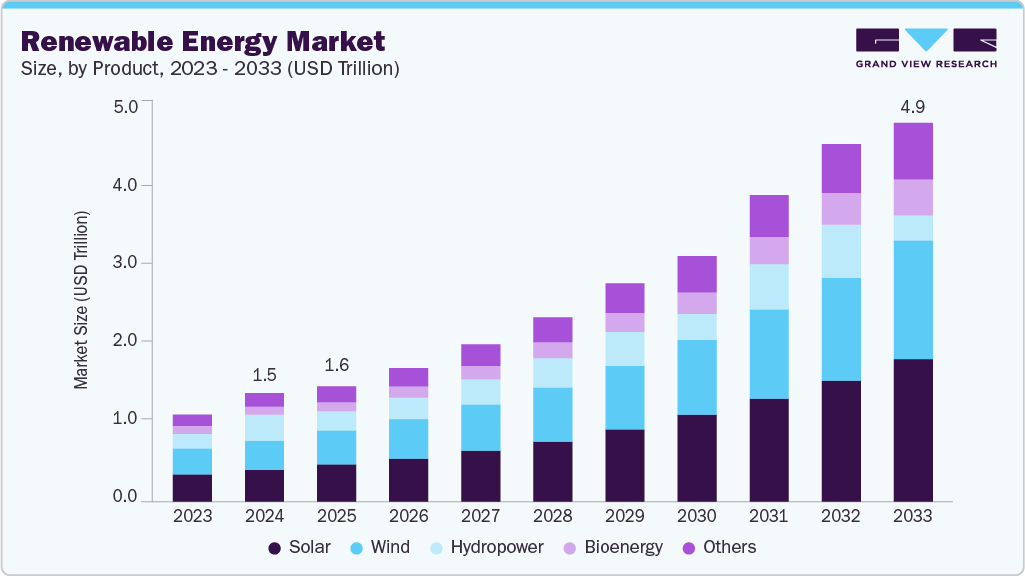
- IEA projects renewables-based electricity to overtake coal in 2025, solar & wind to surpass nuclear by 2026, and solar to top hydropower by 2029. By 2030, renewables will provide 46% of global electricity.
- Global renewable electricity generation is forecasted to hit 17,000 TWh by 2030, nearly double today.
- Battery storage is scaling fast, too, doubling to 420 GW by 2022. Solar costs dropped 89% from 2010 to 2022.
- EVs soared: 10 million sold in 2023 (14% of car sales), up from near zero in 2010.
| 2030 | Details |
| Renewable share | 46% of electricity |
| Total renewable generation | 17,000 TWh |
| Solar cost drop | 89% since 2010 |
| Battery storage | 420 GW by 2022 |
| EV adoption | 14% of global car sales (2023) |
Conclusion
So, overall, by looking at these renewable energy adoption statistics, one thing is very clear: renewables have become the backbone of future growth. Solar and wind are leading the way with record numbers, while countries like China and India are proving how fast large-scale adoption can happen when there is high investment.
At the same time, these numbers also remind us that the arc is not finished. The world still needs to add much more capacity every year to stay on track with climate goals. Costs are coming down, investments are higher than ever, and public awareness is stronger, but the gap between where we are and where we need to be is still high.
If we keep pushing at the same pace or even faster, the next decade could be remembered as the time when renewables finally overtook fossil fuels for good. The statistics show the progress, but they also highlight the urgency. Renewable energy adoption is the direction the world is heading, and every number proves that the shift is already well underway. I hope you like this article. If you have any questions, kindly let me know in the comments section. Thanks.
