





Brief Introduction
Galaxy Formation Statistics: Galaxy formation simply means how our universe built its grandest structure. After the Big Bang, the cosmos was mostly just gas and dark matter. Over billions of years, gravity pulled this matter together, making the first stars and slowly creating the galaxies we see today.
When we say galaxy formation, we are really talking about numbers. How many galaxies exist, when stars formed the fastest, how dark matter shaped them, and how collisions changed them. Today, we estimate there may be around 2 trillion galaxies, with star formation peaking about 10 billion years ago.
In this article, I’ll completely walk you through galaxy formation statistics, showing not just how galaxies formed, but how scientists measure and understand it. Without further ado, let’s get started.
Editor’s Top Recommendations
- Galaxy formation began nearly 13 billion years ago, only a few hundred million years after the Big Bang.
- The universe may contain around 2 trillion galaxies, according to the latest Hubble and JWST estimates.
- Star formation peaked around 10 billion years ago, with galaxies producing stars at rates up to 100 times faster than today.
- Dark matter halos play a central role in pulling gas together, making galaxy formation possible.
- Collisions and mergers shaped galaxy structure, with large galaxies often built by consuming smaller ones.
- Our own Milky Way Galaxy formed roughly 6 billion years ago and still grows by merging with dwarf galaxies.
- About 70% of galaxies in the universe are spiral or irregular, while 30% are elliptical, showing how formation pathways differ.
- Supermassive black holes at galaxy centers grew alongside their host galaxies, linking galaxy formation with black hole evolution.
- On average, galaxies form stars at rates between 1 and 100 solar masses per year, but starburst galaxies can go much higher.
- By studying Galaxy formation statistics, scientists can trace the universe’s history and predict its future structure.
| Aspect | Insights |
| Age of first galaxies |
Around 13 billion years ago |
|
Total galaxies in the universe | 2 trillion |
| Peak star formation era |
8 to 10 billion years ago |
|
Average star birth rate | 1 to 100 solar masses per year |
| Spiral vs Elliptical Galaxies |
70% spirals/irregulars, 30% ellipticals |
|
Milky Way age | 13.6 billion years |
| Role of dark matter |
Backbone for galaxy growth |
|
Impact of mergers | Major driver of galaxy growth |
| Central black holes |
Present in nearly every galaxy |
|
Ongoing growth |
Galaxies are still evolving today |
Origin and Timeline
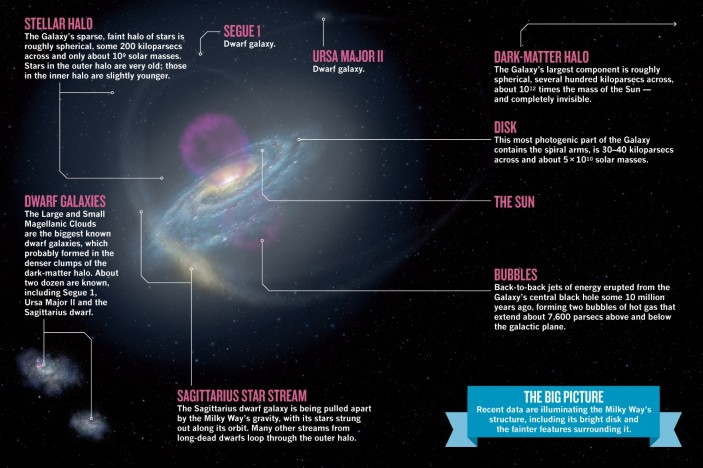
(Source: nature.com)
- The universe began nearly homogeneously, and tiny fluctuations grew under gravity into dark matter halos.
- The first stars (Pop III) likely formed inside small halos at redshifts roughly 20 to 30, a few hundred million years after the Big Bang.
- Between redshifts 6 and 15, the universe went through reionizations. The earliest galaxies contributed ionizing photons, but they were rare and faint.
- Observationally, reionization ended by 6 according to quasar absorption spectra and cosmic microwave background constraints.
- The densest buildup of stars across the universe happens around 1.5 to 2. This era, sometimes called “cosmic noon,” is where galaxy growth via cold gas accretion and mergers is most rapid.
- The cosmic star formation rate density (SFRD) peaks here, a core number for galaxy formation.
- After the peak, the global SFRD declines by roughly an order of magnitude to 0, leaving the present universe dominated by fewer actively star-forming systems and many quiescent galaxies.
| Epoch | Redshift | Age (approx) | Key process |
| First stars | 20 to 30 | 100 to 300 Myr | Pop III star formation in minihalos |
| Reionization end | 6 | 1 Gyr | The universe becomes ionized; first galaxies are abundant |
| Cosmic noon | 1.5 to 2 | 3 to 4 Gyr | Peak Galaxy Formation: star formation |
| Decline to present | 0 | 13.8 Gyr | Quenching, mergers, and formation of passive galaxies |
How Many Galaxies Are There?
(Source: wikipedia.org)
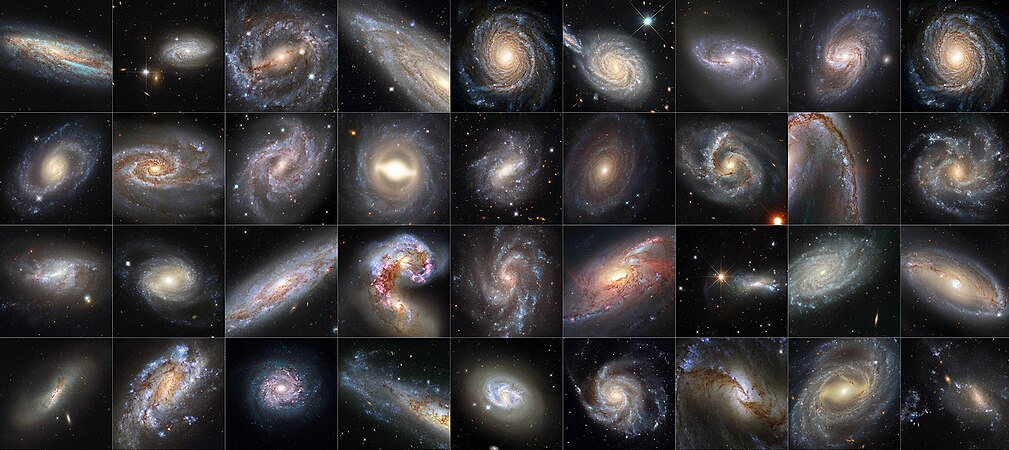
- Work combining deep Hubble fields with extrapolations for faint, small galaxies estimated there are roughly 2 trillion galaxies in the observable universe, an order of magnitude above older 2000s estimates of a few hundred billion.
- The figure is derived through integration of mass functions of stars observed and taking into consideration those that lie beneath the current limits of observation.
- The 2 trillion is a figure based on a model-dependent estimation. This figure is influenced by the value of the low-mass slope of the galaxy mass function and the abundance of ultra-faint galaxies at high redshifts.
- Deep Hubble images (HUDF, XDF) show thousands of galaxies in a tiny patch, and wide surveys like SDSS provide spectroscopic samples of up to a million galaxies for robust low-redshift statistics.
- Together, deep + wide is how we translate local snapshots into a global galaxy census.
| Quantity | Typical Value |
| Observable galaxy estimate (extrapolated) | 2 x 10 power 12 galaxies |
| Galaxies in the Hubble Ultra Deep Field | 10,000 in a tiny patch |
| Spectra in SDSS (approx) | 0.9 to 1 million galaxy spectra in older releases; DR16+ expands coverage |
The Cosmic Star Formation History
(Source: caltech.edu)
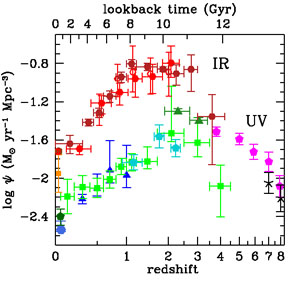
- The cosmic star formation rate density peaks around 1.9, roughly 3.5 Gyr after the Big Bang, and then declines.
- Typical SFRD values: order of 0.1 M at the peak, falling to around 0.01 to 0.02 M in the local universe, depending on calibration and IMF assumptions.
- These are the backbone numbers used to calibrate galaxy formation models.
- Roughly half of the stars that exist today formed before 1.3, and only a small fraction formed during reionization.
- These integrals of the SFRD give the stellar mass history used to check models of galaxy formation.
- New JWST data at very high redshifts are forcing re-evaluation of the earliest SFRD points because unexpectedly massive and luminous early galaxies have been found. They could increase estimates of high SFRD and shift some integrals.
| Redshift | SFRD |
| 0 (today) | 0.01 to 0.02 |
| 1.9 (peak) | 0.1 (order of magnitude) |
| 6 (reionization) | 0.01 |
The Galaxy Stellar Mass Function
(Source: researchgate.net)
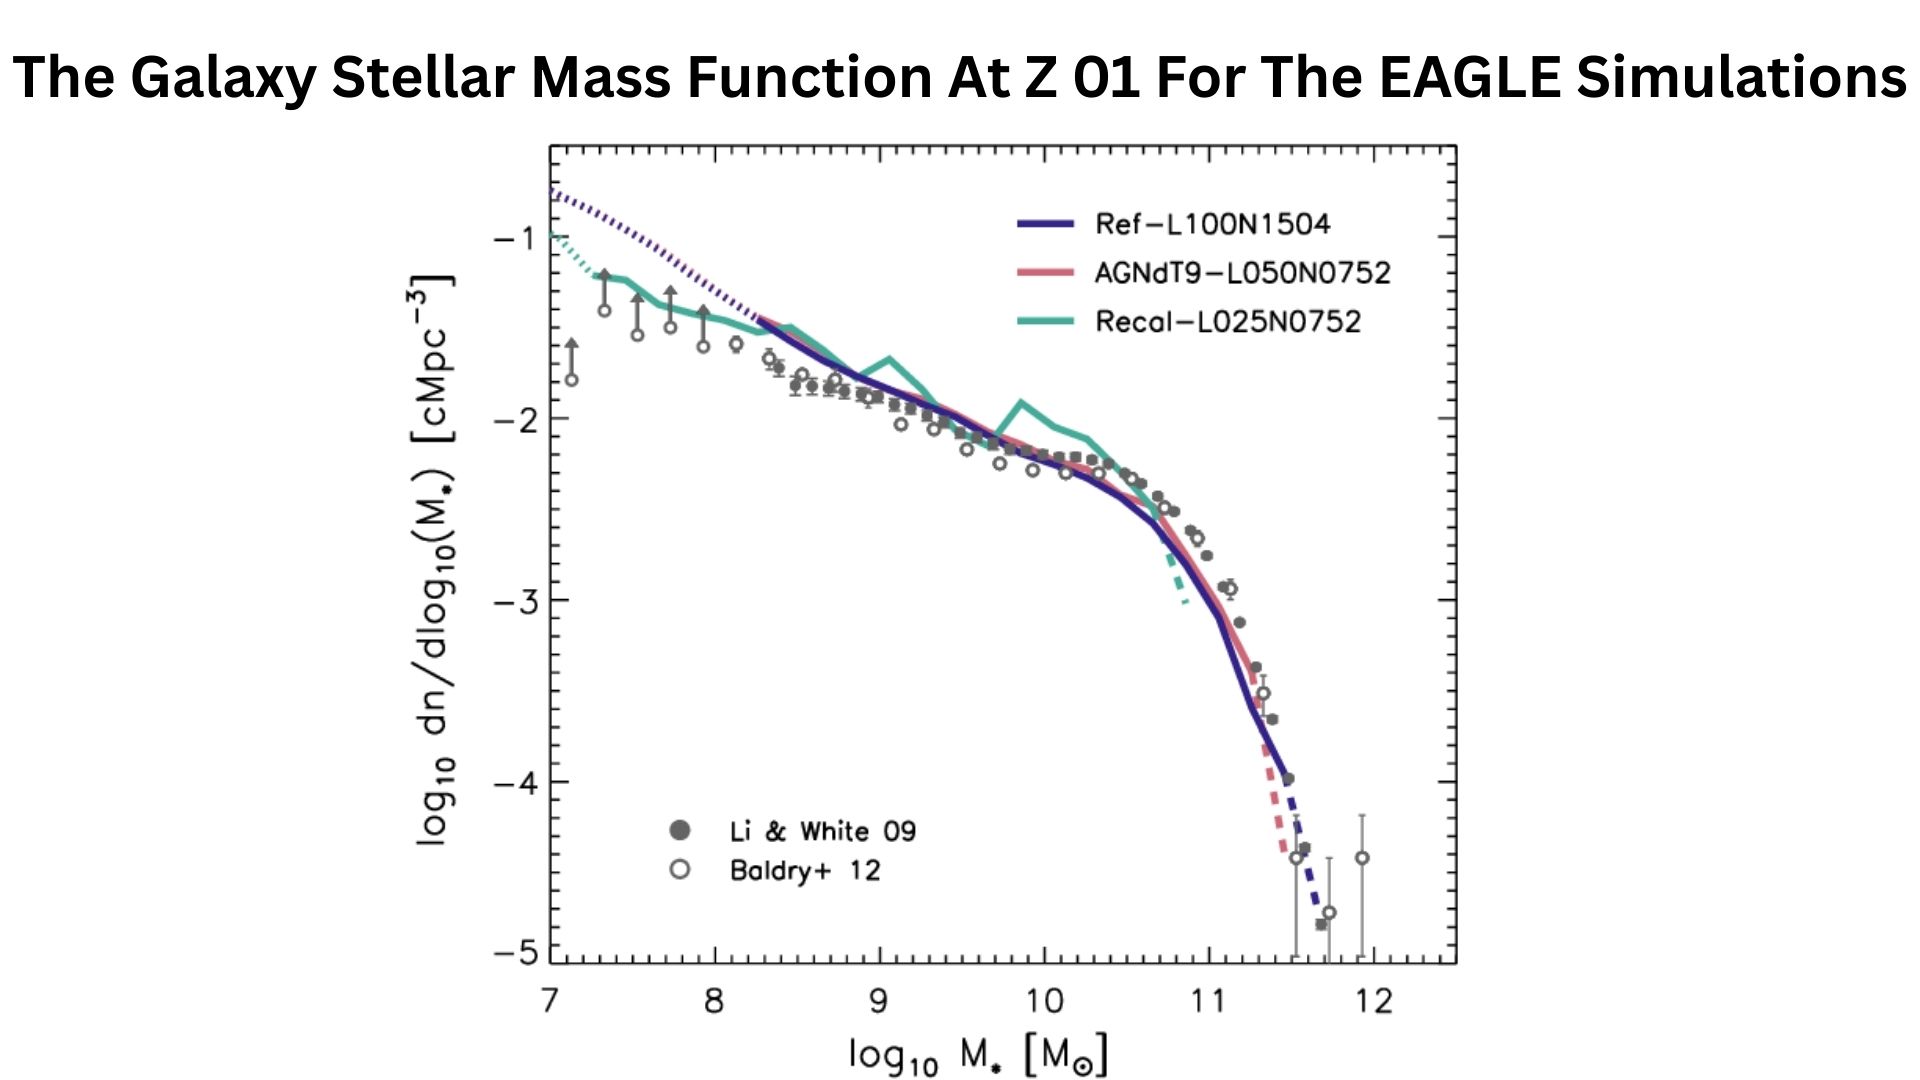
- The Schechter function has a characteristic mass M and slope parameters. The characteristic mass for the local universe, log(M/M), is about 10.7 to 10.8, requiring a double Schechter fit for the faint end and the bright end exponential cut off.
- The normalization phi is about 10^3 to 10^2 per cubic Mpc.
- The faint end slope determines the number of low-mass galaxies and depends on feedback mechanisms, while the high-mass exponential cut-off determines the prevalence of massive galaxies.
- Integration of the SMF results in the stellar mass density at a certain epoch in terms of stars.
- The evolution of the SMF with redshift is such that the massive end increases primarily through mergers and in-situ star formation at early epochs, while the faint end evolves through feedback and gas accretion rates.
- Surveys like COSMOS2015 and GAMA map this evolution up to 4 to 6.
| Parameter | Typical value (local) |
| logM | 10.7 to 10.8 for characteristic mass. |
| phi (normalization) | few × 10 power -3 Mpc power -3 dex power -1 depending on fit. |
| faint-end slope | -1.1 to -1.6 (double Schechter components) |
Morphology, Types, and Demographics
(Source: researchgate.net)
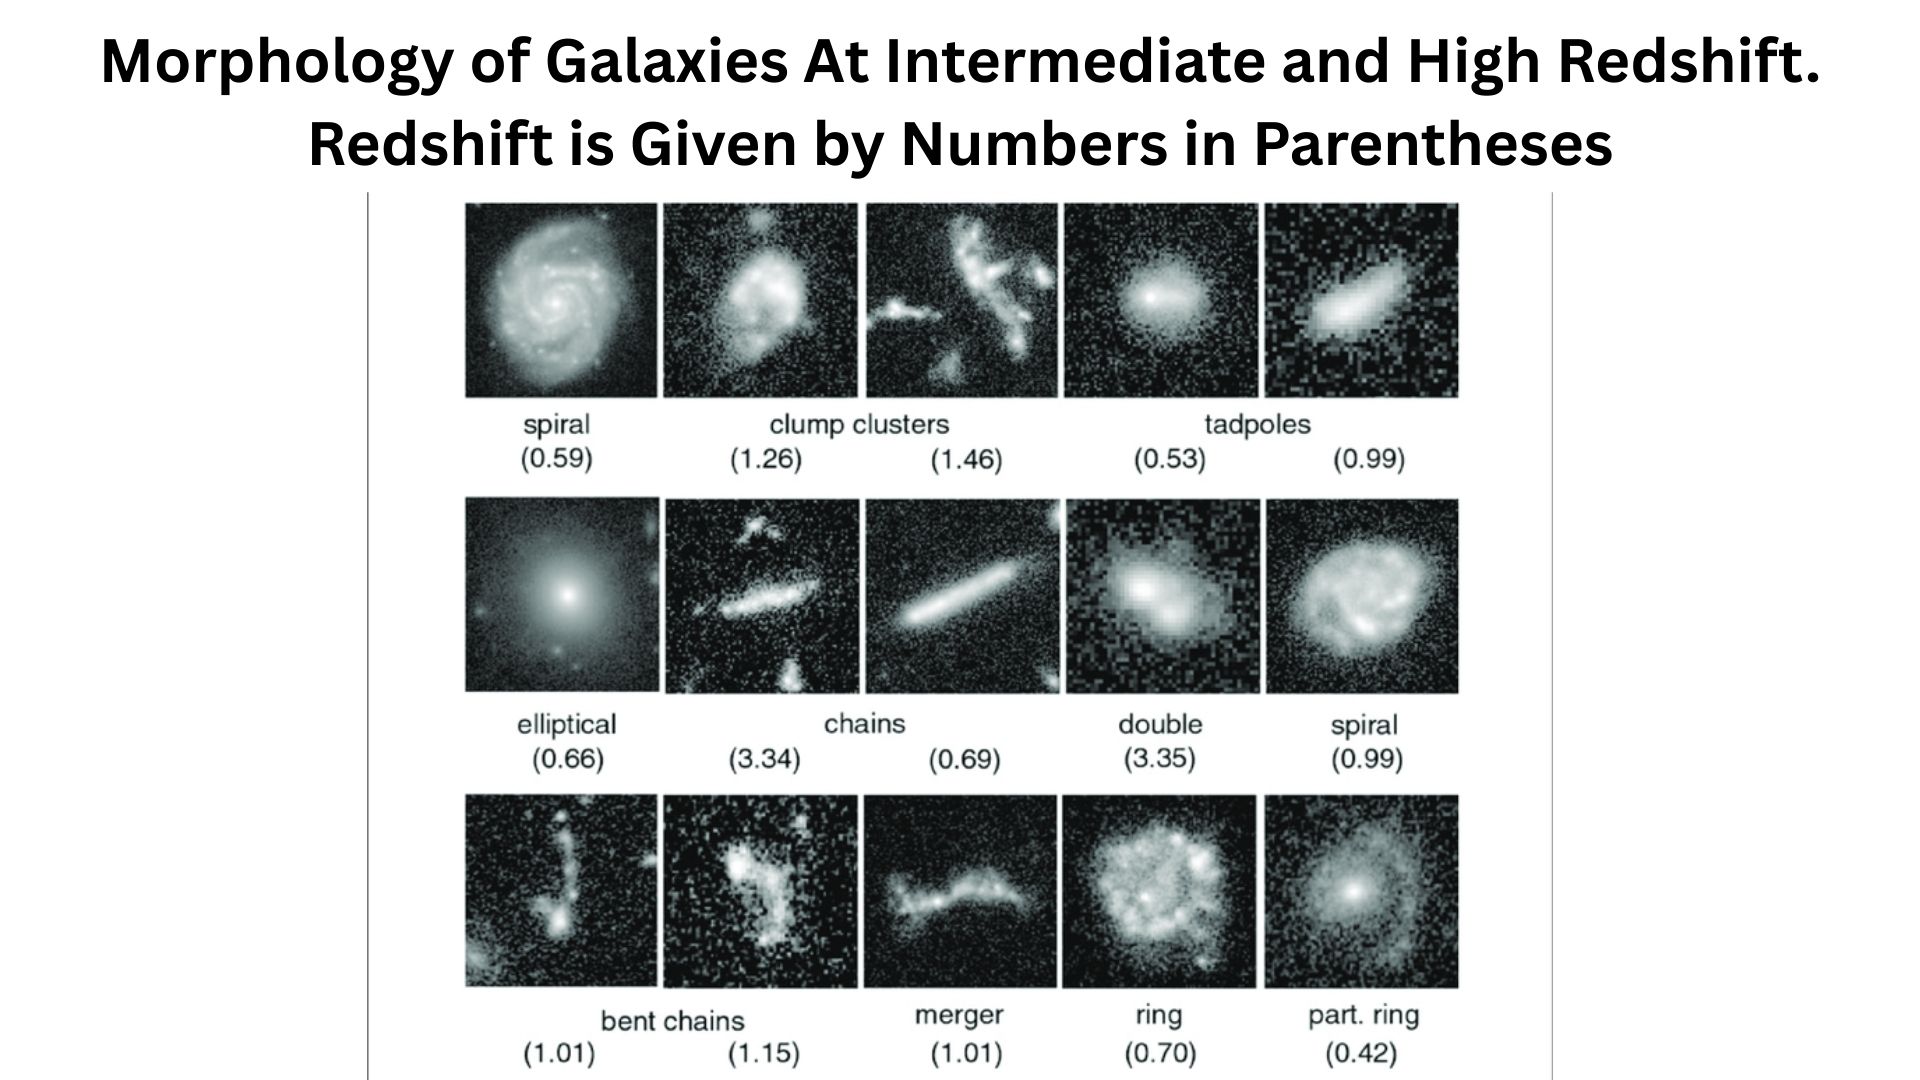
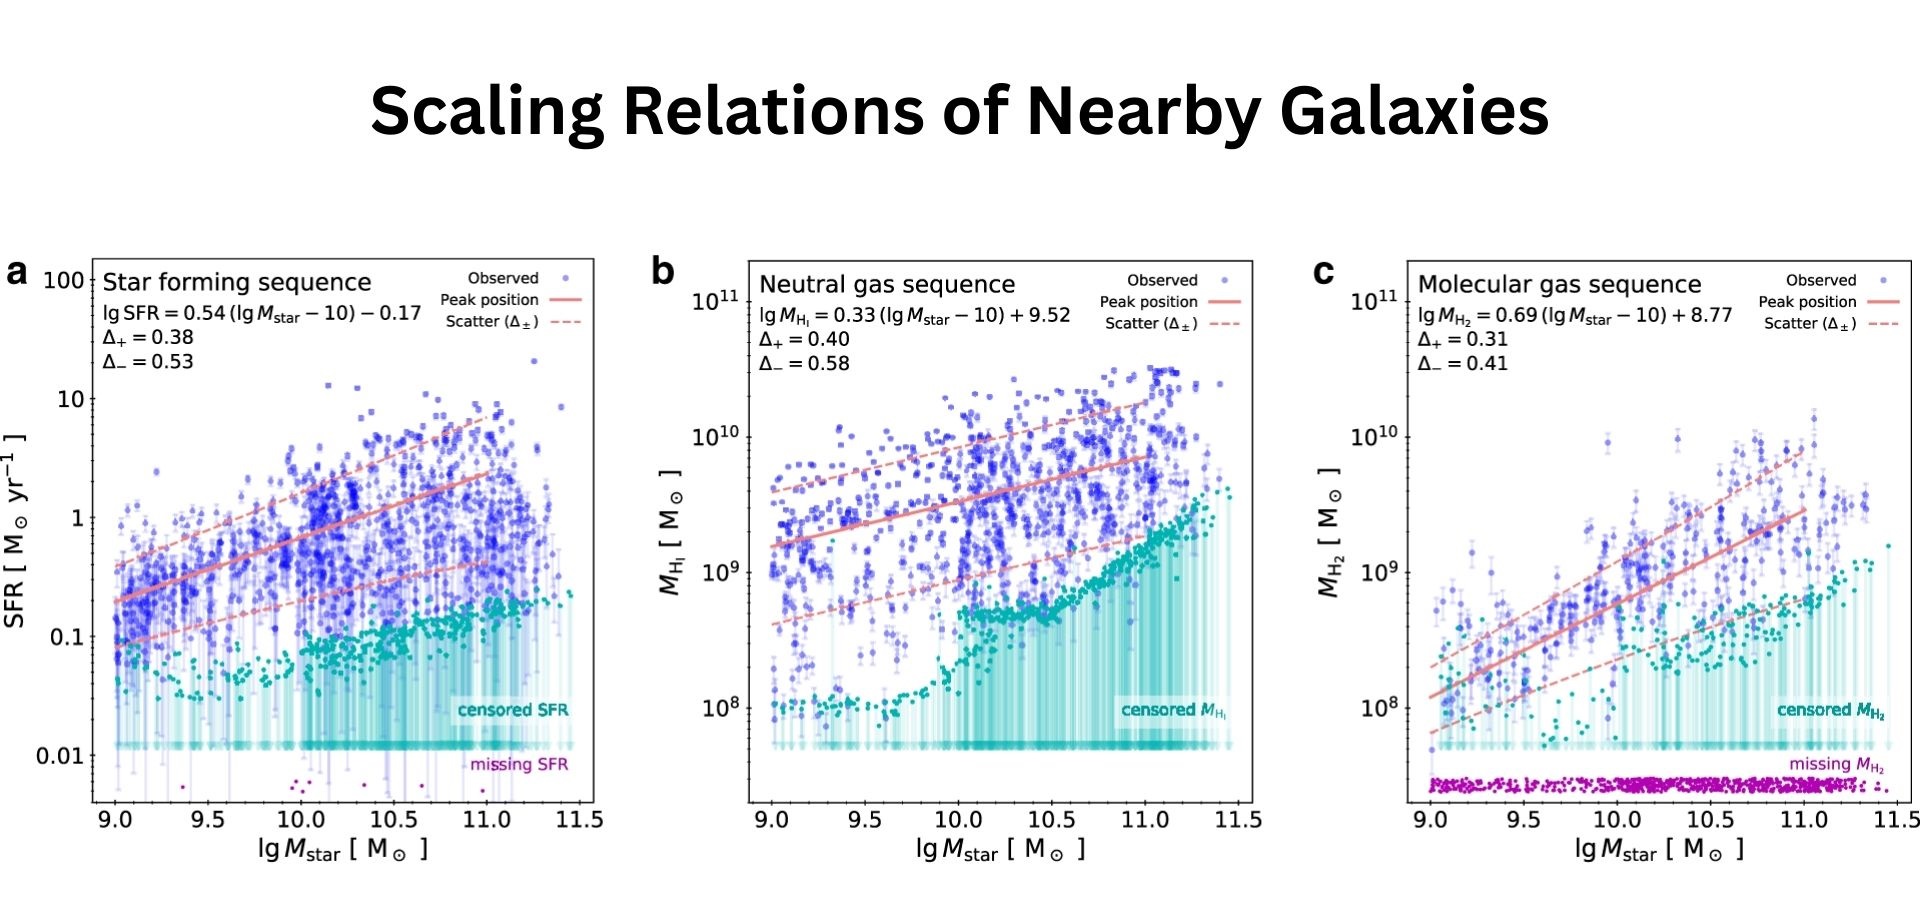
- Within the immediate universe, a high amount of stellar mass exists in galaxies with spheroids (ellipticals and S0 galaxies) and disk galaxies have a considerable contribution to the number counts.
- When morphology is quantitatively determined through surveys, half the stellar mass exists in galaxies with spheroids and the remaining is present in disk galaxies, when averaged by mass.
- The ratio of quiescent galaxies within each stellar mass increases as stellar mass increases.
- At cosmic noon, most massive galaxies are still forming stars, whereas at 0, a substantial fraction of high-mass galaxies is quiescent.
- Galaxy demographics strongly depend on the environment. Dense environments like clusters have higher quiescent fractions and a larger fraction of early-type morphologies compared to the field.
| Category | Local fraction (by stellar mass or number) |
| Spheroid-dominated mass fraction | 50 to 70% of local stellar mass in spheroids, depending on the sample. |
| Disk galaxies (stellar mass fraction) | 30 to 50% |
| Quiescent fraction (high mass) | High increases with stellar mass and decreasing redshift. |
Dark Matter Halos and Baryon Accounting
(Source: mdpi.com)
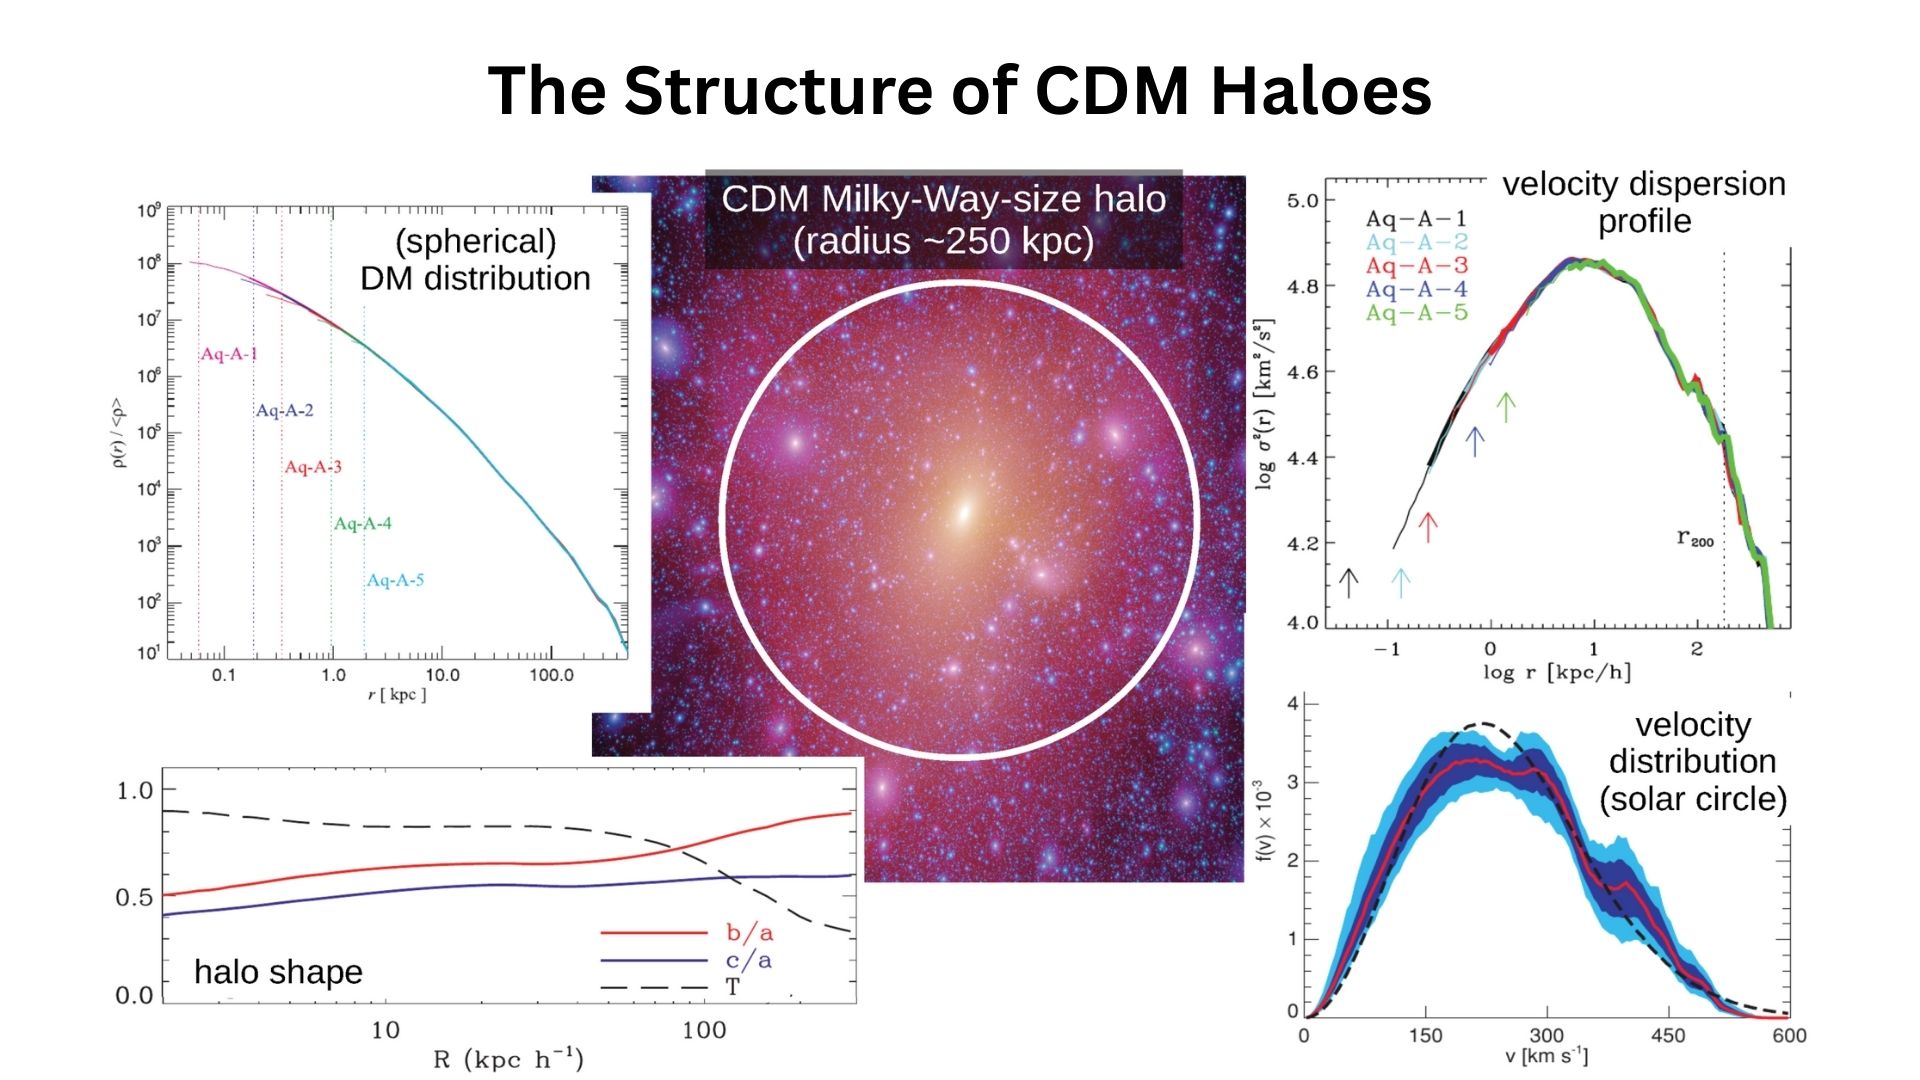
- Planck cosmology yields a baryon fraction in the universe of about Ω_b / Ω_m 15 to 0.16. That sets a maximum baryon budget for galaxies inside halos; in reality, only a fraction of those baryons turns into stars. This fraction strongly depends on halo mass and redshift.
- Peak galaxy formation efficiency is around halo masses 10 power 11 to 10 power 12 M, where roughly 10% or a few tens of percent of baryons get converted into stars.
- The efficiency decreases greatly for both small and large halos, partially due to stellar feedback at low masses and AGN feedback at high masses.
- The dark matter halo abundance has a much steeper slope at low masses than the galaxy stellar mass function.
- The discrepancy is a key statistical requirement that forces feedback mechanisms into galaxy formation models.
| Quantity | Typical value |
| Cosmic baryon fraction Ω_b/Ω_m | 0.155. |
| Peak star formation efficiency | several to 20% baryons to stars at Mhalo 10 power 11 to 10 power 12 M |
| Why not all baryons? | Feedback, heating, stripping, and inefficiencies in cooling |
Mergers and Assembly
(Source: researchgate.net)
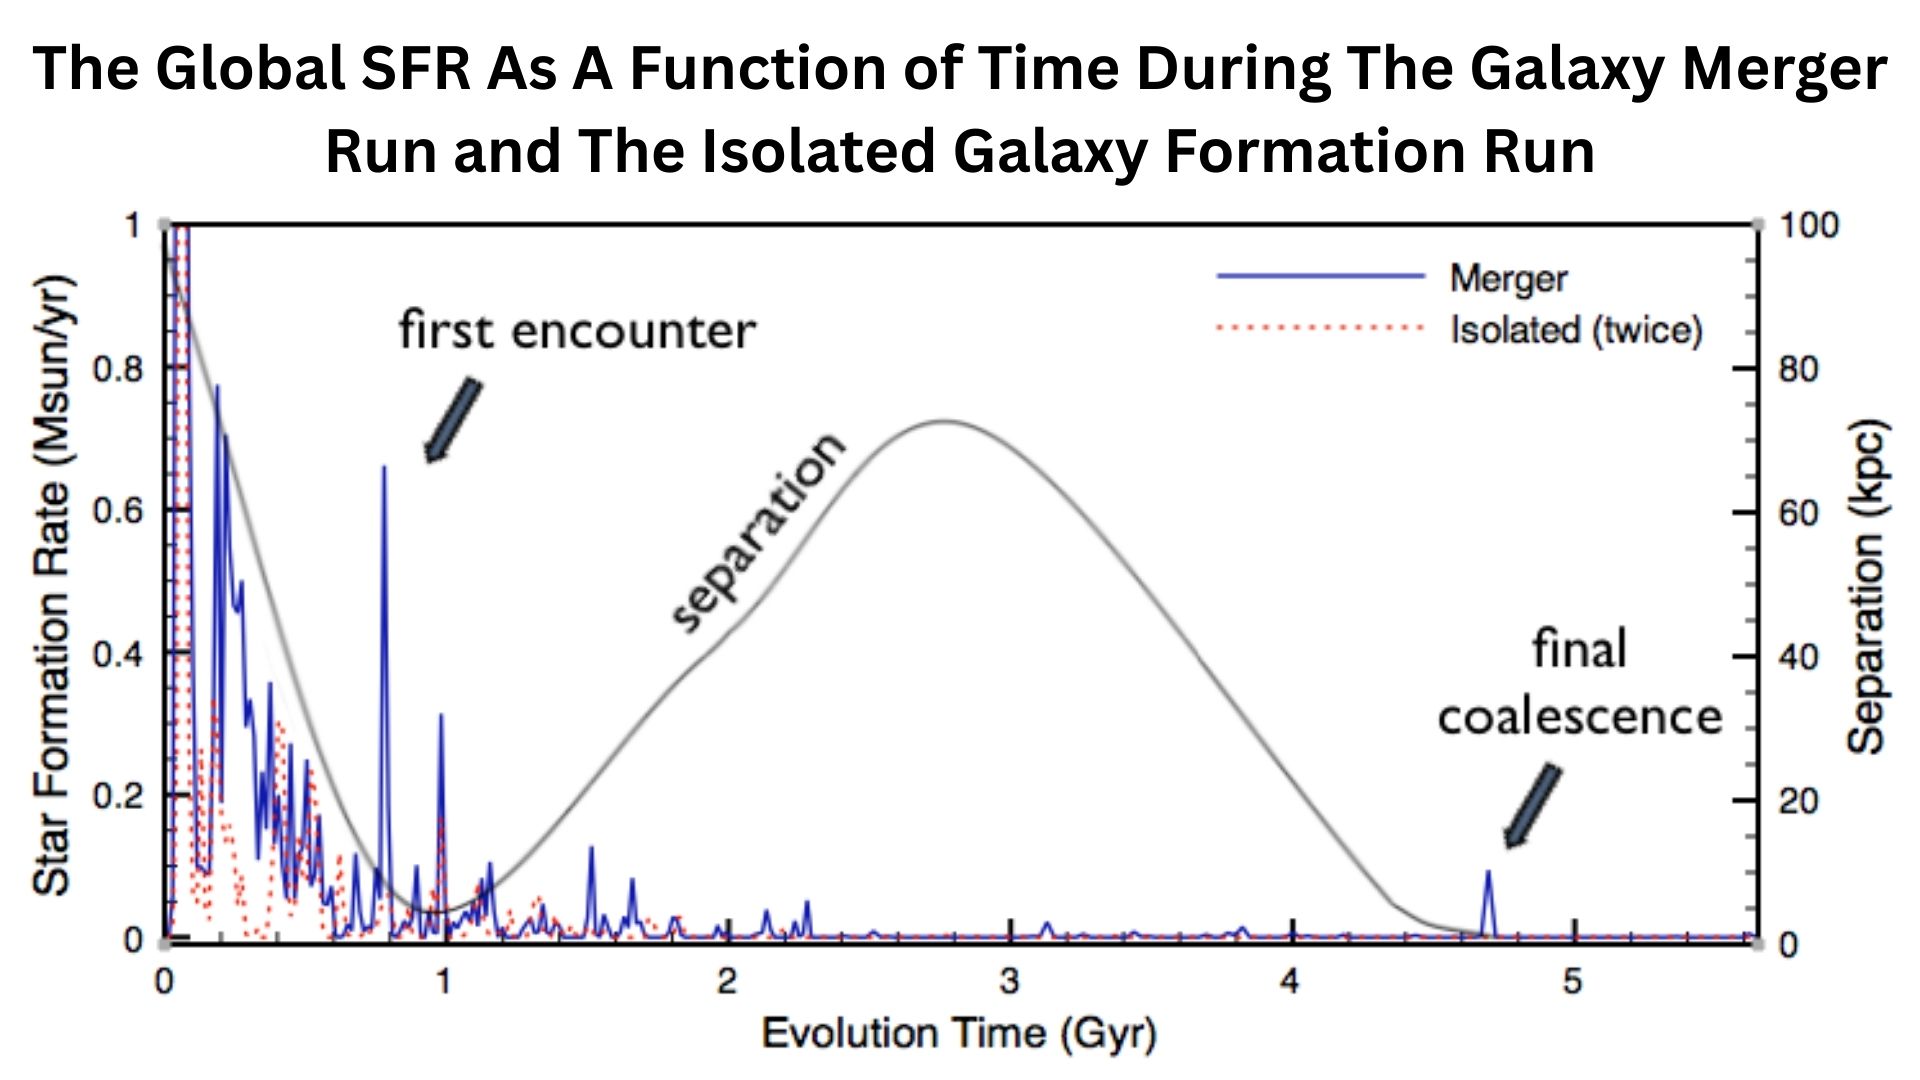
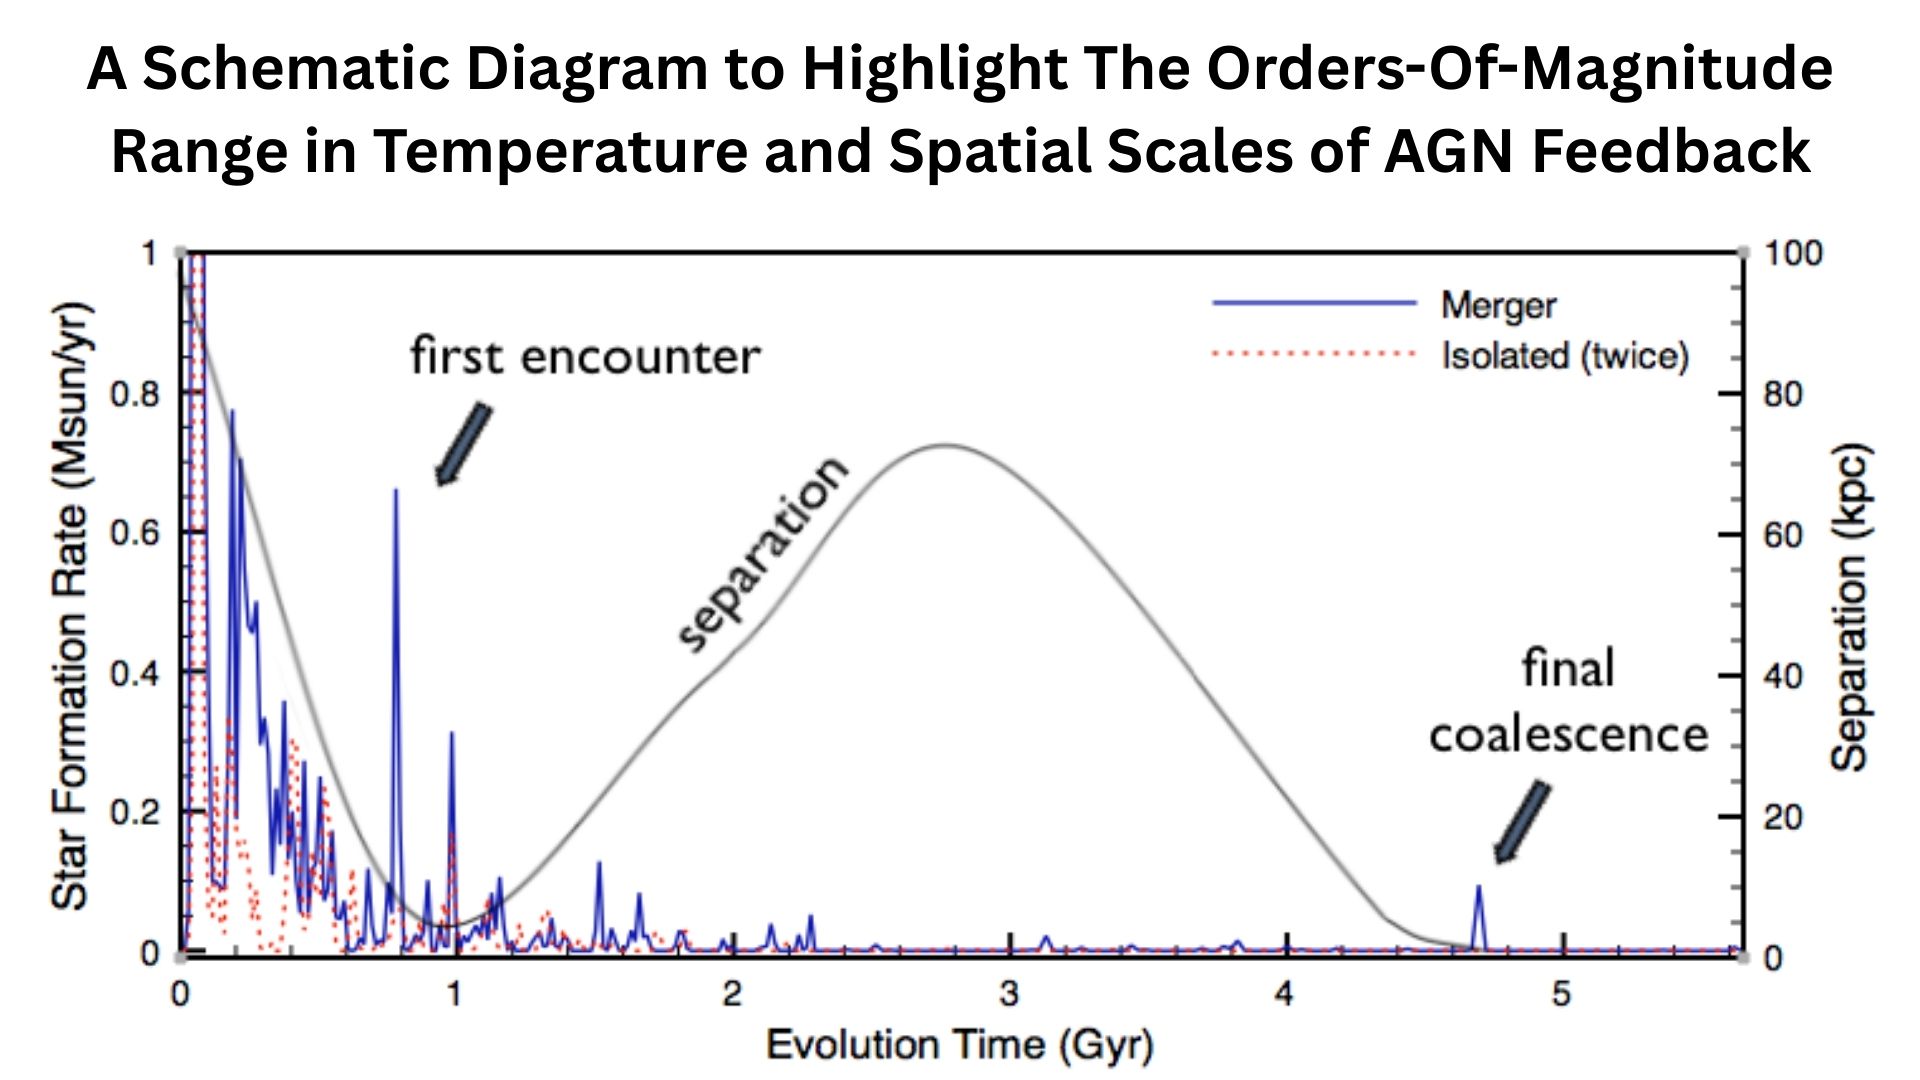
- Empirical and simulation-based studies find major merger rates (mass ratio roughly 1:4) that depend strongly on mass and redshift.
- Typical numbers: a few percent up to tens of percent per Gyr for massive galaxies around 1 to 3, falling to a few percent per Gyr at
- Integrated over cosmic time, a typical massive galaxy may experience order-unity numbers of major mergers.
- Minor mergers are more common than major ones and cumulatively can add a substantial fraction of a massive galaxy’s mass, especially at late times.
- Merger signatures vary in observability. Pair counts, disturbed morphologies, and kinematic signatures each have different observability windows and must be corrected with timescales to yield merger rates. That calibration is a statistical challenge in Galaxy Formation studies.
| Measure | Typical value |
| Major merger rate (per Gyr) for massive galaxies | 0.02 to 0.2 per Gyr, depending on redshift and mass. |
| Minor merger dominance | Minor mergers are 3 times more common than major mergers at some epochs. |
Role of Black Holes and Feedback
(Source: nature.com)
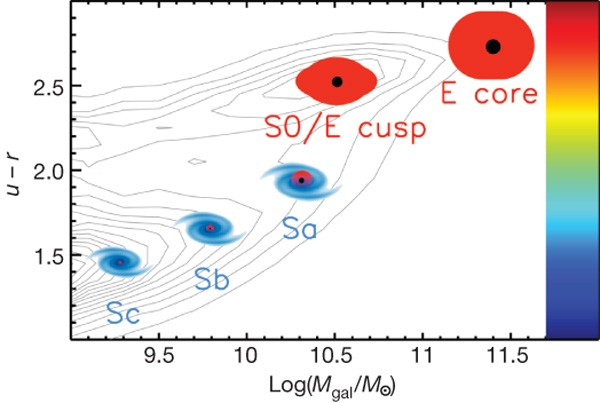
- Black holes seen to date scale with the mass of the bulge and velocity dispersion. The average mass of the black hole is about 0.1% – 0.5% of the mass of the bulge.
- The feedback from the AGN, where a tiny fraction of the rest-mass energy of the black hole is injected into the ISM over time, will be enough for explaining the observed cut-off of the SMF and massive quiescent galaxies.
- This constraint is statistical: models tuned without AGN feedback overproduce massive galaxies.
| Parameter | Typical |
| BH mass fraction of the bulge | 0.1 to 0.5% (observationally). |
| Why important | Explains suppressed SFR and exponential cutoff in SMF |
Observational Data Sets and Surveys
(Source: mdpi.com)
- Hubble Deep Fields (HUDF, XDF) show thousands of galaxies in a tiny area, probing to very faint magnitudes and giving the high-redshift counts that inform the 2 trillion extrapolations.
- SDSS provided imaging for hundreds of millions of objects and spectra for up to about a million galaxies, which anchors local mass functions, environmental measures, and morphological statistics.
- JWST’s infrared sensitivity is revealing numerous bright, massive systems at very high redshift, which has forced rethinking of the earliest growth models. That is an active statistical tension area in Galaxy Formation literature.
| Survey | Role | Scale |
| Hubble Ultra Deep Field (HUDF) | Deep counts to faint magnitudes | 10,000 galaxies in a tiny patch. |
| Sloan Digital Sky Survey (SDSS) | Local universe, spectra | 0.9 to 1M galaxy spectra in older releases; imaging hundreds of millions. |
| JWST | Deep IR, early galaxies | Detects high luminous galaxies changing early statistics. |
Simulations and Models
(Source: simonsfoundation.org)
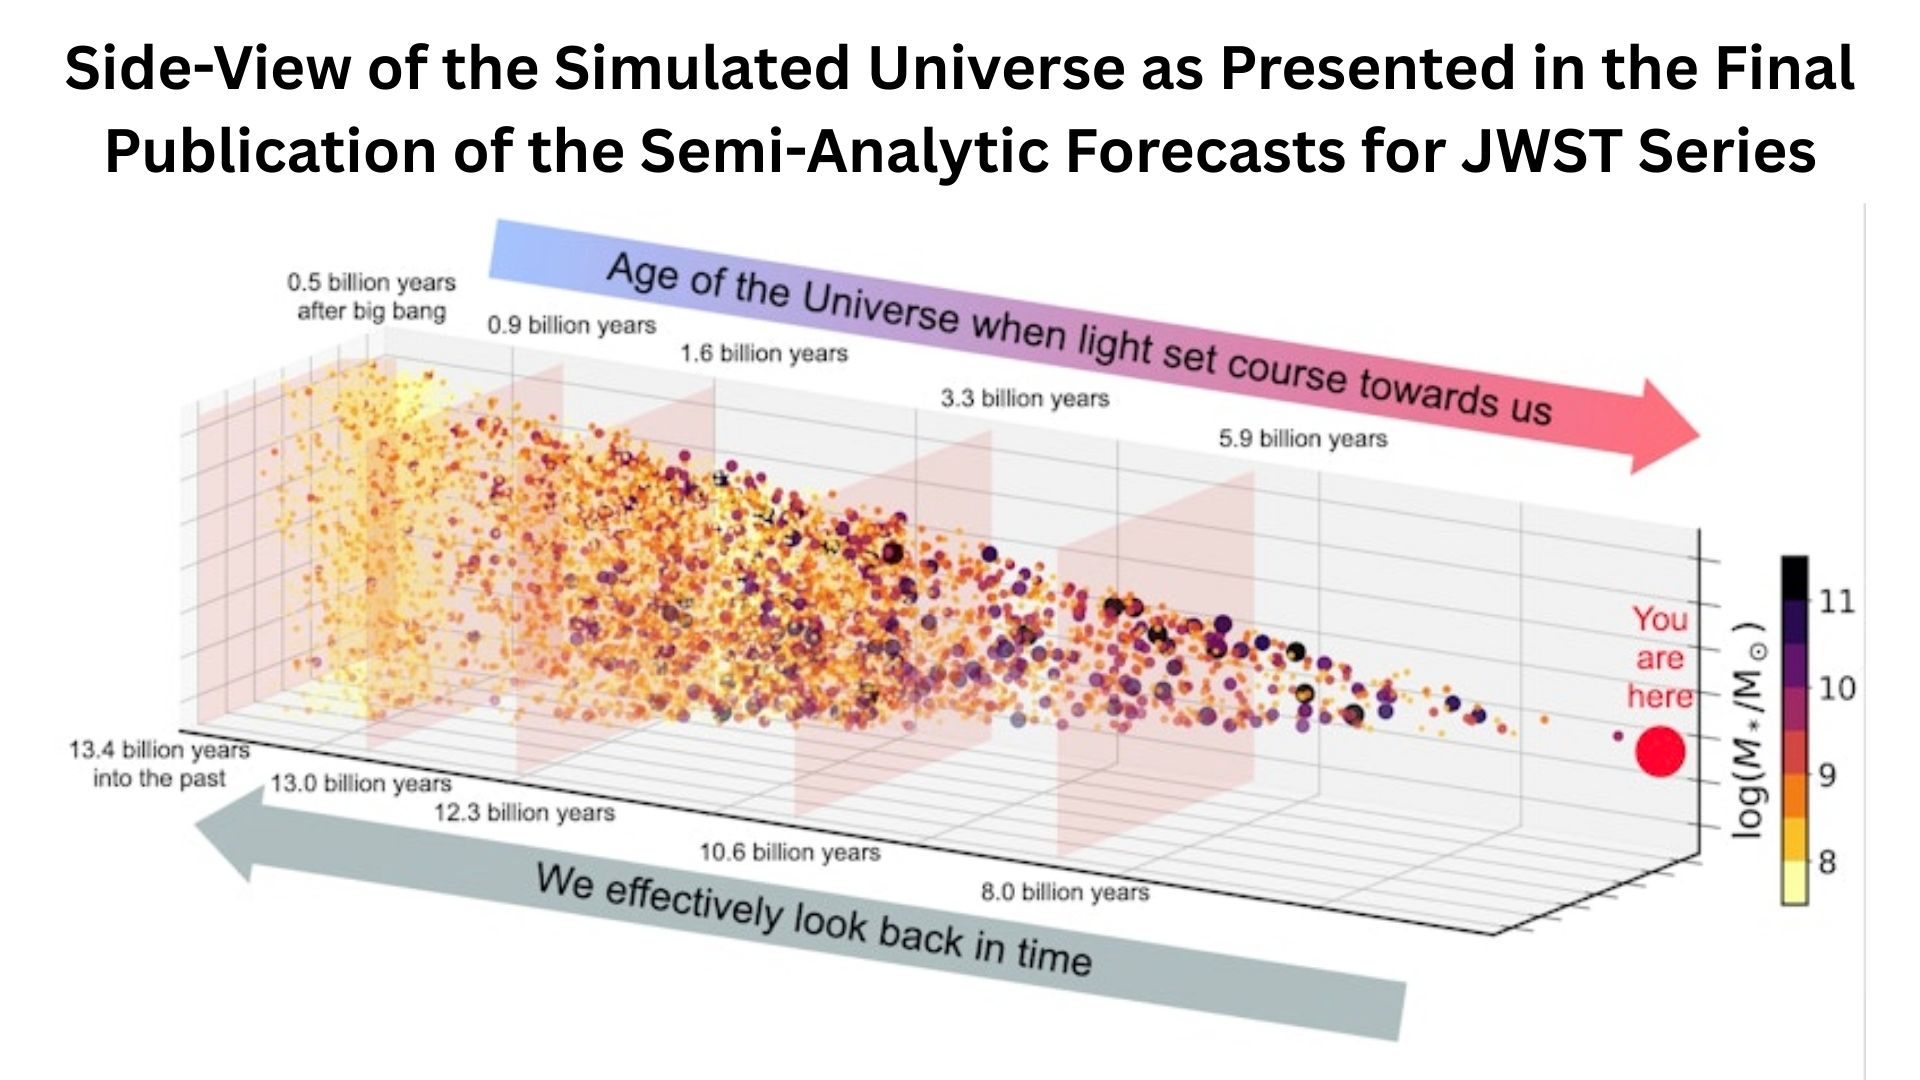
- Large cosmological hydrodynamical simulations like IllustrisTNG and EAGLE simulate volumes of tens to hundreds of Mpc with billions of resolution elements and include subgrid models for star formation, feedback, and black hole growth.
- They reproduce many statistical observables like the SMF and SFRD when calibrated properly.
- The TNG50, TNG100, and TNG300 simulations sacrifice resolution for box size to allow addressing different scientific questions in statistics.
- The TNG300 simulates large volume to allow rare object simulation, whereas the TNG50 simulates high resolution to study galaxy formation.
- Simulations provide priors and forward models used in abundance matching, halo occupation distribution modeling, and other statistical techniques that connect observed galaxy counts to dark matter halos.
| Simulation | Box size (approx) | Note |
| TNG50 | 50 Mpc | High resolution for galaxy structure. |
| TNG100 | 110 Mpc | Balanced resolution and volume. |
| TNG300 | 300 Mpc | Large volume for rare objects. |
| EAGLE (Ref-L100N1504) | 100 Mpc | Public catalogs are used for statistical comparisons. |
Open Tensions and Statistical Puzzles Right Now
(Source: nature.com)
- Several JWST studies found apparently massive galaxies at 9 whose presence and inferred masses are higher than many models predicted.
- This is a current statistical paradox that could be related to selection effects, modelling issues, or true efficiency at early times.
- Cold dark matter theory predicts many more subhalos than are seen as luminous satellites, but better corrections and deep imagery have lessened the discrepancy.
- There remain statistical questions about baryonic processes and detectability.
- Comparisons of the time-integral of SFRD and observed stellar mass density show discrepancies at some redshifts, leading to checks on IMF variations, dust corrections, and photometric uncertainties.
Statistical Tools and Methods Used in Galaxy Formation Studies
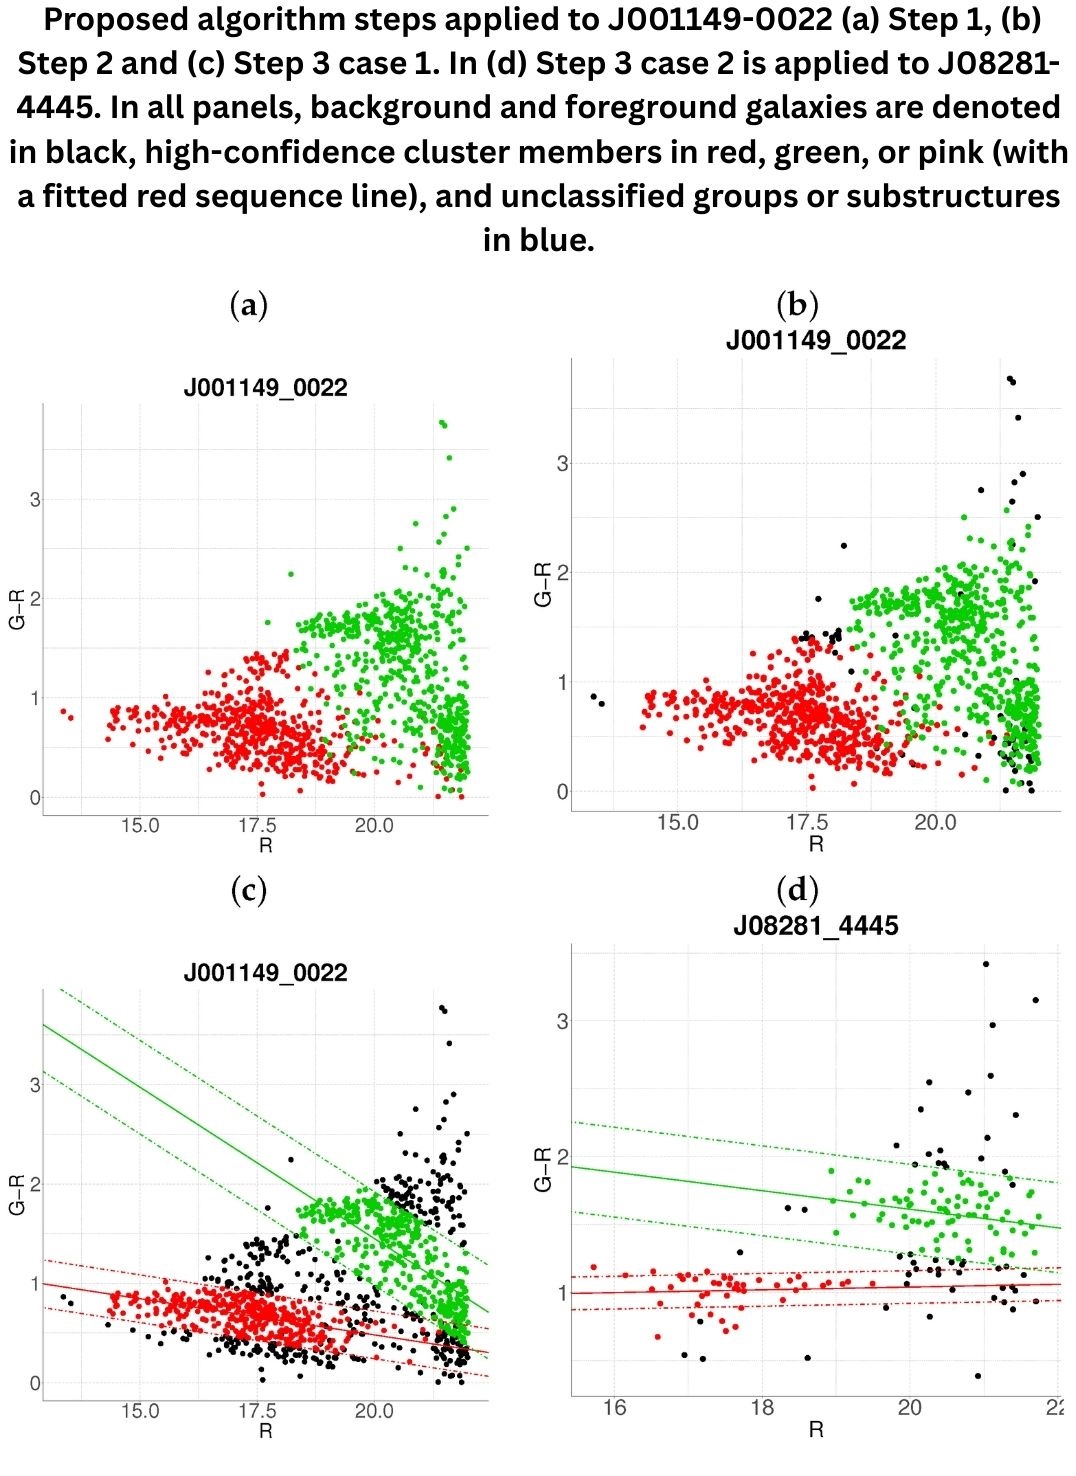
(Source: mdpi.com)
- Schechter and double Schechter function forms have been commonly used to fit stellar mass and luminosity functions by means of 1/Vmax, maximum likelihood, and SWML techniques due to corrections for survey boundaries.
- This allows the distribution of masses to be characterized by a number of parameters.
- The abundance matching method links observed SMF to halo mass functions in order to understand galaxy occupation within the halos. The HODs and conditional luminosity functions characterize the population of galaxies in halos.
- Forward modeling of whole surveys using synthetic catalogs and Bayesian methods has become widespread recently.
Wrapping Up
So overall, galaxy formation is really the story of how the universe built itself. What we understand is that, from clouds of gas and invisible dark matter, gravity sculpted the first stars, merged them into galaxies, and kept changing them through collisions and growth.
Every galaxy carries clues about the universe’s history, how fast stars were born, how black holes grew, and how cosmic structures evolved. With new telescopes like the James Webb Space Telescope, we are going deeper into the past, getting closer to seeing the first galaxies form.
In short, galaxy formation is an ongoing process, one that began billions of years ago and continues even now. And by studying it, we’re not just learning about galaxies, we’re learning about where we came from, and where the universe is heading. It is one of the most interesting articles I have ever written. I had fun, I hope you guys did too. If you have any questions, kindly let me know in the comments section. Thanks.
FAQ
Galaxies began forming between 10 billion and 13.6 billion years ago, relatively shortly after the Big Bang (13.8 billion years ago). Our own galaxy, the Milky Way, started taking shape around 13.6 billion years ago, though it took billions of years to evolve into the spiral shape we see today.
Galaxies formed out of immense clouds of gas and dust shortly after the Big Bang. Driven by gravity, these clouds collapsed and spun, igniting the first stars and pulling matter together to create the diverse spiral, elliptical, and irregular galaxies we observe today.
American astronomer Edwin Hubble is credited with proving the existence of the first galaxy beyond the Milky Way. In 1923, using the 100-inch Hooker Telescope at the Mount Wilson Observatory, he identified Cepheid variable stars in the Andromeda “nebula”. This allowed him to calculate its distance, proving it was a massive, independent galaxy over 2 million light-years away.

Sources