
Introduction
Airlines Statistics: The airline industry is flying high in 2024, reaching new records in passenger numbers and getting close to $1 trillion in total revenue. Following the significant impact of the COVID-19 pandemic, airlines are now entering a robust recovery phase characterized by rapid growth, increased demand, and a stronger emphasis on eco-friendly travel.
Whether you’re a frequent flyer, business owner, travel expert, or policymaker, knowing the latest “Airline Statistics” helps you understand how global travel and trade are changing. In this overview, you’ll find key facts about passenger totals, revenue increases, regional highlights, rising costs like jet fuel, and new trends in technology and green aviation. Get ready—we’re diving into the numbers that are shaping the future of air travel.
Editor’s Choice
- Starting from Monday, December 30, 2024,* through the end of this week, a total of 17,847,661 one-way flights have been listed in the flight schedule. That works out to an average of about 101,986 commercial flights each day during this time.
- Around 728 airlines are operating globally as of June 2025.
- There are 3,941 airports in operation currently.
- One hundred forty-seven radar approach control centers across the United States help manage aircraft as they enter or exit busy airspace.
- Each year, U.S. airlines handle nearly 44.5 billion pounds of freight, highlighting aviation’s key role in the shipping industry.
- In the U.S., there are over 167,000 general aviation aircraft, about 34,200 experimental small planes, and roughly 10,000 helicopters in operation.
- Flight data shows that general aviation in the U.S. logs around 25.5 million flight hours every year.
- Globally, it’s estimated that roughly 20% of the world’s population has taken a flight at least once, meaning most people have never flown.
- The Asia-Pacific region is projected to be the fastest-growing airline market between 2023 and 2028, driven by rising demand for air travel in that part of the world.
Airlines Industry Statistics
-
Global Airline Industry
| Global Airline Industry | 2019 | 2020 | 2021 | 2022 | 2023 | 2024E | 2025F |
|
Segment passenger, million |
4,560 | 1,779 | 2,304 | 3,452 | 4,426 | 4,779 | 4,98 |
| O-D passenger, million | 3,974 | 1,570 | 2,017 | 2,962 | 3,792 | 4,100 |
4,291 |
|
Flights, million |
37.5 | 19.7 | 24.2 | 29.5 | 35.5 | 37.4 | 38.3 |
| Passenger growth, RPK, %YoY | 4.1% | -65.8% | 21.8% | 64.9% | 36.8% | 10.6% |
5.8% |
|
Cargo growth, CTK, % YoY |
-3.2% | -9.9% | 18.8% | -8.1% | -1.7% | 11.3% | 0.7% |
| Capacity growth, ATK, % YoY | 2.9% | -44.5% | 16.4% | 22.1% | 22.4% | 8.3% |
4.2% |
|
Total load factor, % ATK |
70.1% | 59.8% | 61.9% | 67.2% | 68.7% | 70.2% | 70.5% |
| Passenger load faster, % ASK | 82.6% | 65.2% | 66.9% | 78.7% | 82.2% | 83.5% |
84.0% |
|
World economic growth, real, % YoY |
2.9% | -2.7% | 6.6% | 3.6% | 3.5% | 3.3% | 2.5% |
| CPI, world, % YoY | 3.5% | 3.3% | 4.7% | 8.6% | 6.6% | 5.7% |
4.3% |
|
Revenue, USD billion %change YoY |
838
3.2% |
384
-54.1% |
513
33.4% |
738
44.1% |
909
23.1% |
966
6.2% |
979 1.3% |
|
Passenger, USD billion |
607 | 189 | 242 | 437 | 648 | 682 | 693 |
| Cargo, USD billion | 101 | 140 | 210 | 206 | 139 | 149 |
142 |
|
Ancillary and other, USD billion |
130 | 55 | 61 | 95 | 122 | 135 | 144 |
| Passenger ticket yield, % YoY | -3.7% | -9.1% | 4.9% | 9.7% | 8.4% | -4.8% |
-4.0% |
|
Passenger total yield, % YoY |
-1.4% | -1.4% | 2.0% | 7.4% | 5.9% | -4.1% | -3.2% |
| Cargo yield, % YoY | -8.2% | 54.7% | 25.9% | 7.0% | -31.7% | -3.7% |
-5.2% |
|
Revenue per ATK, USD cents % change YoY |
54
0.3% |
45
-17.4% |
51
14.6% |
61
18.0% |
61
0.5% |
60
-2.0% |
58
-2.7% |
| Expenses, USD billion | -795 | -495 | -556 | -727 | -846 | -904 |
-913 |
|
%change YoY |
3.8% | -37.7% | 12.3% | 30.8% | 16.4% | 6.8% | 1.0% |
| Fuel, USD billion | -190 | -80 | -106 | -215 | -269 | -261 |
-236 |
|
% of expenses |
23.9% | 16.1% | 19.0% | 29.6% | 31.8% | 28.8% | 25.8% |
| Crude oil price, Brent, USD/barrel | 65 | 42 | 71 | 101 | 83 | 81 |
69 |
|
Jet fuel price, USD/barrel |
80 | 47 | 7 | 139 | 112 | 99 | 86 |
| Fuel consumption, billion gallons | 96 | 52 | 62 | 76 | 92 | 99 |
103 |
|
Non-fuel, SD billion |
-605 | -415 | -450 | -512 | -577 | -643 | -677 |
| Cost per ATK excludes USD cents
% change YoY |
39
1.6% |
49
23.7% |
45
-6.8% |
42
-6.9% |
39
-8.0% |
40
2.9% |
40 1.0% |
|
EBITDAR, USD billion % EBIDAR margin |
148.1
17.7% |
-27.8
-7.2% |
37.3
7.3% |
105.8
14.3% |
150.5
16.6% |
155.3
16.1% |
160.0
16.3% |
| EBIT, USD, billion
%EBIT margin %EBIT margin |
43.1
5.1% |
-110
-28.8% |
-43.5
-8.5% |
11.3
1.5% |
62.9
6.9% |
61.9
6.4% |
66.0 6.7% |
|
Net Profit, USD billion % net profit margin Per departing passenger, $ |
26.4
3.1%
5.8 |
-137.7
-35.8%
-77.4 |
-40.4
-7.9%
-17.5 |
-3.5
-0.5%
-1.0 |
37.3
4.1%
8.4 |
32.4
3.4%
6.8 |
36.0 3.7% 7.2 |
|
Return on invested capital, % |
5.8% | -19.3% | -8.0 | 2.0% | 6.9% | 6.6% |
6.7% |
-
Financial Results
| Global Airline Industry | EBIT, % of revenue 2021 |
EBIT, % of revenue 2022 |
EBIT, % of revenue 2023 |
EBIT, % of revenue 2024 |
EBIT, % of revenue 2025 |
Net profit, USD billion 2021 |
Net profit, USD billion 2022 |
Net profit, USD billion 2023 |
Net profit, USD billion 2024 |
Net profit, USD billion 2025 |
|
Global |
-8.5% | 1.5% | 6.9% | 6.4% | 6.7% | -40.4 | -3.5 | 37.3 | 32.4 | 36.0 |
| Regions |
|
|||||||||
|
Africa |
-6.8% | -3.1% | 3.5% | 3.9% | 3.9% | -1.1 | -0.8 | 0.1 | 0.2 | 0.2 |
| Asia Pacific | -9.7% | -7.2% | 4.6% | 4.1% | 4.4% | -13.4 | -13.8 | 4.4 | 4.0 |
4.9 |
|
Europe |
-10.4% | 3.9% | 6.6% | 5.6% | 6.5% | -12.5 | 5.2 | 11.0 | 9.6 | 11.3 |
| Latin America | -11.0% | -1.9% | 12.3% | 13.6% | 12.2% | -7.0 | -3.5 | 1.1 | 1.3 |
1.1 |
|
Middle East |
-20.7% | 7.2% | 13.0% | 13.3% | 13.8% | -4.4 | -2.4 | -6.1 | 6.1 | 6.2 |
| North America | -4,7% | 4.5% | 7.0% | 6.5% | 6.9% | -1.9 | 7.2 | 14.6 | 11.5 |
12.7 |
-
Traffic Results
| Passenger Traffic (RPK) | Passenger Traffic (RPK) | Passenger Traffic (RPK) | Passenger Traffic (RPK) | Passenger Traffic (RPK) | Passenger Traffic (RPK) | Passenger Capacity(ASK) | Passenger Capacity(ASK) | Passenger Capacity(ASK) | Passenger Capacity(ASK) | Passenger Capacity(ASK) |
|
Global airline industry |
% change versus the previous year | % change versus the previous year | % change versus the previous year | % change versus the previous year | % change versus the previous year | % change versus the previous year | % change versus the previous year | % change versus the previous year | % change versus the previous year | % change versus the previous year |
| 2021 | 2022 | 2023 | 2024 | 2025 | 2021 | 2022 | 2023 | 2024 |
2025 |
|
|
Global |
21.8% | 64.9% | 36.8% | 10.6% | 5.8% | 18.7% | 40.1% | 31.1% | 8.8% | 5.2% |
| Africa | 17.0% | 84.3% | 36.5% | 13.3% | 8.0% | 18.5% | 51.4% | 35.6% | 9.9% |
7.3% |
|
Asia Pacific |
-12.8% | 32.3% | 95.9% | 17.3% | 9.0% | -6.1% | 15.5% | 75.0% | 12.8% | 6.9% |
| Europe | 27.5% | 103.9% | 20.3% | 8.8% | 6.0% | 29.8% | 69.6% | 16.0% | 8.1% |
5.9% |
|
Latin America |
40.5% | 62.9% | 16.8% | 7.8% | 5.8% | 37.3% | 54.4% | 14.4% | 7.1% | 7.8% |
|
Middle East |
8.5% | 144.4% | 32.4% | 9.5% | 6.4% | 21.2% | 67.2% | 24.7% | 8.4% | 4.6% |
| North America | 74.6% | 45.7% | 15.1% | 4.7% | 0.4% | 41.1% | 28.7% | 14.0% | 4.7% |
1.3% |
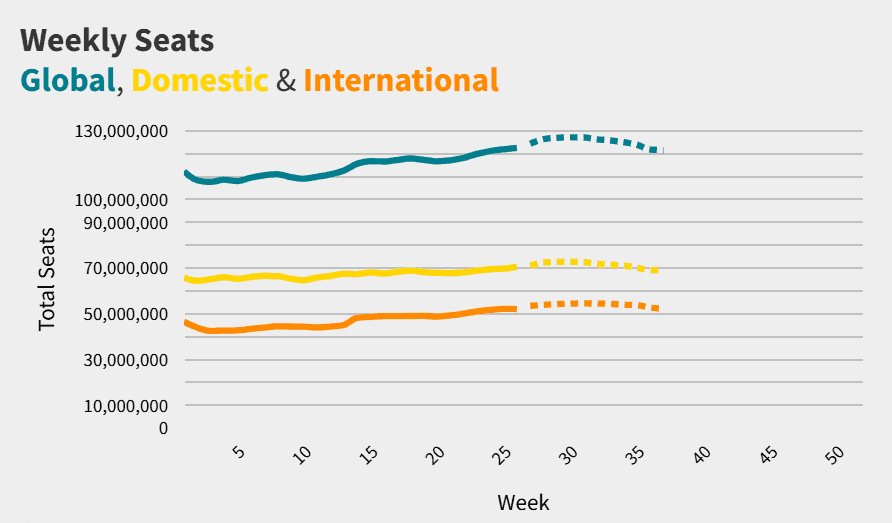
Weekly Airlines Capacity Data
 (Source: oag.com)
| Week | International Seats | International Change this month vs Same Month Last Year | Domestic Seats | Domestic Change this month vs Same month last year | Total Seats | Total Change this month vs same month last year |
|
1 |
46,599,053 | 7.90% | 65,713,044 | 1.90% | 112,312,097 | 4.30% |
| 2 | 43,945,534 | 9.50% | 64,413,457 | 2.40% | 108,358,991 |
5.10% |
|
3 |
42,525,586 | 8.80% | 65,118,837 | 3.30% | 107,644,423 | 5.40% |
| 4 | 42,630,967 | 9.40% | 65,984,882 | 3.60% | 108,615,849 |
5.80% |
|
5 |
42,630,967 | 9.40% | 65,984,882 | 3.60% | 108,615,849 | 5.80% |
| 6 | 43,420,144 | 7.80% | 66,066,701 | 2.70% | 109,486,845 |
4.70% |
|
7 |
43,924,732 | 6.70% | 66,593,297 | 1.70% | 110,518,029 | 3.60% |
| 8 | 44,534,846 | 8.00% | 66,495,768 | 0.70% | 111,030,614 |
3.50% |
|
9 |
44,439,445 | 7.60% | 65,339,178 | 0.00% | 109,778,623 | 2.90% |
| 10 | 44,373,420 | 6.80% | 64,699,770 | 0.40% | 109,073,190 |
2.90% |
|
11 |
44,037,626 | 6.60% | 65,871,931 | 2.10% | 109,909,557 | 3.80% |
| 12 | 44,432,487 | 6.70% | 66,516,334 | 2.40% | 110,948,821 |
4.00% |
|
13 |
45,058,303 | 5.50% | 67,503,748 | 3.50% | 112,562,051 | 4.30% |
| 14 | 48,223,127 | 7.10% | 67,369,275 | 1.30% | 115,592,402 |
3.60% |
|
15 |
48,649,023 | 7.10% | 68,061,173 | 2.20% | 116,710,196 | 4.20% |
| 16 | 48,972,952 | 7.60% | 67,608,590 | 1.00% | 116,581,542 |
3.70% |
|
17 |
48,942,792 | 7.50% | 68,287,584 | 1.50% | 117,230,376 | 3.90% |
| 18 | 49,043,621 | 5.40% | 68,846,391 | 1.60% | 117,890,012 |
3.10% |
|
19 |
49,078,283 | 5.20% | 68,226,601 | 2.60% | 117,304,884 | 3.60% |
| 20 | 48,790,749 | 4.80% | 67,849,883 | 2.00% | 116,640,632 |
3.10% |
|
21 |
49,260,287 | 5.20% | 67,765,051 | 1.70% | 117,024,338 | 3.10% |
| 22 | 50,053,734 | 5.20% | 68,077,997 | 1.50% | 118,131,731 |
3,00% |
|
23 |
51,048,465 | 4.90% | 68,869,884 | 1.90% | 119,918,349 | 3.10% |
| 24 | 51,685,802 | 4.90% | 69,478,473 | 1.00% | 121,164,275 |
2.60% |
|
25 |
52,151,686 | 4.60% | 69,752,192 | 0.50% | 121,903,878 |
2.20% |
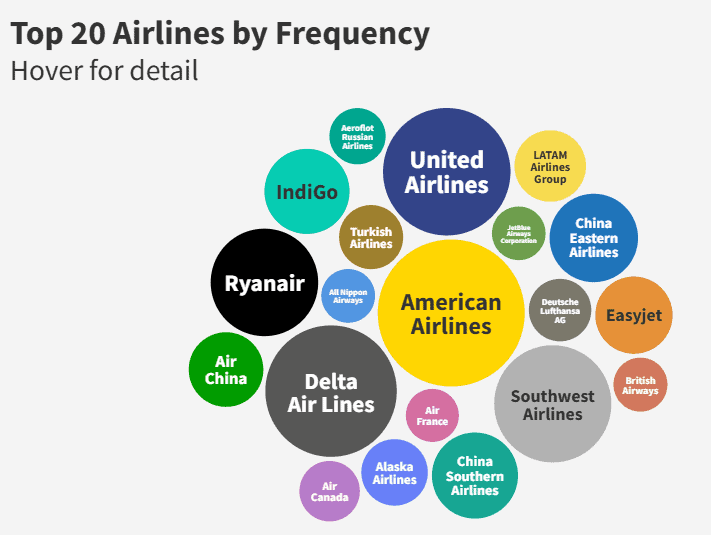
Top 20 Airlines by Frequency
 (Source: oag.com)
| Airlines | June 2025 | June 2024 | % Change | Absolute Change |
|
United Airlines |
148,879 | 136,949 | 8.7% | 11,930 |
| LATAM Airlines Group | 46,801 | 43,796 | 6.9% |
3,005 |
|
Aeroflot Russian Airlines |
28,968 | 29,512 | -1.8% | 544 |
| China Eastern Airlines | 71,625 | 70,405 | 1.7% |
1,220 |
|
IndiGo |
66,258 | 60,602 | 9.3% | 5,656 |
| Turkish Airline | 37,656 | 35,368 | 6.5% |
2,288 |
|
JetBlue Airways Corporation |
26,336 | 27,374 | -3.8% | -1,038 |
| Ryanair | 105,908 | 102,302 | 3.5% |
3,606 |
|
All Nippon Airways |
26,452 | 25,695 | 2.9% | 757 |
| Air China | 50,974 | 49,391 | 3.2% |
1,583 |
|
American Express |
197,708 | 187,635 | 5.4% | 10,073 |
| Deutch Lufthansa AG | 35,754 | 37,499 | -4.7% |
-1,745 |
|
EasyJet |
54,637 | 54,495 | 0.3% | 142 |
| All Nippon Airways | 26,452 | 25,695 | 2.9% |
757 |
|
Delta Airlines |
158,306 | 148,778 | 6.4% | 9,528 |
| British Airways | 26,655 | 26,340 | 1.2% |
315 |
|
South Airlines |
125,811 | 127,415 | -1.3% | -1,604 |
| Air France | 25,707 | 25,466 | 0.9% |
241 |
|
Air Canada |
33,448 | 33,372 | 0.2% | 76 |
| Alaska Airlines | 40,453 | 38,463 | 5.2% |
1,990 |
|
China Southern Airlines |
67,876 | 66,472 | 2.1% |
1,404 |
- American Airlines is still the world’s biggest airline based on the number of flights, with 197,700 flights scheduled this month. That’s 39,400 more flights than Delta Air Lines, which holds the second spot.
- United Airlines had the largest increase in flight activity, with 11,900 more flights than the same month last year. American Airlines followed closely with an increase of 10,000 flights.
- IndiGo showed the fastest growth rate, with flight numbers rising by 9.3% compared to last year.
On the other hand, 4 out of the top 20 airlines had fewer flights this month than they did a year ago:
- Southwest Airlines dropped by 1.3%
- Aeroflot was down by 1.8%
- JetBlue had a 3.8% decrease
- Lufthansa saw the biggest decline at 4.7%.
Airlines’ Revenue and Profitability
- In 2024, the global airline industry is expected to generate approximately $964 billion, representing a 9.7% increase from 2023.
- The industry is also expected to generate approximately $59.9 billion in operating profit, representing a 14.7% increase from last year.
- The net profit is estimated to be $30.5 billion, giving airlines a 3.1% profit margin after covering all expenses.
- By 2025, airline revenue is expected to surpass the $1 trillion mark, reaching approximately $1.007 trillion, a 4.4% increase from 2024.
- Operating profit is likely to grow to $67.5 billion, with an operating margin of 6.7%.
- The net profit is expected to increase to $36.6 billion, leading to a net margin of 3.6%.
- On average, airlines could earn around $7 for every passenger, based on more than 5 billion passengers expected to travel in 2025.
- Fuel remains one of the biggest costs for airlines. In 2024, the average jet fuel price was approximately $ 113.80 per barrel, with total fuel spending reaching $281 billion, which accounts for roughly 31% of airline operating costs.
- In 2025, fuel prices are expected to drop to around $87 per barrel, which will help lower fuel expenses to approximately $248 billion, or 26.4% of total costs.
- Total expenses for 2024 are expected to be around $914 billion, which is 6.9% more than the year before. In 2025, spending is forecasted to increase to $940 billion, a 4% rise from the previous year.
- Even though revenues are strong, profit margins are still slim. Net profits are expected to stay between 3.1% and 3.6% in both 2024 and 2025. However, operating margins are improving and are expected to reach 6.7% by 2025.
- When it comes to return on invested capital (ROIC), the numbers are still under target.
- In 2024, ROIC is expected to be around 5.7%, which is lower than the cost of capital.
- This is predicted to rise slightly to 6.8% in 2025, but it will still be below what most airlines need for long-term gains.
- Air travel is steadily growing. In 2024, airlines are expected to carry around 4.7 to 4.9 billion passengers.
- In 2025, this number is expected to surpass 5 billion, representing a 6.7% year-over-year increase.
- Airlines are making about $6.40 in net profit per passenger in 2024, and this is expected to rise to $7 per passenger in 2025.
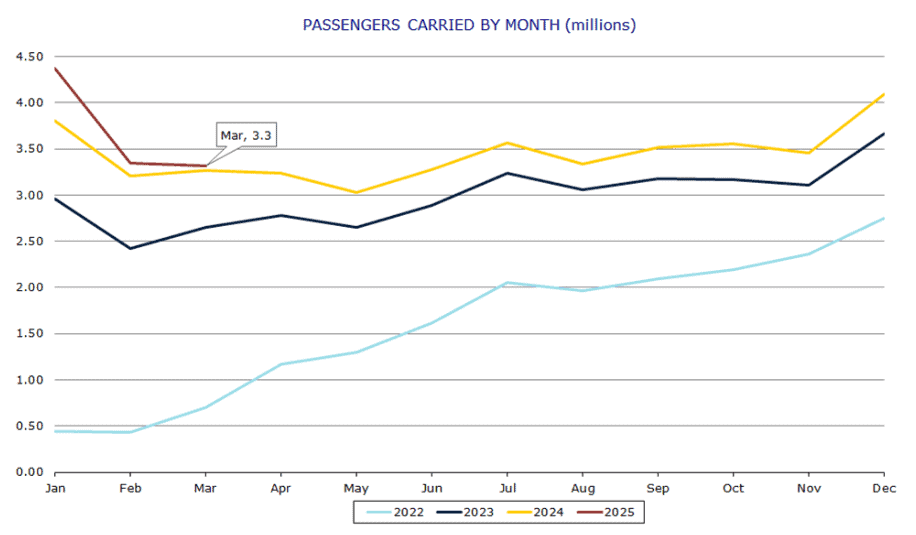
International Airlines Statistics
- In March 2025, a total of 61 international airlines ran regular flights in and out of Australia. This count includes three freight-only carriers but excludes airlines that operate only through code-share agreements.
- That month, around 3.318 million passengers flew internationally to or from Australia. This was slightly higher than 3.266 million in March 2024 and a clear rise from 2.650 million in March 2023.
- For the 12 months ending March 2025, international passenger numbers hit 42.113 million. This shows steady growth compared to 38.025 million in the year ending March 2024 and 25.539 million in the same period ending March 2023.
- In March 2025, airlines offered about 4.431 million seats on international flights to and from Australia. That’s a 3.7% increase from March 2024.
- The seat usage rate, also known as the load factor, was 76.7% in March 2025. This represented a decline from 78.3% in March 2024 and 80.6% in March 2023, indicating that fewer seats were filled despite more being available.
 (Source: bitre.gov.au)
- The following is the summary of the month-on-month activity of International Airlines:
| March 2024 | March 2025 | Change | |
|
Aircraft Movements |
17 218 | 17 469 | 1.5% |
| Flights | 16 772 | 17 069 |
1.8% |
|
Available Seats (million) |
4.274 | 4.431 | 3.7% |
| Mail (tonnes) | 2 107 | 2 081 |
-1.2% |
|
Freight (tonnes) |
94 039 | 97 743 | 3.9% |
| Passengers carried (million) | 3.266 | 3.318 |
1.6% |
Conclusion
The most recent airline data from 2024 to 2025 shows that the global air travel industry is making steady progress. More than 5.2 billion passengers are expected to fly in 2025, with total revenue projected to exceed $1 trillion, indicating strong growth. While airlines are still dealing with high costs and slim profit margins, both passenger and cargo demand are rising.
Regions like Asia-Pacific are seeing the fastest growth, and airlines worldwide are working hard to boost efficiency, maintain safety, and become more eco-friendly to stay ahead in a competitive market. We have shed enough light on airline statistics through this article.
