






Introduction
Live Streaming Statistics: Do you think live streaming is still just about watching people play video games? That question, once a fair query, is now thoroughly obsolete. Over the past few years, the live streaming landscape has changed, from a niche digital pastime into a multi-hundred-billion-dollar global economic engine.
What fuels this explosive growth? It’s because of the right tech advancement, the widespread rollout of 5G networks, the increasing dominance of the mobile device in our daily lives, and the core human desire for authenticity and immediate connection.
Creators and brands have realized that live content generates engagement levels 3 to 10 times higher than pre-recorded video, which simply cannot be matched by static content. So, this in-depth analysis will discuss up-to-date data.
We’ve gathered the most crucial figures for live streaming statistics, especially on market valuation, platform dominance, monetization trends, and the forces of live commerce and AI integration. These live streaming statistics are designed to help creators, marketers, and investors with the insights needed to not only understand the landscape but to master it. So, let’s get started.
Editor’s Choice
- More than one-fourth, 28.5% of all global internet users, tune into a live stream at least once every week, cementing its status as a core media habit.
- Global audiences consumed an astounding 5 billion hours of live-streamed content in Q2 2024 alone, marking a sharp return to growth after a post-pandemic plateau.
- The global live streaming market is valued at approximately $100 billion in 2024 and is forecast to rocket to $345 billion by 2030, representing a 23% Compound Annual Growth Rate CAGR.
- Approximately 27% of all global live stream viewing occurs on mobile devices, a figure that is consistently accelerating due to improved mobile network quality and accessibility.
- Viewers typically spend 3 times longer watching a live broadcast compared to on-demand video, proving the magnetic pull of immediacy.
- The global livestream e-commerce market is projected to skyrocket from $20.75 billion in 2025 to an astonishing $287.17 billion by 2034, with a 9% CAGR.
- The niche Live Streaming Pay-Per-View PPV market is expected to surge from $1.5 billion in 2024 to $5.5 billion by 2033, with sports and concerts leading the charge.
Media Streaming Market Size
(Source: market.us)
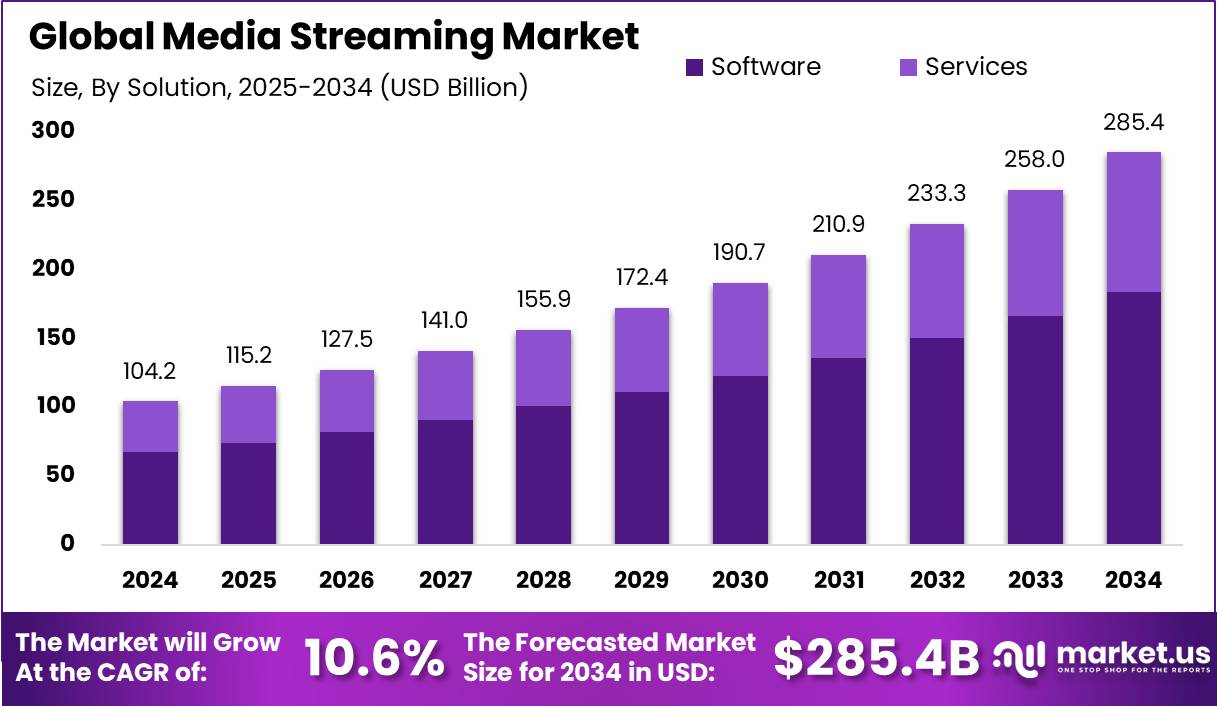
- The market is projected to grow from USD 104.2 billion in 2024 to USD 285.4 billion by 2034, representing nearly a threefold expansion over the decade.
- The market is expected to grow at a CAGR of 10.6%, signalling strong and sustained double-digit growth throughout the forecast period.
- In 2025, the market will reach USD 115.2 billion, marking a steady early-stage increase driven by rising global demand for digital content.
- By 2026, the market size is forecasted at USD 127.5 billion, reflecting continued adoption of subscription-based streaming platforms worldwide.
- The 2027 projection of USD 141.0 billion indicates accelerated growth as streaming services expand into emerging markets and new content categories.
- By 2028, the market will hit USD 155.9 billion, showcasing the increasing reliance on cloud-based and on-demand entertainment solutions.
- In 2029, valuation reaches USD 172.4 billion, highlighting growing investments in original content, live streaming, and AI-driven personalization.
- The 2030 milestone of USD 190.7 billion demonstrates the sector’s resilience and the rising integration of streaming into everyday consumer lifestyles.
- By 2031, the market is projected at USD 210.9 billion, crossing the USD 200 billion mark and underscoring its position as a dominant entertainment industry.
- The 2032 forecast of USD 233.3 billion reflects the continued dominance of both software platforms and complementary streaming services.
- In 2033, the market will reach USD 258.0 billion, with services contributing a notably larger share alongside software solutions.
| Metric | Value | Growth/Trend |
| 2025 Market Valuation | $115.2 Billion | Strong foundational market size. |
| Projected 2030 Value | $190.7 Billion | 10.6% CAGR 2024 to 2034. |
| Q2 2024 Total Watch Hours | 8.5 Billion Hours | Equates to over 970,000 years of content. |
| Weekly Global Viewers | 28.5% of Internet Users | Live streaming is a core weekly activity. |
| Average Session Length | 25.4 Minutes | Reflects high viewer engagement. |
| Live vs. On-Demand Watch Time | 3x Longer for Live | Live immediacy drives retention. |
Platform Dominance And Audience Segmentation
| Platform | Dominant Metric | Global Watch Hour Share |
| Twitch | Content Hours Watched | 61% |
| YouTube Live | Total User Reach | 23% |
| Kick | Fastest Growth Rate | 5 to 6% |
| Facebook Live | Social Platform Reach | 42.6% of viewers use it |
| Mobile Viewing Share | Dominant Device Trend | 27% of streams watched on mobile |
(Reference: demandsage.com)
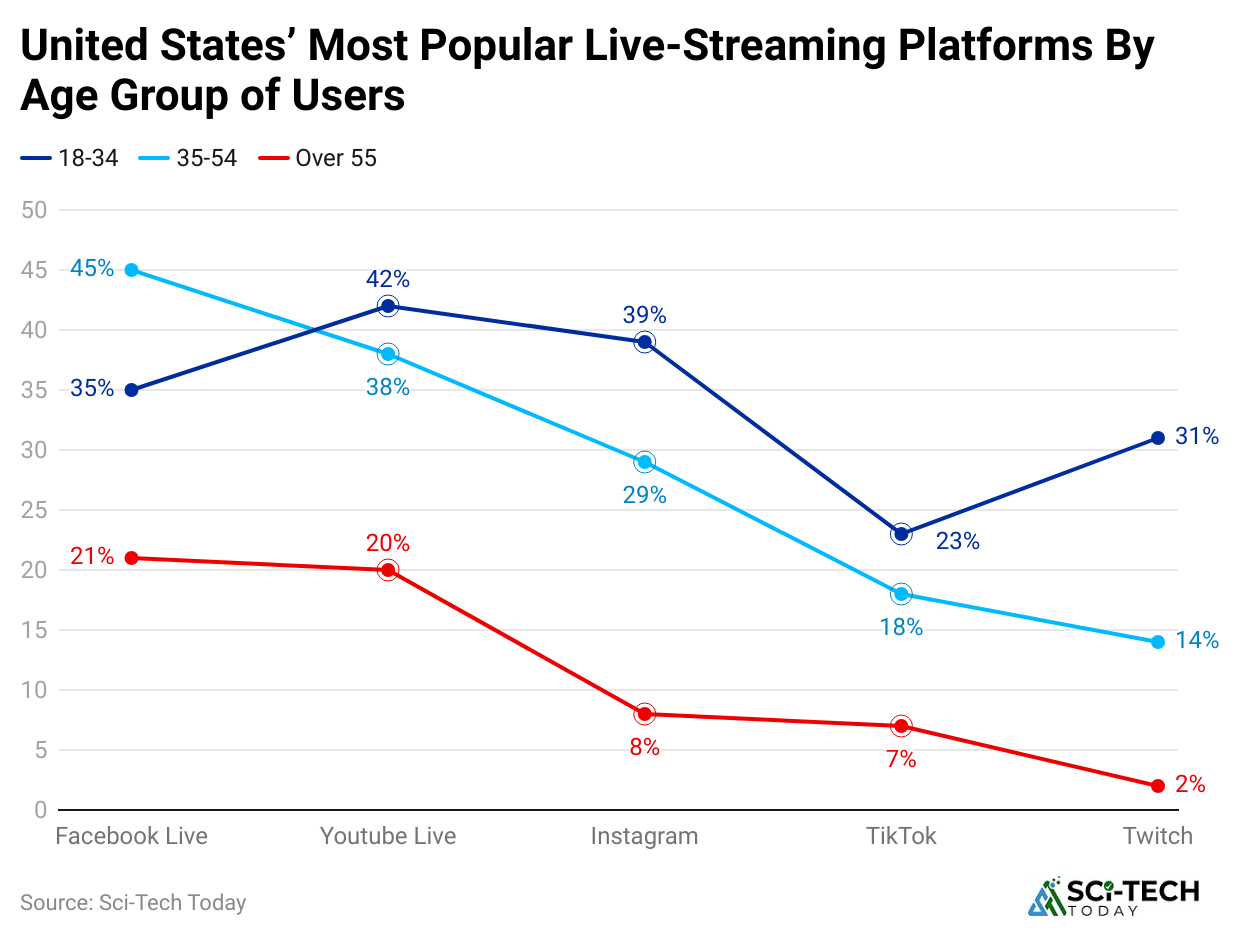
- While not being the top platform across all categories, YouTube Live takes pole position at 47%, and TikTok Live takes second place by replacing Twitch in 2025, while Twitch continues to be #1 in gaming at 54%.
- The biggest highlight is TikTok Live, which went from 5-6% in 2024 to a massive 35.3 billion hours watched in 2025 and surpassed Twitch as the number 2 platform during Q1 2025 despite regulatory pressures.
- The fastest growing major platform is Kick, with year-on-year growth of 131%, recording 5.1 billion hours watched in 2025, but continued recovery through Q1 2026.
- Industry hours hit 36.4 billion in 2025, approaching its highest point at 37.1 billion in 2021 during the pandemic, reaffirming live streaming as a structurally growing market segment.
| Platform | Dominant Metric | Global Watch Hour Share |
| YouTube Live | Content Hours Watched | 47% |
| TikTok Live | Total User Reach | – |
| Twitch | Gaming | 54% |
| Facebook Live | Social Platform Reach | 42.6% of viewers use it |
| Mobile Viewing Share | Dominant Device Trend | 27% of streams watched on mobile |
Monetization and Revenue Stream Statistics
(Source: nature.com)
- Global Subscription Video-on-Demand SVOD subscriptions surpassed 530 million by the close of 2024.
- SVOD revenue is projected to grow at an 11% CAGR through 2026, aiming for an estimated market value of USD 95 billion.
- More than 55% of viewers explicitly state they prefer watching advertisements during live streams over paying a subscription fee to access the content ad-free.
- Streaming video advertising revenue is forecast to reach USD 60 billion by 2025, significantly fueled by the proliferation of AVOD and Free Ad-supported Streaming TV FAST channels.
- Approximately 72% of marketers now believe that video content delivers a higher conversion rate than other forms of digital content.
- Nearly 48% of live stream viewers worldwide are willing to pay for exclusive live content from their preferred creators, sports organizations, or events.
- Over 40% of professional broadcasters have successfully monetized their content using subscription models, with the hybrid AVOD-SVOD approach becoming the industry standard.
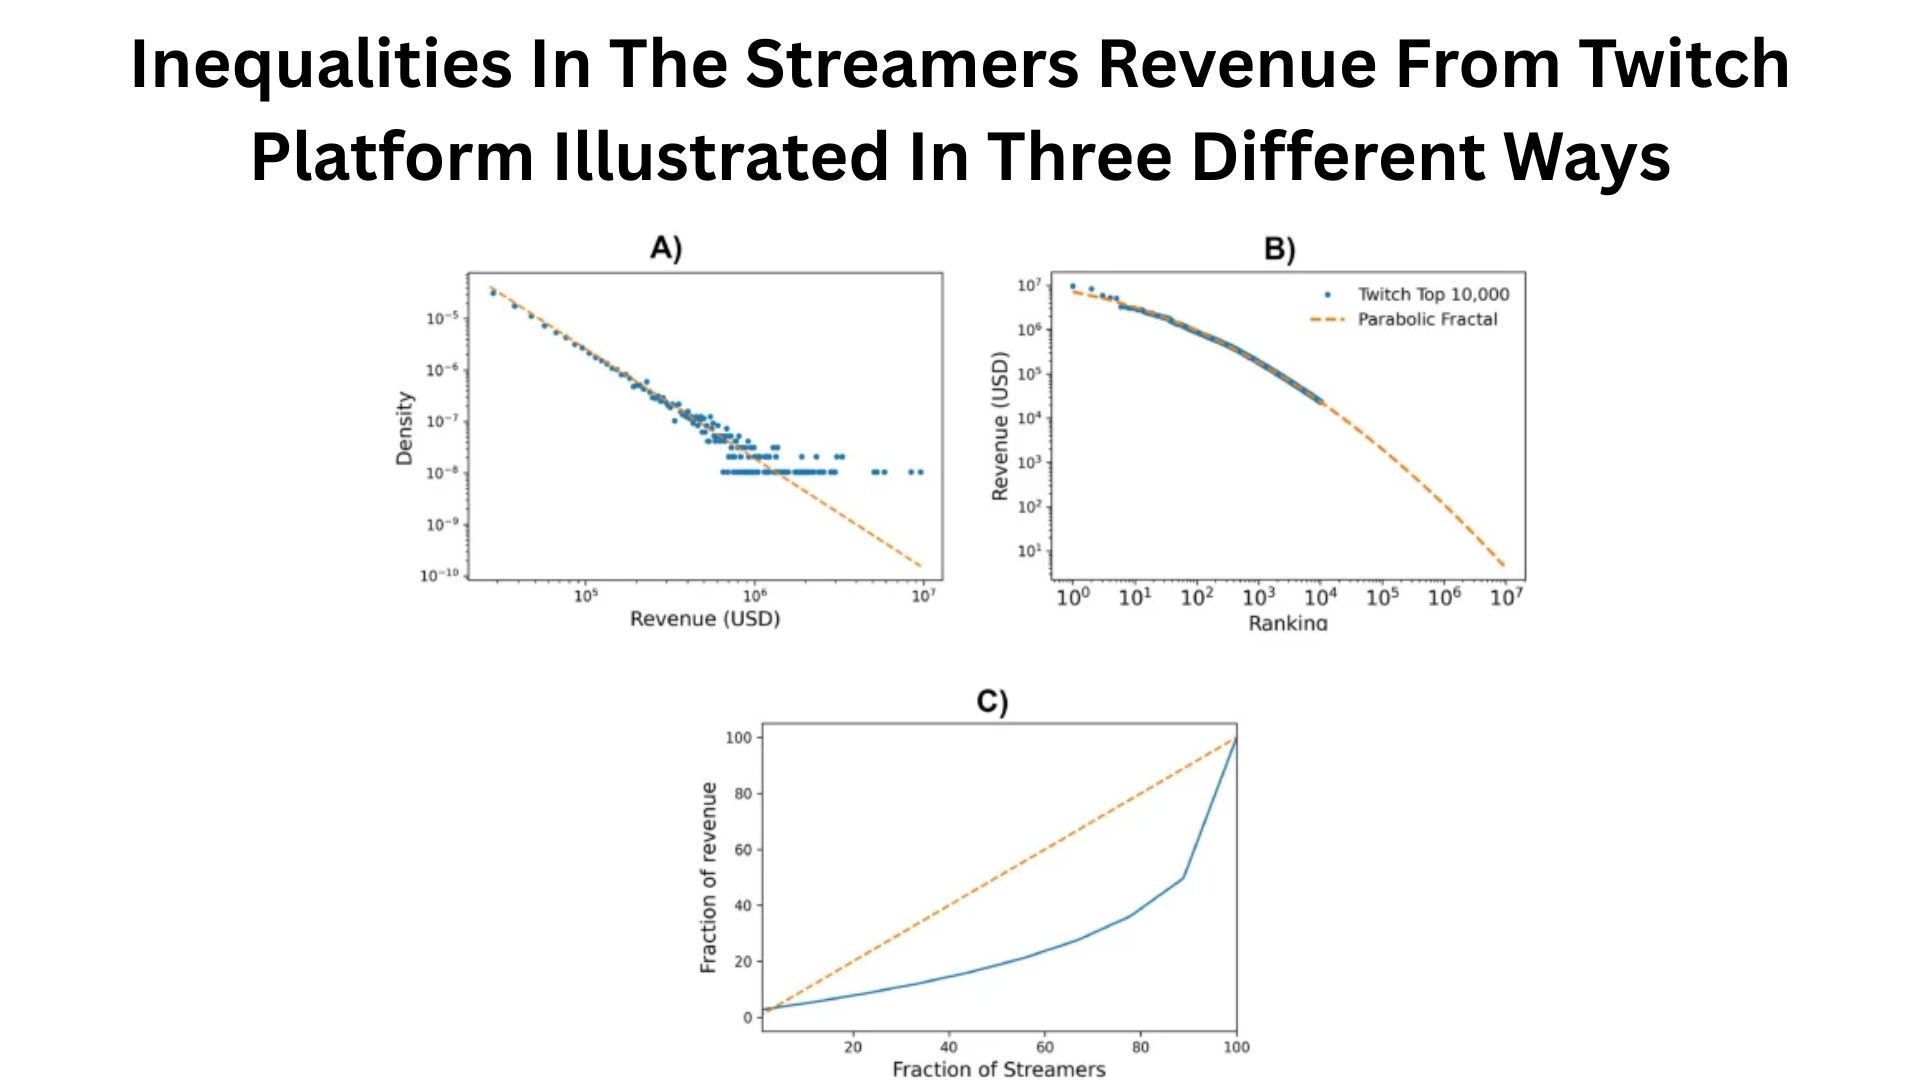
- The average Twitch streamer with 10 to 20 concurrent viewers can typically earn between USD 50 and USD 100 per stream via donations, subscriptions, and bits.
- Brands invested a colossal USD 30.10 billion in streaming ads in 2024, a figure that is rapidly catching up to the USD 60.56 billion spent on traditional television advertising.
| Monetization Segment | 2024/2025 Value | Growth/Preference Data |
| Streaming Ad Revenue | Projected $60 Billion by 2025 | Fueled by AVOD and FAST channels. |
| Global SVOD Subscriptions | Over 530 Million AED 2024 | Expected 11% CAGR through 2026. |
| Viewer Ad Preference | 55% prefer ads over subscription fees. | Strong preference for free, ad-supported access. |
| Viewers Willing to Pay | Nearly 48% | Willing to pay for exclusive live content. |
| Marketers Citing Conversion | 72% | Believe video delivers higher conversion rates. |
| Twitch Monthly Subs | 16 million monthly subscription purchases. | High loyalty and direct creator support. |
Livestream E-Commerce and Pay-Per-View Power
(Source: market.us)
Livestream E-Commerce Market
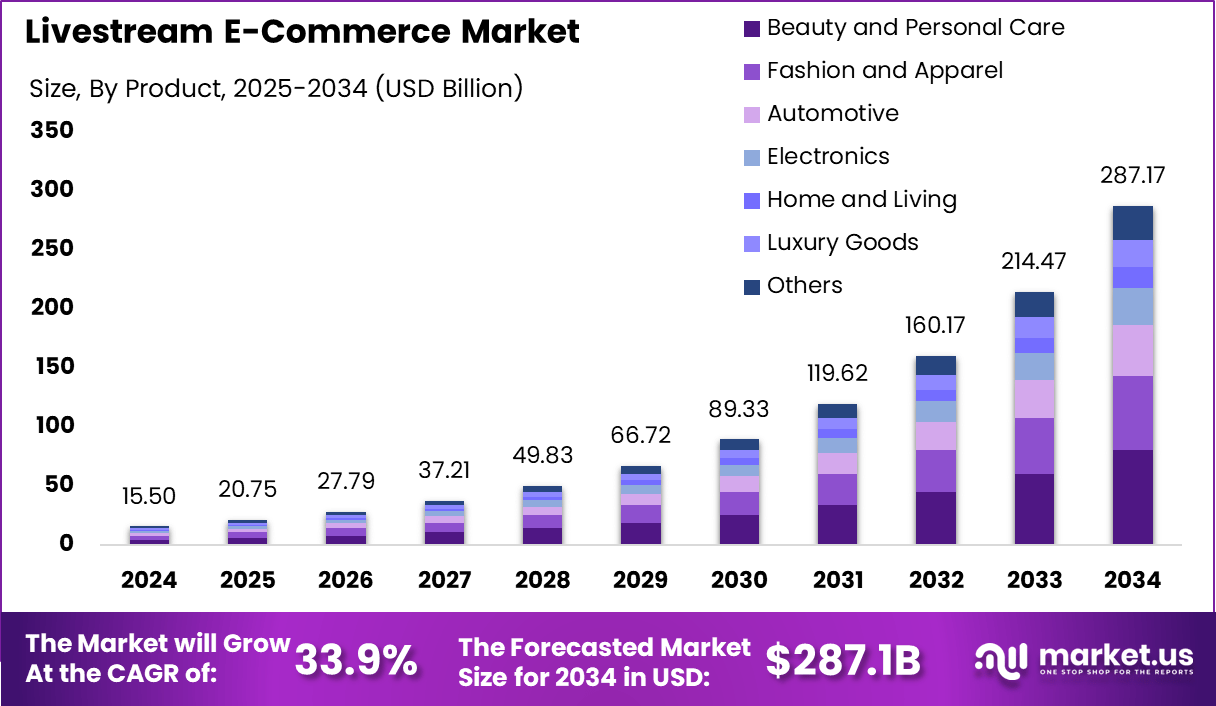
- The market is set to grow from USD 15.50 billion in 2024 to USD 287.17 billion by 2034, representing an extraordinary 18-fold expansion over the decade.
- The market will grow at an impressive CAGR of 33.9%, making it one of the fastest-growing segments in the global e-commerce industry.
- In 2025, the market is projected to reach USD 20.75 billion, reflecting rising consumer interest in interactive shopping experiences.
- By 2026, the value will climb to USD 27.79 billion, driven by the increasing adoption of livestream platforms across social media channels.
- The 2027 forecast of USD 37.21 billion highlights accelerated brand investments in influencer-driven and real-time shopping strategies.
- By 2028, the market will reach USD 49.83 billion, nearly crossing the USD 50 billion threshold as livestream commerce becomes mainstream.
- In 2029, valuation rises to USD 66.72 billion, showcasing strong consumer adoption beyond Asia into Western and emerging markets.
- The 2030 milestone of USD 89.33 billion reflects deeper integration of AI, AR, and real-time engagement tools into shopping experiences.
- By 2031, the market is forecasted at USD 119.62 billion, crossing the USD 100 billion mark and signaling its transformation into a core retail channel.
- The 2032 projection of USD 160.17 billion demonstrates continued momentum across categories like Beauty, Fashion, and Electronics.
- In 2033, the market will reach USD 214.47 billion, with Luxury Goods and Home & Living gaining noticeable traction in livestream sales.
Live Streaming Pay-Per-View PPV Market
- The Live Streaming PPV market is projected to grow from USD 45.28 billion in 2024 to an estimated USD 177.50 billion by 2035, sustaining a 13.22% CAGR from 2025 to 2035.
- The Sports segment dominates PPV revenue, projected to reach USD 25.63 billion by 2024, showcasing a robust 14.5% CAGR.
- The Concerts segment is also a major player, forecast to generate USD 10.26 billion by 2024, with a strong 12.8% CAGR.
- Online Gaming/Esports is the fastest-growing niche, with PPV revenue anticipated to hit USD 2.98 billion by 2024, posting a powerful 16.7% CAGR. North America remains the largest single region for PPV revenue in 2024.
| E-Commerce Metric | Value | Growth/Dominance |
| 2024 E-Commerce Market Size | USD 128.42 Billion | Strong market foundation. |
| Projected 2033 E-Commerce Value | USD 2.47 Trillion | 39.9% CAGR 2025 to 2033. |
| Regional Dominance | Asia-Pacific | 66.0% global revenue share 2024. |
| Top Product Category | Fashion & Apparel | 21.3% market share 2024. |
| US Market Growth Rate | 37.2% CAGR 2025 to 2033 | Rapid acceleration in the US. |
Enterprise, Marketing, and B2B Live Video Adoption
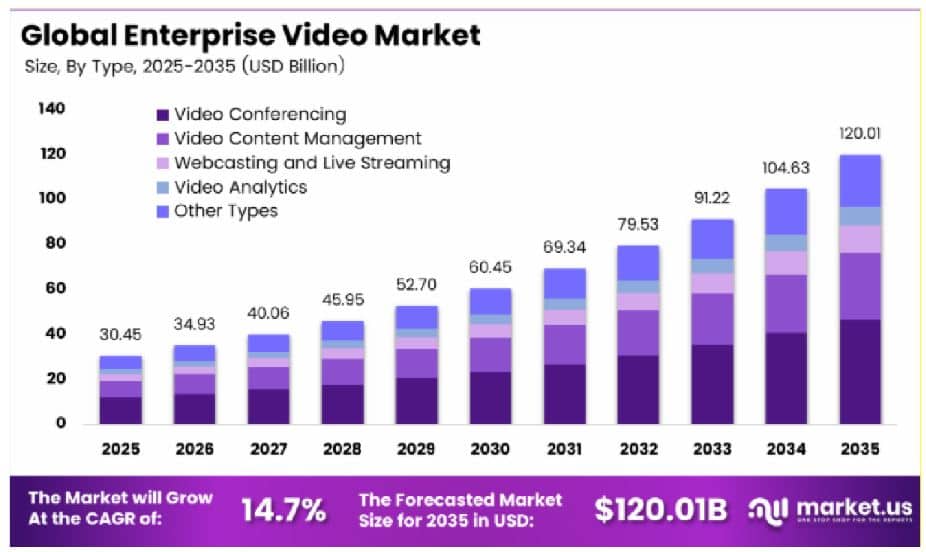
(Reference: thunderbit.com)
- The market is projected to grow from USD 30.45 billion in 2025 to USD 120.01 billion by 2035, representing nearly a fourfold increase over the forecast period.
- The market will expand at a strong CAGR of 14.7%, reflecting sustained demand for enterprise video solutions across industries.
- In 2026, the market is expected to reach USD 34.93 billion, driven by the growing adoption of hybrid work and digital collaboration tools.
- By 2027, the value will rise to USD 40.06 billion, crossing the USD 40 billion mark as businesses invest more in video communication infrastructure.
- The 2028 forecast of USD 45.95 billion highlights increasing reliance on video conferencing and content management platforms.
- By 2029, the market will reach USD 52.70 billion, showcasing accelerated integration of video tools into enterprise workflows.
- In 2030, valuation climbs to USD 60.45 billion, surpassing the USD 60 billion threshold as AI-powered video analytics gain traction.
- The 2031 milestone of USD 69.34 billion reflects rising investments in webcasting and live streaming for corporate events.
- By 2032, the market is forecasted at USD 79.53 billion, demonstrating continued momentum across all video solution categories.
- The 2033 projection of USD 91.22 billion indicates a near USD 100 billion growth as enterprises prioritize secure and scalable video platforms.
- In 2034, the market will reach USD 104.63 billion, crossing the USD 100 billion milestone and confirming video’s role as a critical enterprise tool.
| Enterprise Metric | Value | Growth/Use Case |
| 2025 Enterprise Video Market Size | USD 30.45 Billion | Strong B2B adoption. |
| Projected 2035 Enterprise Value | USD 120.01 Billion | 14.7% CAGR 2025-2035. |
| Top End-User Vertical 2024 | IT & Telecom | 26.4% market share. |
| Fastest Growing Vertical | Healthcare | 16.13% CAGR through 2030. |
| Marketing Preference | 80% of People | Prefer live brand video over a blog. |
| Engagement Lift | Double the rate | Live video vs. standard video in influencer marketing. |
AI Integration, FAST Channels, and Future Trends

(Reference: zippia.com)
- Over 60% of professional broadcasters are already leveraging AI tools in their live streaming workflows for tasks like automated content tagging.
- AI-powered virtual human streamers, also known as VTubers or AI Streamers, are gaining significant traction, particularly in Asian markets and the gaming vertical.
- The rise of FAST Free Ad-supported Streaming TV channels grew by 35% globally in the past year, offering a familiar, linear TV experience without the subscription fee.
- Hybrid monetization models, which merge the AVOD approach of FAST with premium microtransactions or subscription tiers for SVOD.
- 5G network traffic is projected to be dominated by video content, which could account for up to 90% of all data.
- Interactive video advertising has proven highly effective, driving 47% more engagement time and being 32% more memorable than non-interactive.
| Future Trend Metric | Value/Stat | Impact on Live Streaming |
| Broadcasters Using AI | Over 60% | Automates tasks like moderation and captioning. |
| Global FAST Channel Growth | 35% in the last year | Accelerating the adoption of AVOD models. |
| Interactive Ad Engagement | 47% more engagement time | Key for maximizing ROI in live streams. |
| 5G Network Traffic | Projected 90% from the video | High-quality streaming relies on 5G rollout. |
| Viewer Retention Factor | 30% increase | Achieved by using adaptive bitrate streaming, often AI-optimized. |
Conclusion
Overall, live streaming has moved past being a digital sideline. The next few years won’t just be about growth; they will be marked by a rapid, structural transformation. From the growth projections in live e-commerce to the increasing sophistication of AI-powered broadcasting tools and the consolidation of platform market shares, the opportunity for creators, marketers, and businesses has never been clearer.
Whether you’re a brand seeking to double your engagement, an investor looking for the next trillion-dollar market, or a creator wanting to build a loyal, paying community, the future of content is live.
Use this article as your map to analyze and get clear insights for your creator career. I hope you find this article useful. If you have any questions, kindly let us know. Thanks for staying up till the end and reading all of my gathered information.
FAQ
There are more than 3 – 3.6 million people who concurrently watch live-stream videos each day. At any particular time, there are more than 3 million individuals watching live-stream videos on Twitch and YouTube Gaming platforms. This number fluctuates from season to season and from weekdays to weekends.
The “Big 3” in video streaming include Netflix, Amazon Prime Video, and Disney, which owns both Disney+ and Hulu. Together, they own the majority market shares and subscribers in the industry.
Live streaming usually consumes 0.7 GB to 3 GB of data per hour when it comes to HD streaming, but it could be 7 GB to 10 GB per hour when using 4K quality.

Sources