Introduction
Energy As a Service Statistics: When you hear the term energy as a service, it might sound a little complicated at first, but it’s actually quite simple once you break it down. Instead of businesses or even households paying just for electricity units every month, they now have an option to pay for complete energy solutions as a service.
Think of it like how people use Netflix or Spotify – you don’t own the movies or songs, but you get full access to what you need, whenever you need it. In the same way, energy as a service lets customers access clean power, energy efficiency, and reliable systems without the burden of owning or maintaining expensive infrastructure.
The idea behind energy as a service is to shift the focus from just buying electricity to getting guaranteed outcomes, like cost savings, reduced carbon footprint, and better reliability. Companies offering this service take care of everything, installing solar panels, batteries, energy management systems, or even building microgrids. Customers just pay a fixed fee or performance-based cost, while the service provider takes care of upgrades, monitoring, and optimization.
This business model is becoming popular across the world because it makes renewable energy adoption easier, reduces upfront costs, and helps organizations focus on their business instead of worrying about power issues. With the rise of digital technology, smart grids, and IoT, energy as a service is changing how energy is delivered and consumed. Let’s get into its complete statistics.
Editor’s Choice
- Energy as a service changes the game by shifting from just paying for electricity to paying for complete energy solutions, with providers managing everything from setup to optimization.
- The global market for energy as a service was valued at around US$70 to US$126 billion in 2024, with forecasts showing it could reach US$150 to US$290 billion by 2030 to 2035.
- Growth is strong, with CAGRs ranging between 7% and 12%, showing steady adoption across industries and regions.
- North America leads with over 42% market share, while Asia-Pacific is the fastest-growing region with a CAGR close to 16% to 17%.
- Europe is also catching up, expected to cross US$28 billion by 2030, driven by renewable energy policies and sustainability goals.
- Segment-wise, energy efficiency services take about 4% share, while renewable energy sources dominate with nearly a 59% share.
- Commercial users make up the largest end-user segment, holding over 61% of the market in 2024.
- Virtual Power Plants (VPPs) are becoming part of energy as a service, with the U.S. alone expected to deploy 30 to 60 GW capacity and save up to US$10 billion annually in grid costs.
- Heavy investments in clean energy are fueling the shift, with global renewable energy spending already at US$200 billion in 2023 and total clean energy investment near US$1.9 trillion per year.
| Category | Key Statistics | Notes |
| Global Market Size 2024 | $70 to 126 B |
Different analysts, varying estimates |
|
Forecast (2030 to 2035) |
$150 to 290 B | CAGR 7% to 12% |
| North America Share | 42.7% ($27.7 B) |
Largest regional market |
|
Europe |
$28.99 B by 2030 | Driven by policies & renewables |
| Asia-Pacific Growth | 16.7% CAGR |
Fastest-growing region |
|
Service Share |
Energy efficiency services (48.4%) | Major contributor |
| Energy Source Share | Renewable energy (59.1%) |
Leading source |
|
End User |
Commercial (61.6%) | Dominant end user |
| Virtual Power Plant (US) | 30 to 60 GW |
4 to 8% of peak demand |
|
Potential Grid Savings |
Up to $10 B/year | By 2030 |
| Clean Energy Investment | $1.9T annually |
Needs to rise to $5.3T by 2035 |
History of Energy as a Service
 (Source: joeducation.eu)
- The idea of energy as a service began shifting into view as companies looked beyond merely selling kWh.
- Instead, the model focused on delivering outcomes, like reliability, efficiency, and sustainability, managed by a provider, with customers paying for the service rather than owning systems outright.
- It gained traction as renewable energy smart grid tech, and IoT matured. Energy providers started offering bundled solutions, like solar plus battery plus management software, as a service.
| Aspect | Summary |
| Origin | Shift from selling energy units to outcomes |
| Drivers | Renewables, smart grids, IoT-enabled management |
Global Market Size and Forecasts
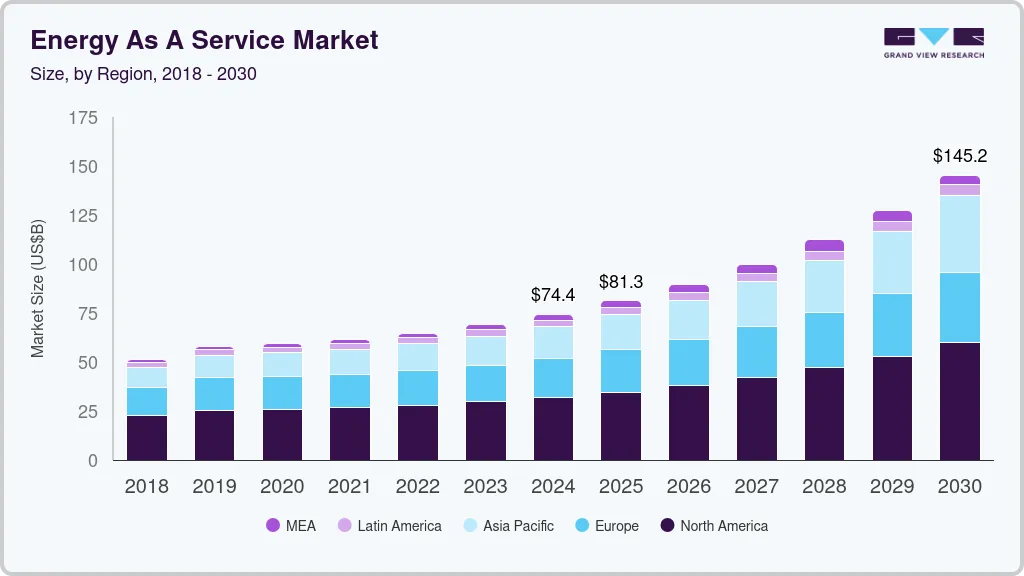 (Source: grandviewresearch.com)
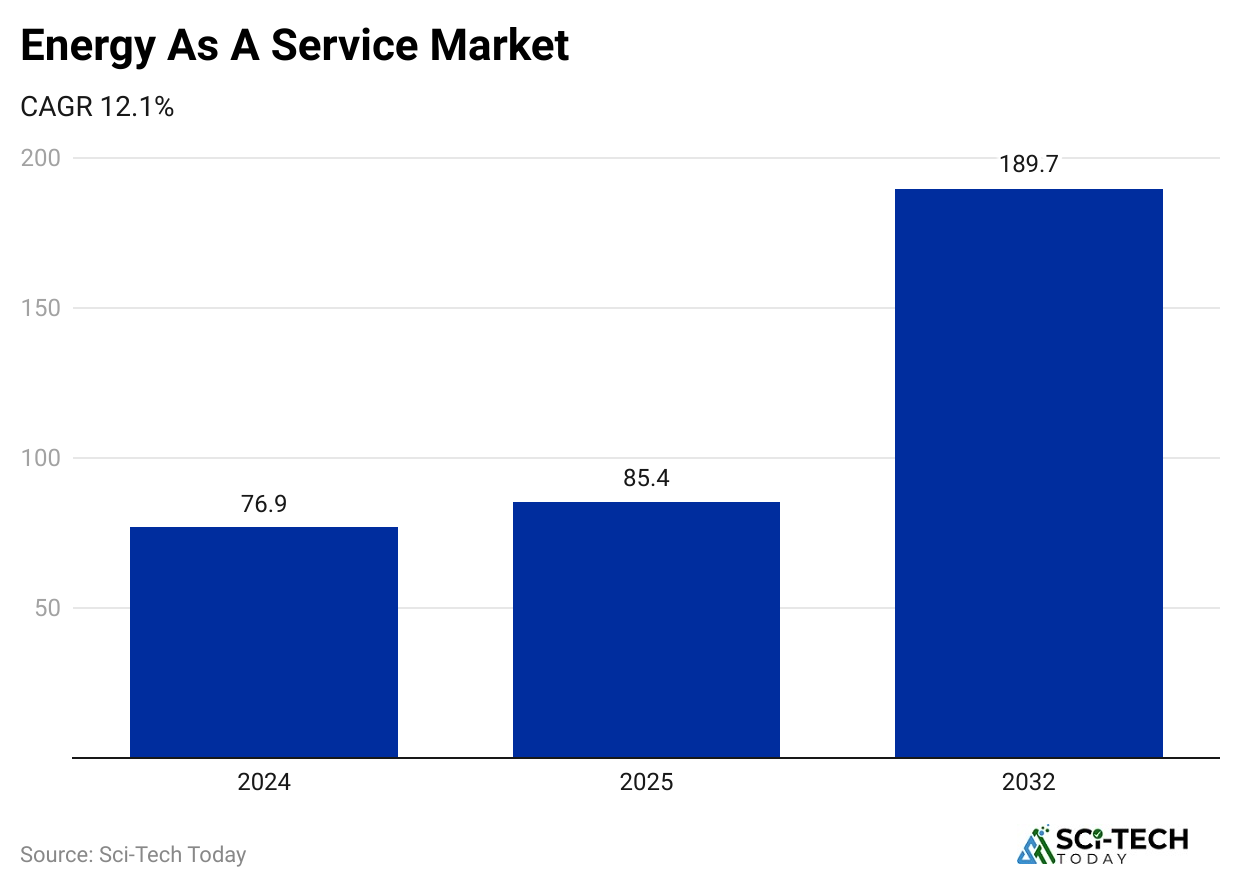
- Multiple sources show that the energy-as-a-service market was already sizable in 2024. One estimate puts it at around $74.43 billion, expected to grow to $145.18 billion by 2030, which is about 12.3% CAGR.
- Another says the market will grow from $72.53 billion in 2024 to $81.46 billion in 2025 (CAGR 12.3%), and reach $130.57 billion by 2029.
- One more source estimated $126 billion in 2024, rising to $291.6 billion by 2034,witht 8an .7% CAGR.
- Yet another sees $76.7 billion in 2024 and $152.8 billion by 2033, abouta 33% CAGR.
| Source & Year | 2024 Value $ | Forecast Year | Forecast Value $ | CAGR |
| Grand View (2024) | 74.43 B | 2030 | 145.18 B | 12.3% |
| Business Research Co. | 72.53 B | 2025 | 81.46 B | 12.3% |
| GMI Insights | 126 B | 2034 | 291.6 B | 8.7% |
| IMARC Group | 76.7 B | 2033 | 152.8 B | 7.33% |
Regional Differences and Dominance
 (Reference: precedenceresearch.com)
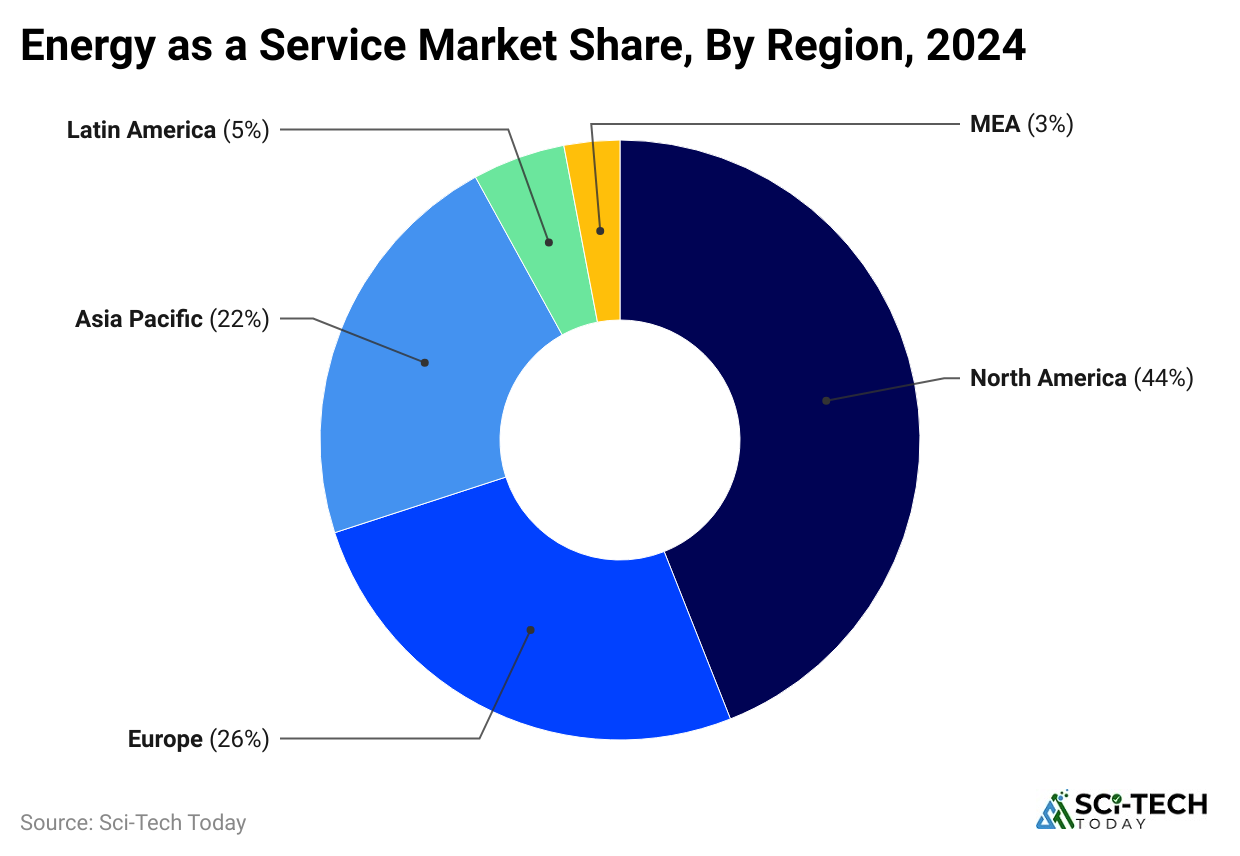
- North America tends to hold the biggest share. In 2024, roughly 42.7% or $27.7 billion came from North America.
- Europe is also big. One forecast expects Europe’s energy-as-a-service market to reach $28.99 billion by 2030 (CAGR 11.2%).
- In some estimates, Europe is the largest region, even ahead of others, for a time.
- In the Asia-Pacific region, especially China and India, the energy-as-a-service uptake is interesting; the Asia-Pacific region is expected to grow at a CAGR of about 16.7%, with China leading.
| Region | 2024 Estimate | Forecast | Notes |
| North America | 42.7% market share $27.7B | Continues dominance | Early adoption, supportive policies |
| Europe | Smaller in 2024, but projected to be 29B by 2030 | Strong growth 11.2% CAGR | Policy push, renewables |
| Asia-Pacific | Growing fastest with about 16.7% CAGR | Rapid infrastructure development | China and India’s expansion |
Segment Trends (By Service, Solution, Usage)
 (Source: coherentmarketinsights.com)
In one analysis:
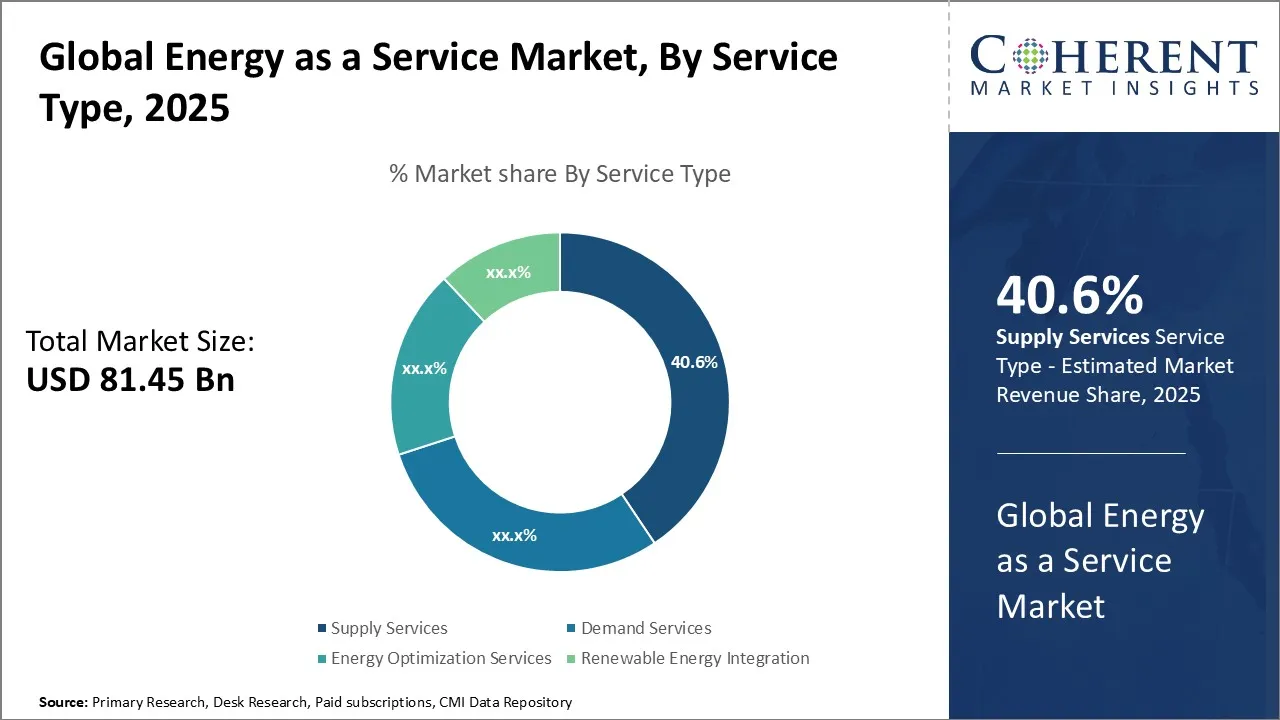
- Energy Optimization & Efficiency Services hold 48.4% share.
- Renewable Energy is the source of 59.1%.
- Integrated Solutions dominate with 59.2%
- Commercial end user leads with 61.6% share.
Another report highlights energy supply services as the largest segment in 2024.
| Segment Type | Leading Sub-segment | Share |
| Service Type | Energy Optimization & Efficiency | 48.4% |
| Energy Source | Renewable Energy | 59.1% |
| Solution Type | Integrated Solutions | 59.2% |
| End User | Commercial | 61.6% |
| Service Segment | Energy Supply Services | Largest |
Growth Drivers and Trends
 (Reference: psmarketresearch.com)
- Rising energy prices and a focus on carbon neutrality push energy as a service adoption.
- Tech advances: smart meters, IoT, AI-powered management, and virtual power plants enable efficient and flexible energy services.
- Renewable energy investment surged to roughly $200 billion in 2023, with total clean energy investment at $1.9 trillion annually, needing to rise to $5.3 trillion by 2035 to meet net-zero targets.
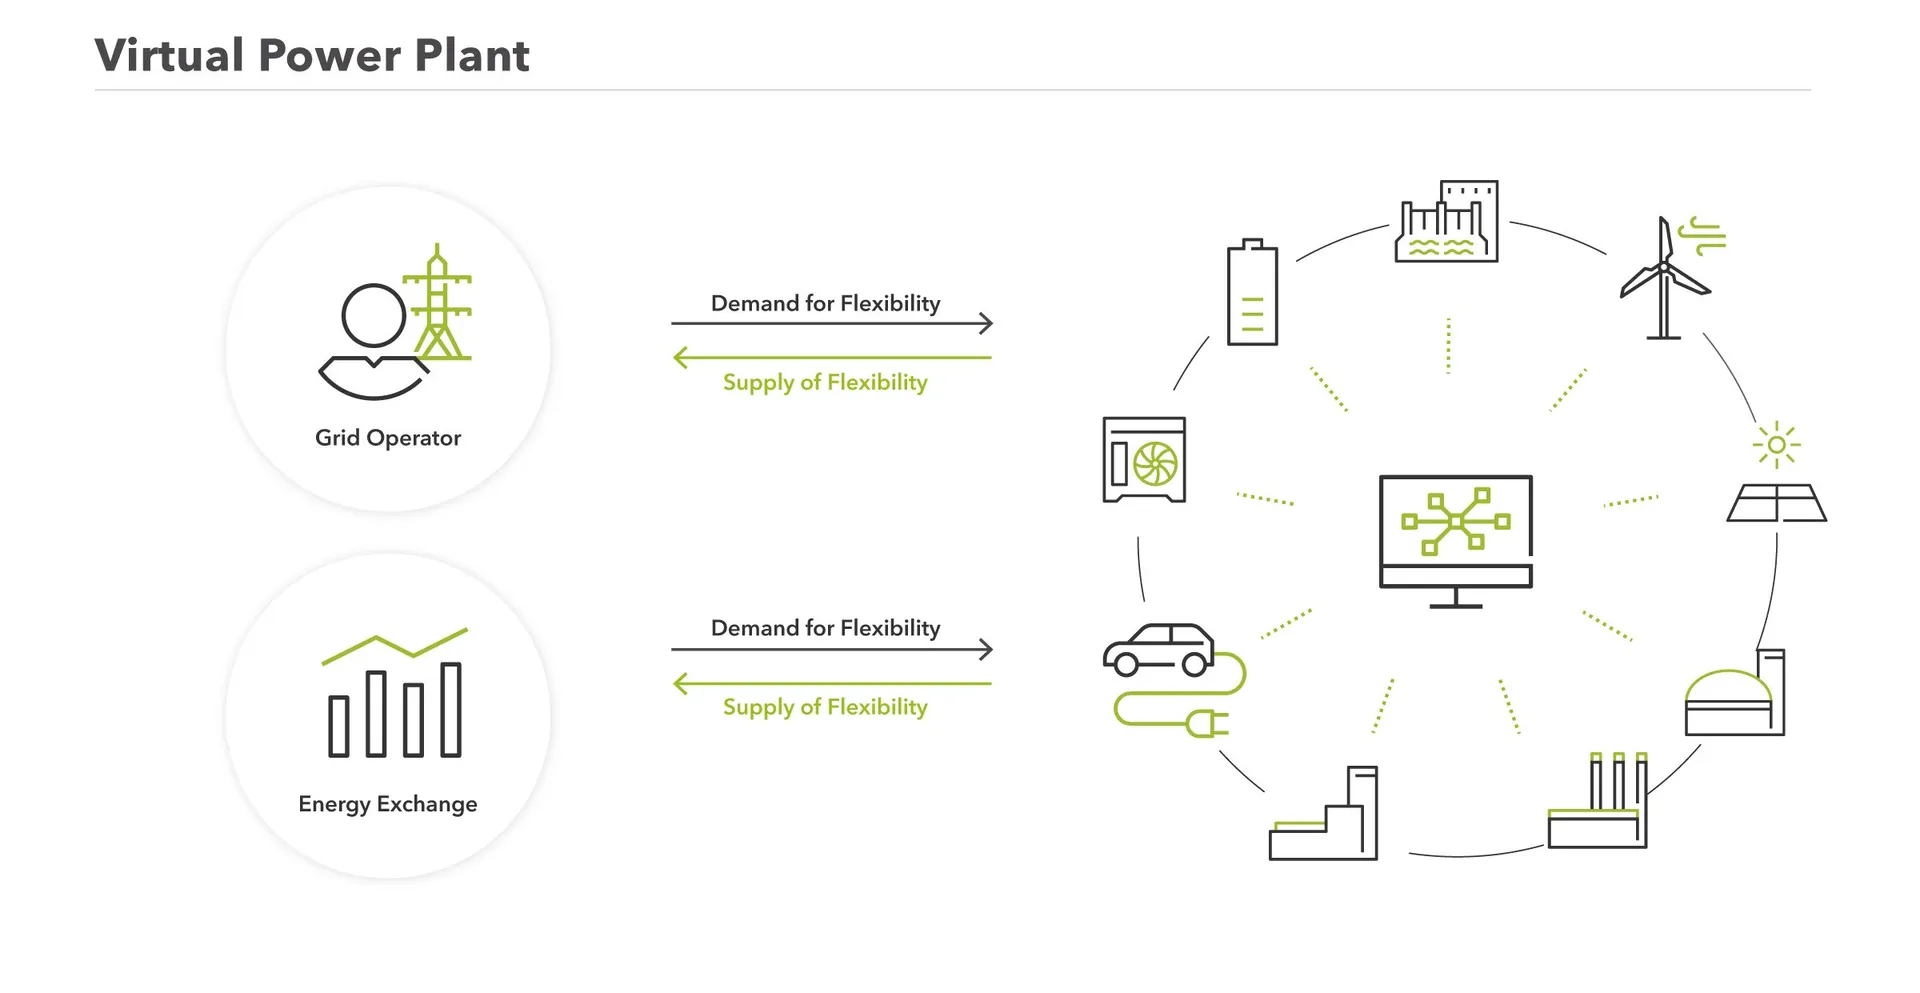
Virtual Power Plants (VPPs) and Related
 (Source: next-kraftwerke.com)
- In the U.S., VPP capacity is estimated at 30 to 60 GW, about 4 to 8% of peak electricity demand.
- California is testing 100,000 residential batteries totaling 535 MW by 2025.
- Demand-side schemes in the UK engaged 2.2 million households and businesses last winter, paying them over $11.9 million.
- The U.S. Department of Energy says VPPs could cut grid costs by up to $10 billion annually and manage around 20% of projected peak demand growth by 2030.
| Metric | Value |
| U.S. VPP capacity | 30 to 60 GW (4 to 8% of peak demand) |
| CA residential battery test | 100,000 units (535 MW) by 2025 |
| UK demand side scheme | 2.2M participants, $11.9M paid |
| U.S. grid cost savings | Up to $ 10B/year, 20% peak demand |
Conclusion
So, overall, the shift towards energy as a service shows how fast the energy world is changing. Instead of sticking to old models where companies just buy electricity, this approach gives them complete energy solutions that are smarter, cleaner, and more reliable.
What makes energy as a service so powerful is that it removes barriers like high upfront costs and technical challenges. It allows businesses and even cities to focus on what matters to them, while experts handle the energy side. With renewable energy, digital tools, and virtual power plants adding more strength, this model is becoming the future of how energy will be delivered.
I hope you like this piece of work. Yes, kindly share it with your friends who are interested in power and supply. If you have any questions, kindly let me know in the comments section.
