
Introduction
Private equity statistics: These private equity statistics are a snapshot of how the investment world works, where the biggest deals are happening, and which sectors are taking the lead. We will discuss growth, strategy, and the flow of capital. In 2024, global private equity and venture capital deals were valued at US$639.02 billion, and by the first half of 2025, the total had already crossed US$386.42 billion. That’s a clear sign of how active and influential this market remains.
From billion-dollar buyouts to sector-specific investments, these statistics tell which industries are attracting funding, how long companies are being held before exit, and how much capital is still waiting to be deployed. In this article, I’ll walk through the most important private equity statistics you should know right now, covering origins, trends, fundraising, global markets, and future projections. Let’s get started.
Editor’s Choice
- Global deal value in 2024 (PE + VC) hit US$639.02 billion, up 24.7% from 2023.
- H1 2025 deal value reached US$386.42 billion, an 18.7% YoY increase.
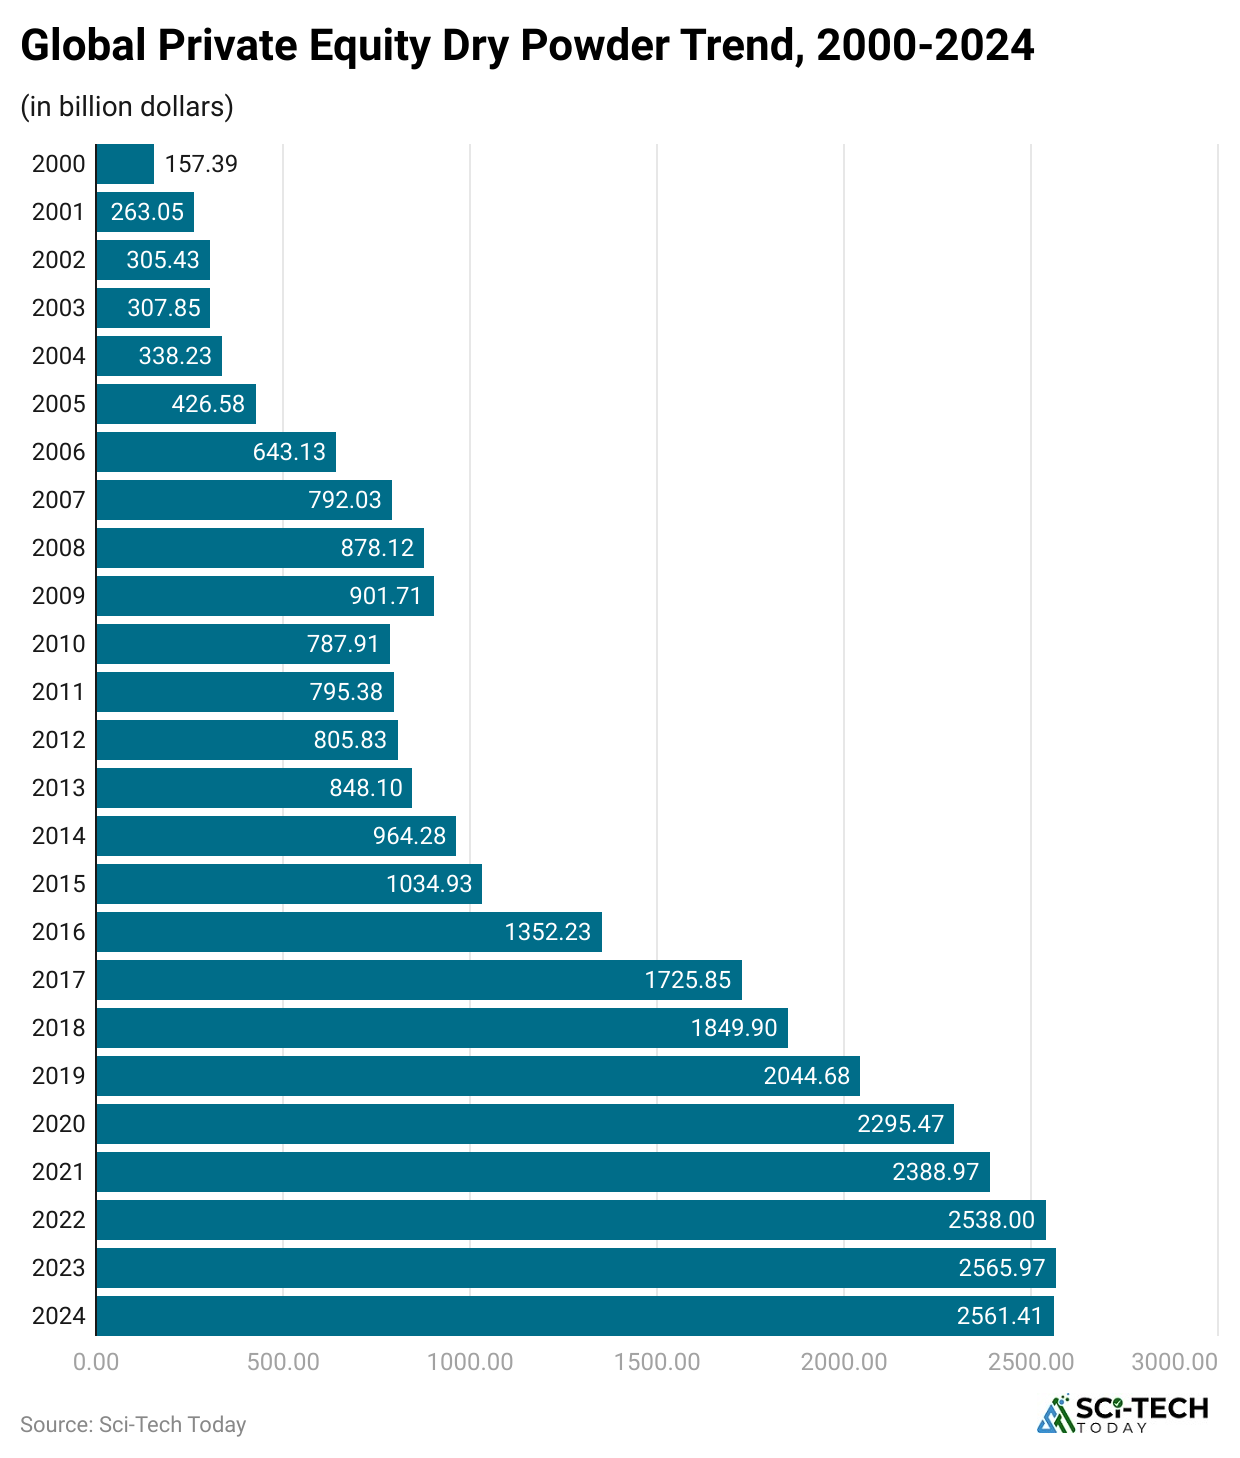
- Dry powder was around US$2.51 trillion by mid-2025, showing high undeployed capital.
- Fundraising fell nearly 20% YoY in 2024, reflecting LP caution and slower exits.
- Bain forecasts private-market assets could hit US$60 to US$65 trillion by 2032.
- The median holding period for portfolio companies was around 8 years in H1 2024.
- Top sectors attracting PE capital: technology, healthcare, and software.
- North America leads in deal value; APAC is the fastest-growing region.
- Exit activity improved in 2024, with trade sales and sponsor-to-sponsor deals dominating.
- Returns vary widely by vintage and manager; top-quartile funds outperform median peers.
- Fee pressure is increasing, with many LPs negotiating better terms.
- Risks include high rates, slow exits, regulatory changes, and competition from excess dry powder.
- Private credit plays a bigger role, filling financing gaps left by banks.
- ESG compliance and tech-driven sourcing are shaping deal strategy.
- Long-term trend: steady institutional allocation growth despite short-term fundraising dips.
| Topic | Key Figures and Insights |
| Origins & Evolution |
Roots in merchant banking; modern PE emerged post-1970s; 1980s LBO boom (e.g., RJR Nabisco); growth into multiple strategies over decades. |
|
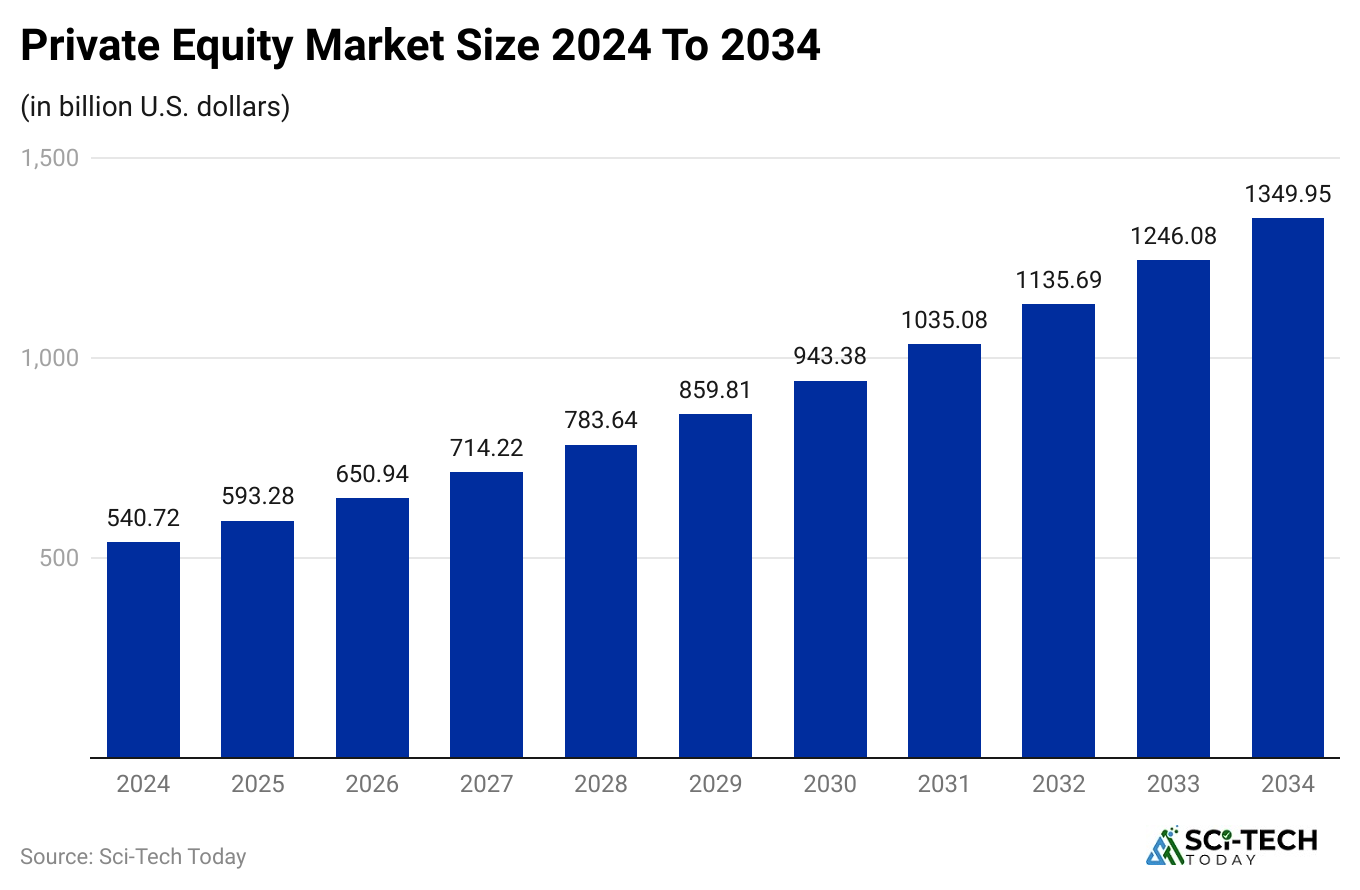
Market Size & AUM |
Closed-end PE AUM dipped slightly in 2024; broader private markets projected at $60 to $65T by 2032; North America & Europe lead, APAC growing. |
| Deal Activity |
2024 PE+VC deal value: $639.02 (+24.7% YoY); H1 2025: $386.42 (+18.7% YoY); fewer deals but higher average size; tech & healthcare dominate. |
|
Fundraising |
2024 down 20% YoY; LPs cautious due to long holds & slow distributions; mega-funds still close; GP-leds & SMAs offer alternative capital flow. |
| Dry Powder |
Mid-2025: $2.51T; concentrated in large GPs; drives competition & valuations; uneven by strategy; creative deal structures emerging. |
|
Returns |
Measured in IRR/MOIC, top-quartile managers outperform; longer holds can depress IRR; net returns are impacted by fees; dispersion remains high. |
| Exits |
Exit activity improved in 2024; IPOs, trade sales, sponsor-to-sponsor, GP-led secondaries; median hold 5.8 years; distributions still below LP expectations. |
|
Fees & Economics |
Traditional 2 & 20 under pressure; LPs negotiate lower fees; co-invests often fee-free; carry remains key GP incentive; transparency demands rising. |
| Sectors & Regions |
Tech, healthcare, software lead; consumer, industrials steady; North America dominant; APAC fastest-growing; infra gaining pension interest. |
|
Risks & Outlook |
High rates, valuation pressure, regulatory risk, ESG requirements, private credit growth; cautious optimism if exit markets remain open. |
Evolution of Private Equity
 (Reference: precedenceresearch.com)
- The idea of private-capital ownership goes back over a century of merchant banking deals and private buyouts, predating modern PE firms. (Think J.P. Morgan era).
- Modern private equity as an industry consolidated post-1970s, with early firms focusing on leveraged buyouts and growth capital.
- The 1980s were the LBO decade; the RJR Nabisco buyout became the poster-child LBO and raised public awareness about buyouts.
- The 1980s and 1990s saw an expansion from pure buyouts into turnaround investing, growth equity, and later into infrastructure and private credit.
- The 2000s and 2010s grew the industry through mega-buyouts and expansion into emerging markets.
- The post-2008 era brought institutionalization; more pension funds and sovereign wealth funds allocated to PE.
- Between 2010 to 2021, the industry grew rapidly in AUM and deal activity; 2021 saw record fundraising and deal totals across many private-market categories.
- The COVID period created a short shock, but private markets stayed resilient; dry powder rose as deals slowed temporarily.
- Since 2022, higher interest rates changed the deal math, but deal value recovered in 2024.
- Today, PE is broad: buyouts, growth, venture, infrastructure, secondaries, and private credit all count under private capital umbrellas.
| Point | At a glance |
| Early roots | Merchant banking/J.P. Morgan era |
| Modern start | Post-1970s LBOs |
| Iconic deal | RJR Nabisco – symbol of LBOs. |
| Institutionalization | 2010s onward – large LP mandates |
| Recent shock | Rate rise 2022-2024 changed financing |
Global Market Size and Assets Under Management (AUM)
 (Reference: spglobal.com)
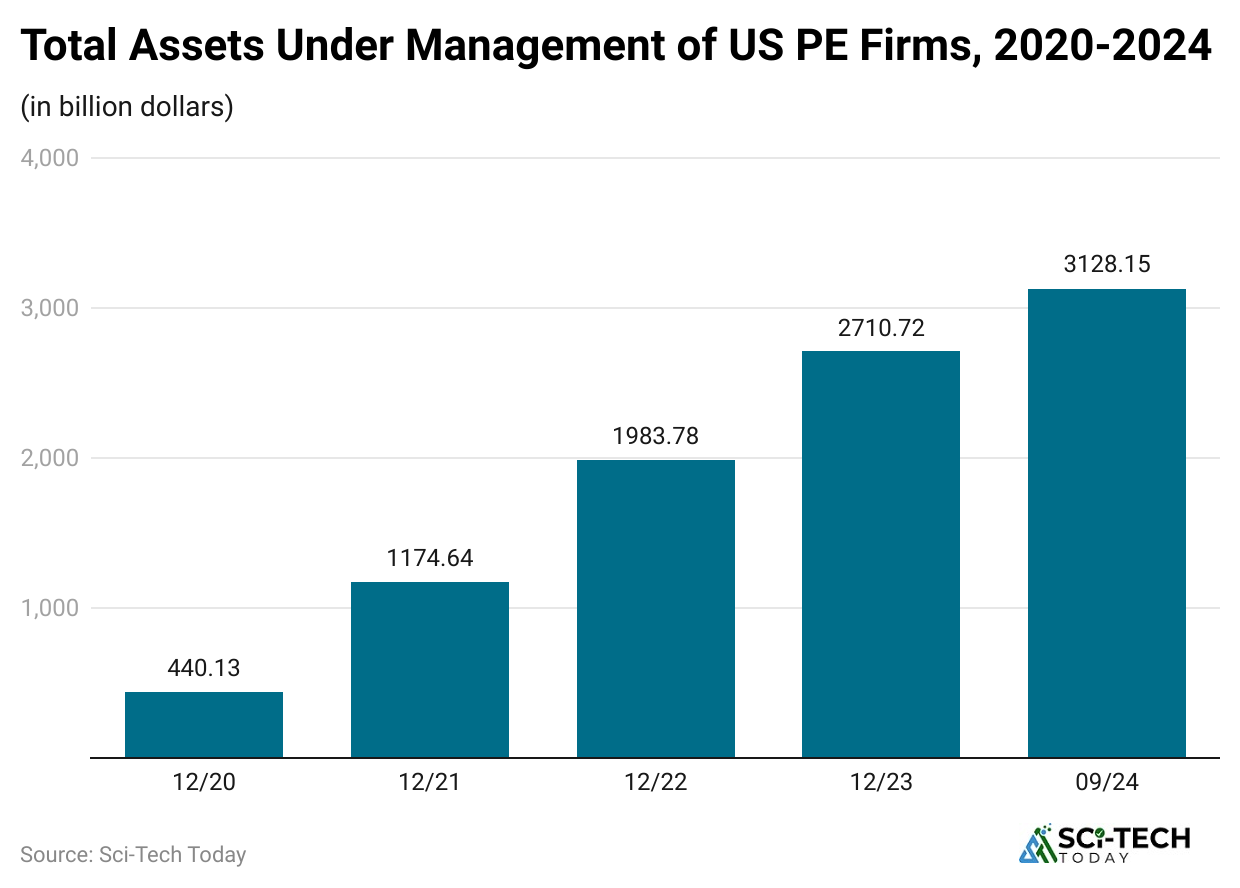
- Measuring AUM depends on definitions: closed-end fund AUM vs total private-market capital, including separate accounts.
- Traditional closed-end PE AUM dipped slightly in 2024 by some measures (around 1 to 2% decline) due to marks and slower distributions.
- Bain projects private-market assets could grow to $60 to $65 trillion by 2032 under current trends. That covers private equity, private credit, infrastructure, real assets, and VC.
- Different data vendors report current PE-only AUM in the low trillions by the closed-end fund measure, while the broader private markets are much larger.
- Growth drivers: higher allocations from pensions, insurance, and wealthy endowments.
- The rise of separately managed accounts and GP-led structures increased available capital outside classic funds.
- The number of dedicated PE funds globally remains large, but fundraising volume varies by vintage year.
- Private credit and other alternatives have become meaningful complements to PE, adding to private market AUM calculations.
- Regional concentration: North America and Europe still host the bulk of AUM, with Asia-Pacific growing fast.
- AUM swings can reflect valuation markdowns or uplifts and holding-period effects more than capital flows in a given year.
| Metric | Snapshot |
| Short-term movement | Closed-end PE AUM modest decline in 2024. |
| Long-term forecast | $60 to $65T private markets by 2032 (Bain). |
| Regional focus | North America, Europe, and the rising APAC |
| Drivers | Institutional allocations, private credit growth |
| Measurement caveat | Definitions vary widely |
Deal Activity- Value, Volume, and Trends
 (Source: fuld.com)
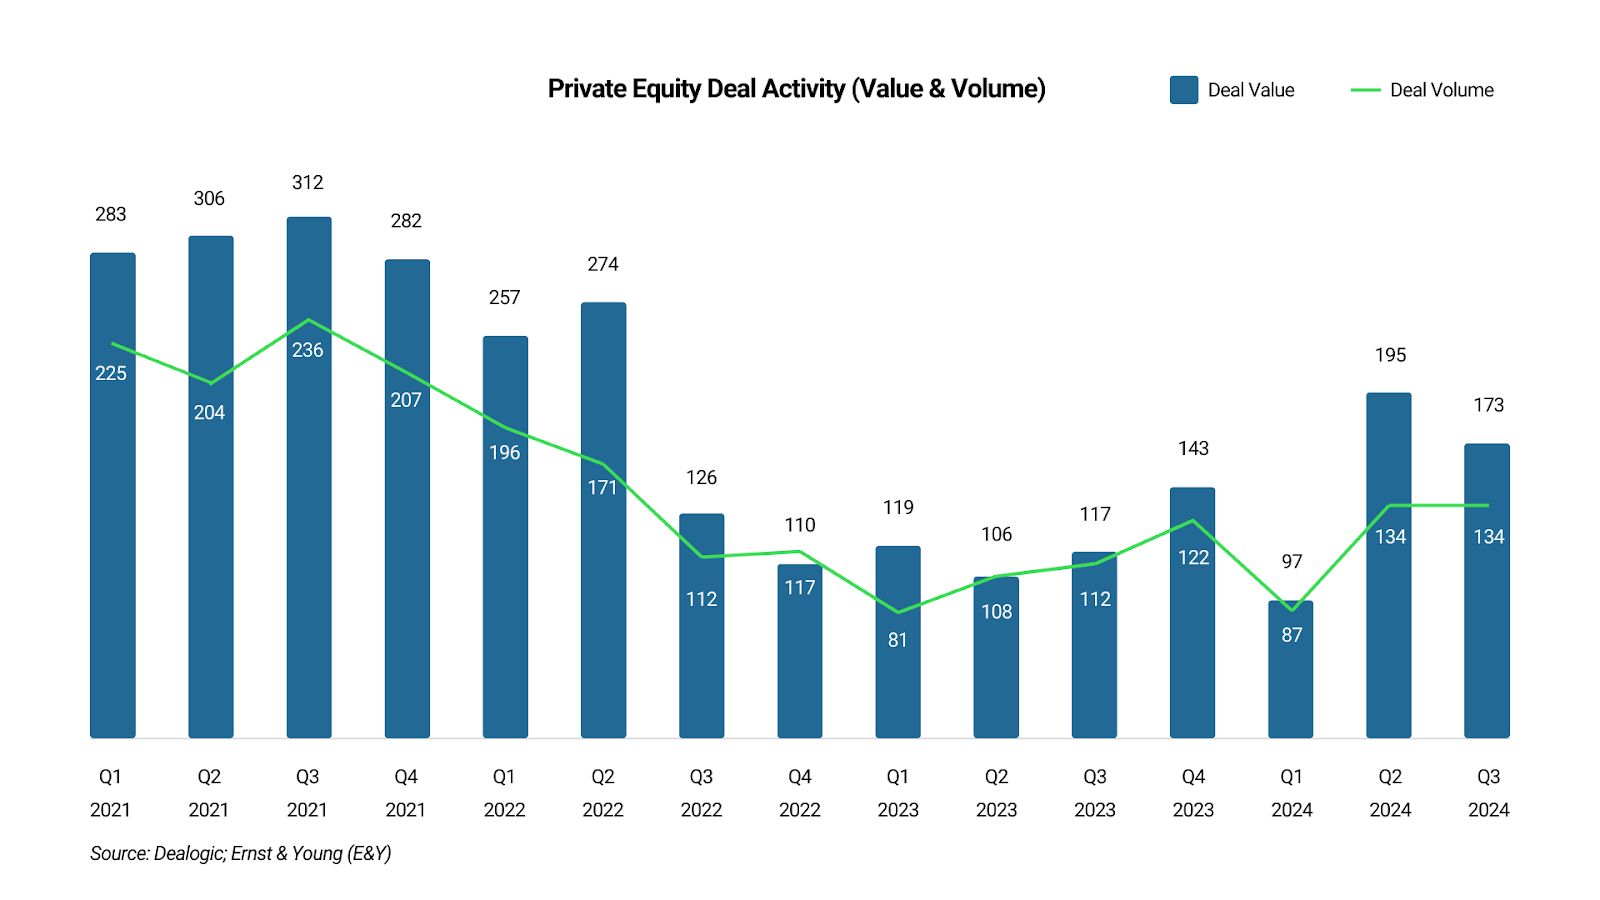
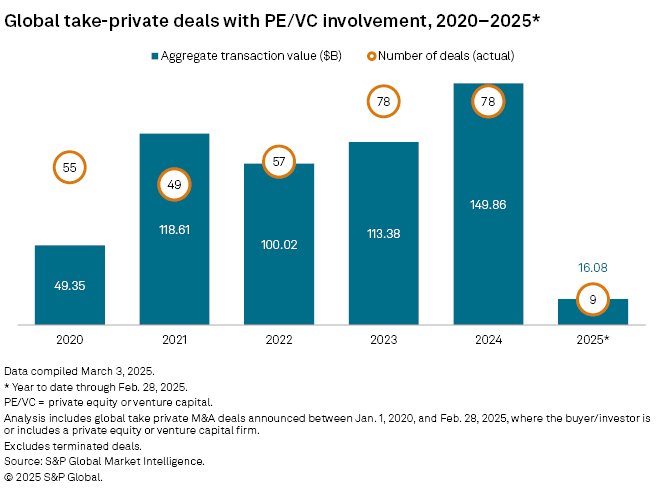
- Total global private equity plus venture deal value in 2024 rose to $639.02 billion, a 24.7% jump from 2023.
- The increase in 2024 was driven by larger deals, even as deal counts remained lower than the pre-2021 highs.
- In H1 2025, aggregate deal value continued to rise, hitting $386.42 billion in H1 2025, an 18.7% increase versus H1 2024.
- Deal volumes (number of transactions) are down from the 2018 to 2021 peak, reflecting more selective dealmaking.
- Buyout deals (largest-ticket) made up a big share of total value growth in recent periods.
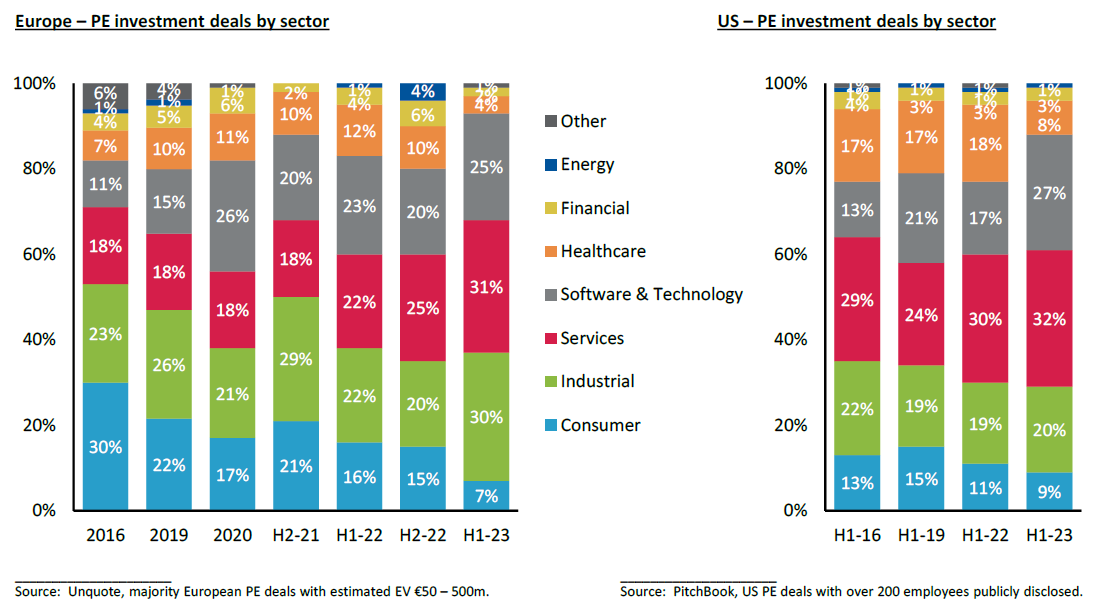
- Sectors: technology, healthcare, and software have been PE favorites, driving deal value.
- Regional patterns: North America leads in deal value, Europe sees carve-outs and strategic sales, and APAC shows selective growth.
- Deal structures changed: more sponsor-to-sponsor sales, carve-outs, and GP-led secondaries.
- Rising interest rates from 2022 to 24 reduced leverage appetite, but private credit and alternative financing partially filled the gap.
- Median holding periods rose through 2023 but showed signs of decline in early 2024 as exits picked up; median exit hold was around 5.8 years in H1 2024.
| Metric | 2024 / 2025 snapshot |
| 2024 deal value | $639.02B (PE + VC). |
| H1 2025 | $386.4, up 18.7% YoY. |
| Volume | Fewer deals, higher average ticket |
| Sectors | Tech, healthcare, software |
| Hold period | Median 5.8 years (H1 2024). |
Fundraising and Investor Flows
 (Source: spglobal.com)
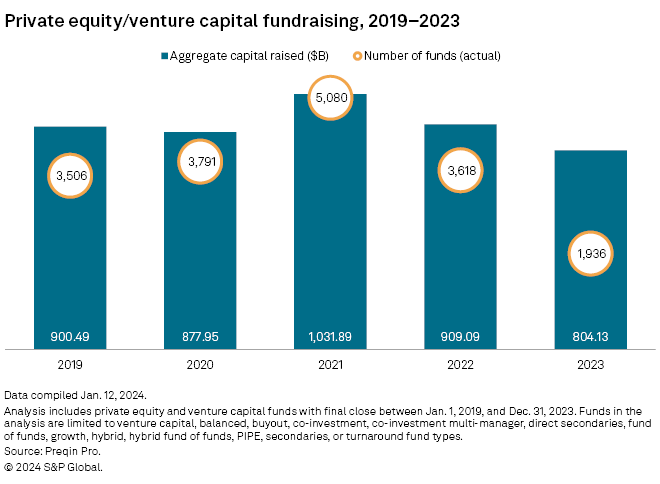
- Global private equity fundraising weakened in 2024, down roughly 20% year-over-year.
- Fund count also fell; LPs tightened new commitments amid longer holding periods and distribution droughts.
- Despite the slowdown, some mega-funds are still closed as large managers continue to attract capital.
- Alternative capital sources increased: separately managed accounts, co-investments, and GP-led structures improved liquidity options for GPs.
- LP sentiment is mixed: cautious on new commitments, but long-term allocation to private markets remains strong in many pension plans.
- Regions differ: North American LPs pulled back more than some Asian sovereign investors who continued to allocate.
- Fundraising cycles were shortened for some strategies and elongated for others (niche strategies found committed capital faster).
- Fee pressure and performance scrutiny pushed some LPs to ask for better economics and transparency.
- 2025 fundraising early reads show stabilization, but recovery depends on exits and distributions improving LP realized returns.
- Secondary market activity and continuation funds provided liquidity exactly when standard exits slowed.
| Metric | Snapshot |
| 2024 fundraising | 20% decline YoY (global PE). |
| Drivers of slowdown | Longer holds, distribution drought |
| Adaptive tools | Separately managed accounts, GP-leds, secondaries |
| LP demand | Cautious, selective |
| Outlook | Stabilize if exits pick up. |
Dry Powder and Capital Deployment
 (Reference: spglobal.com)
- Dry powder is the capital committed but not yet invested by PE firms. It signals the firepower for future deals.
- As of mid-June 2025, dry powder was roughly $2.51 trillion, up from year-end 2024 levels.
- Industry-wide dry powder has oscillated since the 2020 to 2021 fundraising boom; some datasets show declines in particular fund categories in 2024.
- Dry powder concentration: large GPs hold a substantial share, but many mid-sized funds also have meaningful reserves.
- The existence of high dry powder creates pressure to deploy capital – meaning more competition and higher bidding for attractive assets.
- In 2024-25, private credit and alternative lenders helped bridge financing gaps when traditional bank financing was tighter.
- Some LPs worry about capital being deployed at unfavorable prices if competition intensifies.
- Dry powder is uneven by strategy – buyouts, growth, infrastructure, and private credit each have different levels.
- Managers are increasingly deploying creative deal structures and add-on strategies to put capital to work.
- The ability to deploy depends on macro conditions – rates, credit availability, and seller expectations.
| Point | Figure/insight |
| Mid-2025 dry powder | $2.51T. |
| Why it matters | Shows capacity to make deals |
| Risks | Price competition, LP concern |
| Strategy variance | Different across buyout, credit, and infra. |
| Deployment tools | Private credit, GP-leds, secondaries |
Returns and Performance Metrics
 (Source: caia.org)
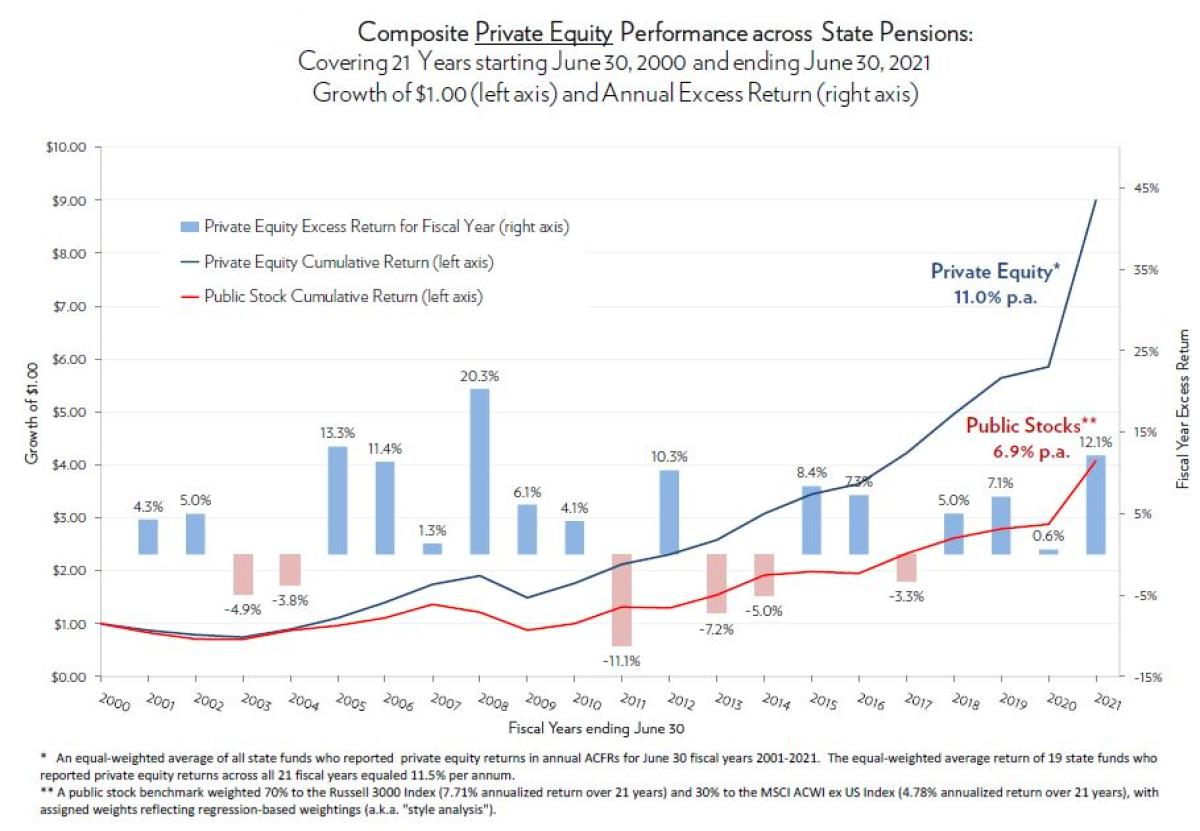
- Private equity returns are typically reported as the Internal Rate of Return (IRR) and the Multiple of Invested Capital (MOIC).
- Long-run PE outperformance vs public markets has been debated; performance depends on vintage years, selection biases, and fees.
- Public-market-equivalent (PME) analysis is common to compare PE returns vs public indices.
- Aggregate returns vary by vintage: 2000s and some 2010s vintages produced strong realized returns, while 2020 to 2021 marked large unrealized gains but also stretched valuations.
- 10-year measurements smooth short-term volatility and are preferred when evaluating vintage performance.
- Fee drag and carry materially affect net returns to LPs. Typical headline gross returns will be meaningfully higher than net returns after fees.
- Secondary market pricing provides some transparency into unrealized value and helps correct perceived valuation gaps.
- Performance dispersion is high: top-quartile managers often far outperform median managers, which is why LPs chase top GPs.
- Recent years of longer hold periods can depress IRR calculations even if MOICs remain attractive, because IRR penalizes time.
- Benchmarks and reporting have improved, but heterogeneity of funds and strategies makes apples-to-apples comparisons hard.
| Metric | Key note |
| Common measures | IRR, MOIC, PME |
| Trend | Vintage-dependent; dispersion high |
| Fee impact | Significant on net returns |
| Hold period effect | Longer holds lower IRR for the same MOIC. |
| Data caveat | Reporting differences across vendors |
Exits- IPOs, Strategic Sales and Secondaries
 (Source: livemint.com)
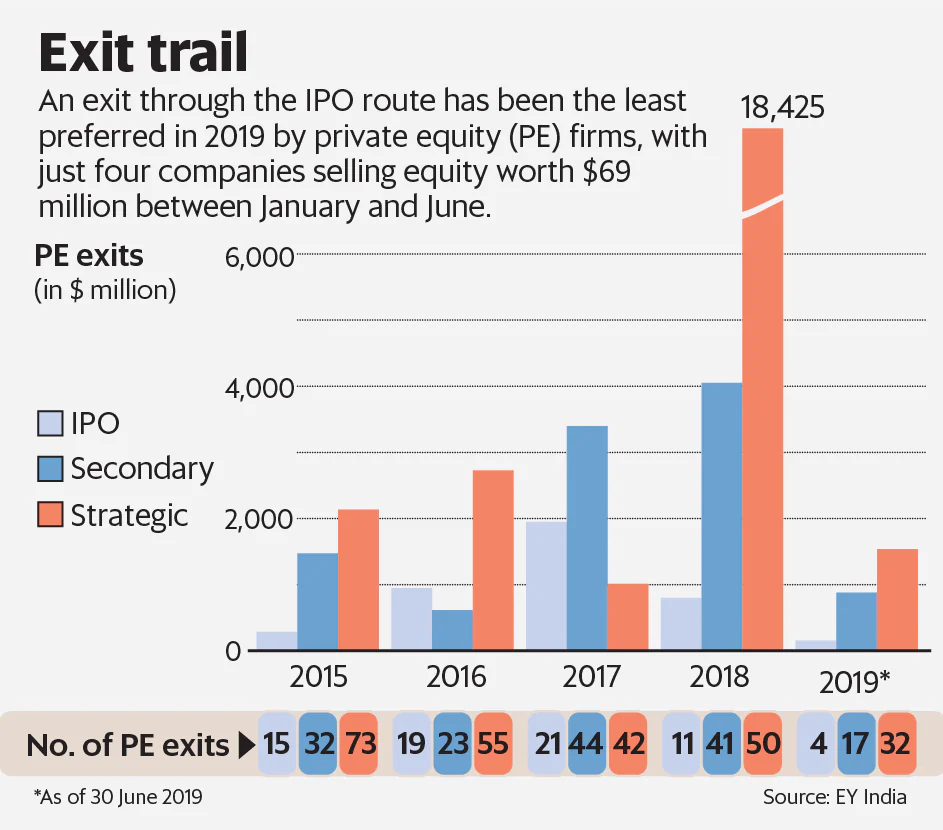
- Exits are how PE realizes gains: IPOs, trade sales to strategic buyers, secondary buyouts (sponsor-to-sponsor), and secondary market sales.
- 2024 saw a recovery in exit value compared with 2022 to 2023 as markets reopened for larger deals.
- IPO windows vary; many managers prefer trade sales for certainty and speed, especially in choppy public markets.
- Secondary buyouts (selling a portfolio company to another PE firm) continue to be a large exit channel.
- GP-led continuation vehicles and structured secondaries have become mainstream exit/liquidity tools.
- Exit timing is influenced by macro conditions, regulatory scrutiny, and sector-specific cycles.
- Distribution rates in recent years have been lower than LP expectations, prompting pressure on managers to return capital.
- Hold periods rose into 2023 but started to decline as exits became more feasible in 2024.
- The health of the M&A market for corporates strongly impacts trade-sale exit opportunities for PE.
- Secondaries and continuation funds can preserve upside while providing some LP liquidity.
| Exit type | Notes |
| IPO | Variable window; better in strong public market periods |
| Trade sale | Most reliable in volatile markets |
| Secondary buyout | Large and common |
| GP-led secondaries | Used to create liquidity/hold upside. |
| Trend | Exit activity improved in 2024. |
Fees, Carry, and Economics
 (Reference: wsj.com)
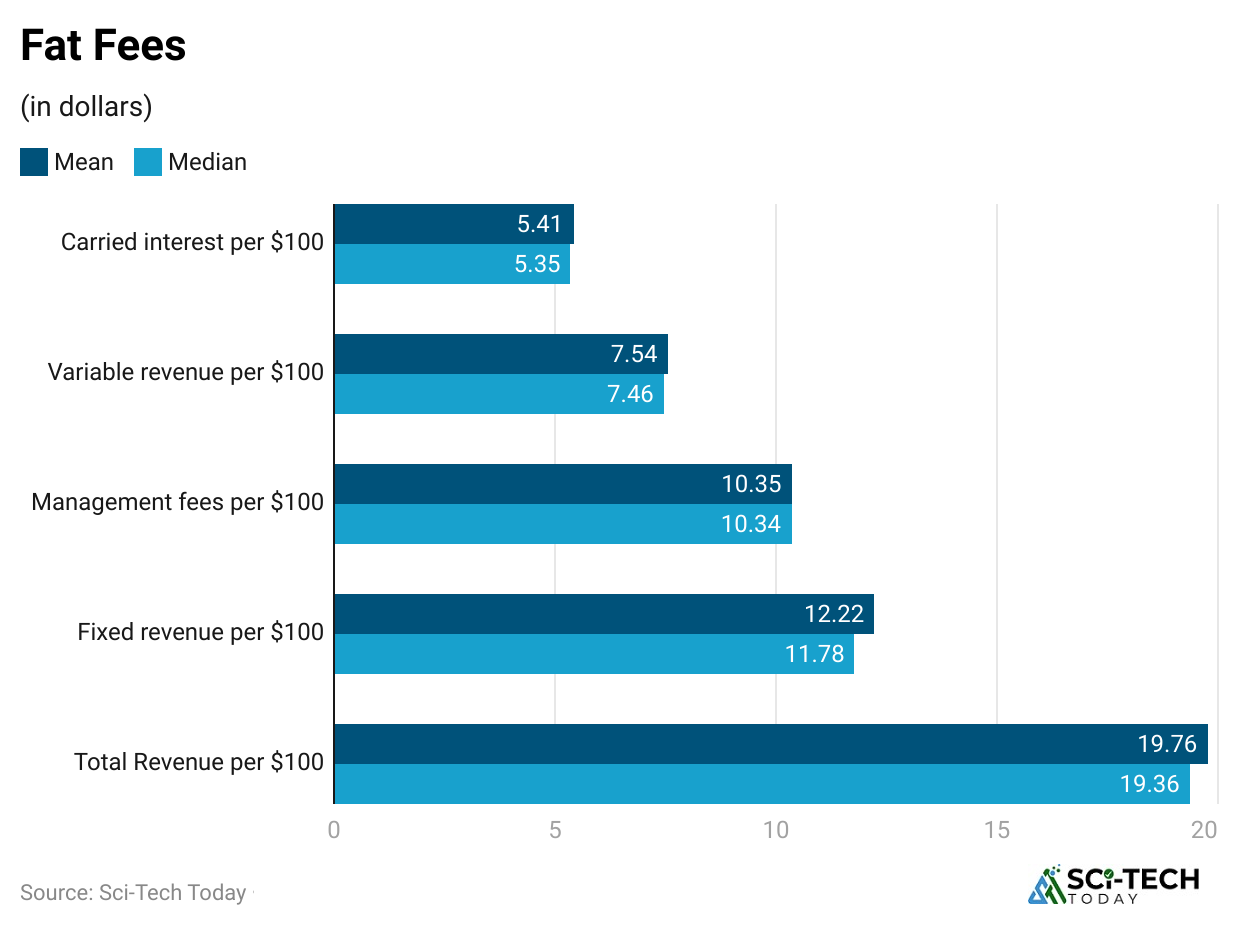
- Typical upper-market headline fees historically were “2 and 20” – 2% management fee and 20% carry, but typical economics vary by fund size and vintage.
- Fee pressure is real: many LPs negotiate lower management fees, hurdle rates, or preferred returns.
- Larger funds often negotiate step-down fee schedules and lower headline management fees as assets grow.
- Carried interest (carry) remains the primary performance incentive for GPs; carry structures and hurdle rates differ.
- Net-of-fees returns are most relevant to LPs and are considerably lower than gross returns.
- GP economics are diversifying: fees from advisory deals, carry, and management fees across fund families increase recurring revenue.
- Co-investments are often offered fee-free or low fee to LPs as an incentive.
- Transparency and reporting are LP priorities; some LPs push for full breakdown reporting.
- Regulatory and tax discussions around carried interest continue in multiple jurisdictions, affecting after-tax economics.
- The fee debate may influence fund selection and LP allocation decisions in the coming years.
| Area | Snapshot |
| Typical headline | Historically 2 and 20, but flexible |
| LP pressure | Lower fees, more transparency. |
| Carry | Main GP upside |
| Co-invests | Low/zero fee benefit for LPs |
| Outlook | Fee renegotiation is likely to continue |
Sector and Regional Allocation Statistics
 (Source: rwbaird.com)
- Sector focus matters: tech, healthcare, and software have produced a large share of deal value recently.
- Consumer, industrials, and financial services still account for steady PE activity, especially for carve-outs and restructuring plays.
- North America leads in value and number of large buyouts; Europe is active in carve-outs; APAC is the fastest-growing region in many categories.
- Infrastructure funds and strategies have attracted big pension allocations given yield needs.
- Private credit and direct lending grew as an allied ecosystem to traditional PE, providing flexible capital to sponsors.
- Region-specific regulatory risk (e.g., national security, data, environmental) affects deal flow and valuations.
- Emerging markets show the highest growth rates but also higher execution risk.
- Sector rotation: as valuations compress in one sector, GPs hunt other verticals offering better return profiles.
- Cross-border deals fluctuate with currency and geopolitical sentiment but remain a large chunk of megadeals.
- LPs often allocate regionally according to local expertise and co-investment appetite.
| Focus | Trend |
| Top sectors | Tech, healthcare, software. |
| Regions | North America leads, APAC growth. |
| Credit role | Private credit fills financing gaps. |
| Infra interest | Rising pension allocations. |
Risks, Regulation, and The Near-Term Outlook
 (Source: spglobal.com)
- Macro risk – interest rates and credit availability directly affect deal economics and valuations.
- Valuation risk – longer hold periods and mark-to-market corrections can pressure AUM metrics and LP satisfaction.
- Regulatory risk – tax and carried-interest reforms, plus scrutiny over industry practices, can change net returns.
- ESG and sustainability rules are shaping deal terms and due diligence requirements.
- Liquidity risk – slow exits and distribution droughts push LPs to demand solutions (secondaries, GP-leds).
- Competition risk – lots of dry powder increases bidding intensity and may compress future returns.
- Operational risk – percentage of value creation comes from operational improvements; managers with ops playbooks tend to win.
- Reputational risk – public scrutiny of PE-owned assets in sensitive sectors matters for future deal approval.
- Technology and data analytics are changing sourcing, diligence, and portfolio management.
- Near-term outlook: cautious optimism if rates ease and exits continue to normalize; otherwise, continued pressure on fundraising and hold periods.
| Risk area | Note |
| Macro & credit | Key driver of deal math. |
| Liquidity | Exit pace critical to LP confidence. |
| Regulatory | Tax, carried interest under watch |
| Tech | Bigger role in sourcing/due diligence |
| Outlook | Recovery is possible if exits/markets improve. |
Conclusion
Looking at these private equity statistics, it’s clear that the industry is still one of the strongest forces in global finance. Deal values are climbing, dry powder is at record highs, and certain sectors like technology and healthcare continue to draw the biggest investments. At the same time, there are signs of change from fee pressure and stricter investor demands to the rise of ESG compliance and private credit as key drivers.
These are not only for analysts or fund managers; they show how capital changes companies, jobs, and even development across the world. Whether you’re tracking trends for investment decisions or just curious about where the big money is going, the data proves that private equity is not slowing down anytime soon. I hope you like this article. If you have any questions, kindly let me know in the comments.
