Introduction
Push Notification Statistics: If you’ve ever had your phone vibrate with a news alert, a flash sale offer, or a reminder that your food delivery is on the way you’ve experienced push notifications you probably knew about it. But what you don’t know is, they’ve become one of the most direct ways for apps and websites to connect with us, slipping right into the palm of our hands in no time. But behind every ping and pop-up lies how effective or ineffective these little messages can be.
I would like to take you through the complete push notification statistics. These stats tell us who clicks, who ignores, and who gets annoyed enough to uninstall an app altogether. From Android’s permission updates that deliver rates, to iOS finally letting Safari send web notifications, to the hard truth about how too many alerts can drive users away, the trends speak volumes.
In this article, we’ll break down the most eye-opening push notification stats with the context they deserve. You’ll see exactly how personalization, timing, and content type can make or break your engagement rates. Let’s get into it.
Editor’s Choice
- Android 13’s runtime permissions update has caused a noticeable 20 to 30% drop in push notification reach for apps that didn’t actively prompt users to allow notifications. This change forced developers to rethink permission onboarding.
- iOS 16.4 introduced Web Push support for Safari, instantly adding over 50 million iPhones to the pool of devices that can now receive push alerts directly from websites, not just apps.
- Opt-in rates vary drastically by industry, with finance apps averaging 5% on Android and 48.7% on iOS, while gaming apps struggle at just 27.8% and 20.6%, respectively.
- The average click-through rate (CTR) for push notifications is 6% on Android and 3.4% on iOS, with Android leading due to more flexible notification handling.
- Personalized notifications can lift CTR to between 4% and 8%, significantly outperforming generic, one-size-fits-all alerts.
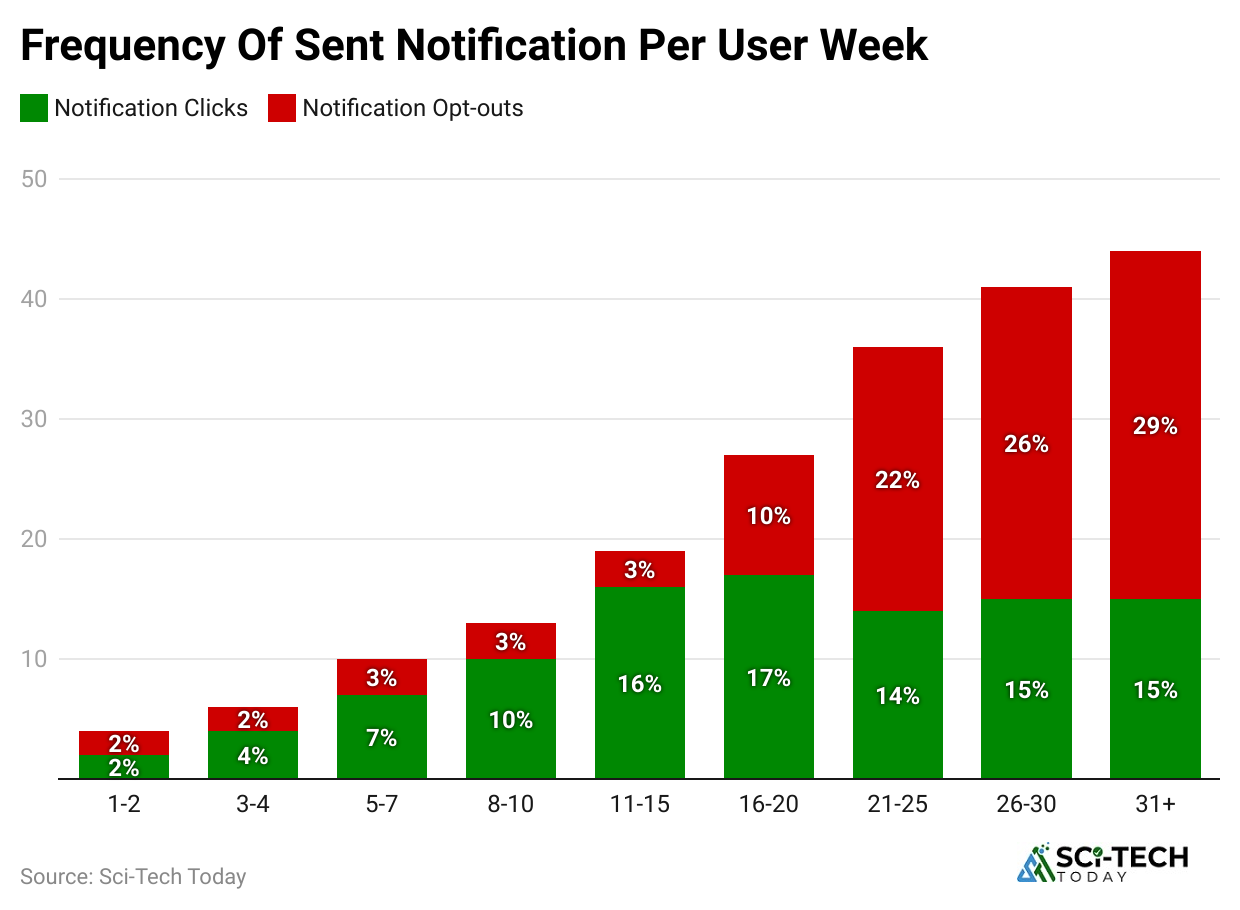
- Sending 2 to 5 push notifications per week increases the risk of 46% of users disabling notifications entirely, showing the importance of frequency control.
- Sending 6 to 10 pushes weekly not only causes notification fatigue but also leads to 32% of users uninstalling the app.
- Adding rich media like images to notifications can improve open rates by 56%, as visuals grab attention more effectively than plain text.
- Personalization efforts like using a user’s name or relevant content have been shown to boost CTR by 15 to 25%, directly improving engagement rates.
- Sending onboarding push notifications within the first week of install can increase conversion rates by 24%, helping apps retain more new users.
- Price-drop alerts are particularly effective, driving 2 to 3× higher CTR and 4 to 5× more revenue compared to standard promotional pushes.
| Statistic / Insight | Data Point / Impact |
| Android 13 runtime permission impact |
-20% to -30% reach for apps without proactive prompts |
|
iOS 16.4 Web Push reach |
+50M devices added to push-capable pool |
| Finance opt-in rate |
49.5% Android, 48.7% iOS |
|
Utilities opt-in rate |
51.5% Android, 51.6% iOS |
| Games opt-in rate |
27.8% Android, 20.6% iOS |
|
Avg CTR Android |
4.6% |
| Avg CTR iOS |
3.4% |
|
Personalization CTR range |
4 to 8% |
| 2 to 5 pushes weekly disable risk |
46% users turn off notifications |
|
6 to 10 pushes weekly uninstall risk |
32% users uninstall apps |
| Images open rate boost |
+56% |
|
Personalization CTR boost |
+15 to 25% |
| Onboarding conversion boost |
+24% |
|
Price-drop alert CTR boost |
2 to 3× higher CTR |
| Price-drop alert revenue boost |
4 to 5× higher revenue |
Evolution and Platform Changes
 (Reference: braze.com)
- iOS introduced Apple Push Notification Service (APNs) in 2009, which revolutionized how mobile alerts could reach users directly, setting the baseline for real-time mobile messaging.
- Android’s journey started with C2DM (2010), evolved through GCM (2013), and now Firebase Cloud Messaging (FCM), which is used by millions of apps globally in 2025.
- Android 13, released in late 2022, made POST_NOTIFICATIONS a required runtime permission; earlier, Android allowed notifications by default. This change slashed unprompted reach by roughly 20-30% on average.
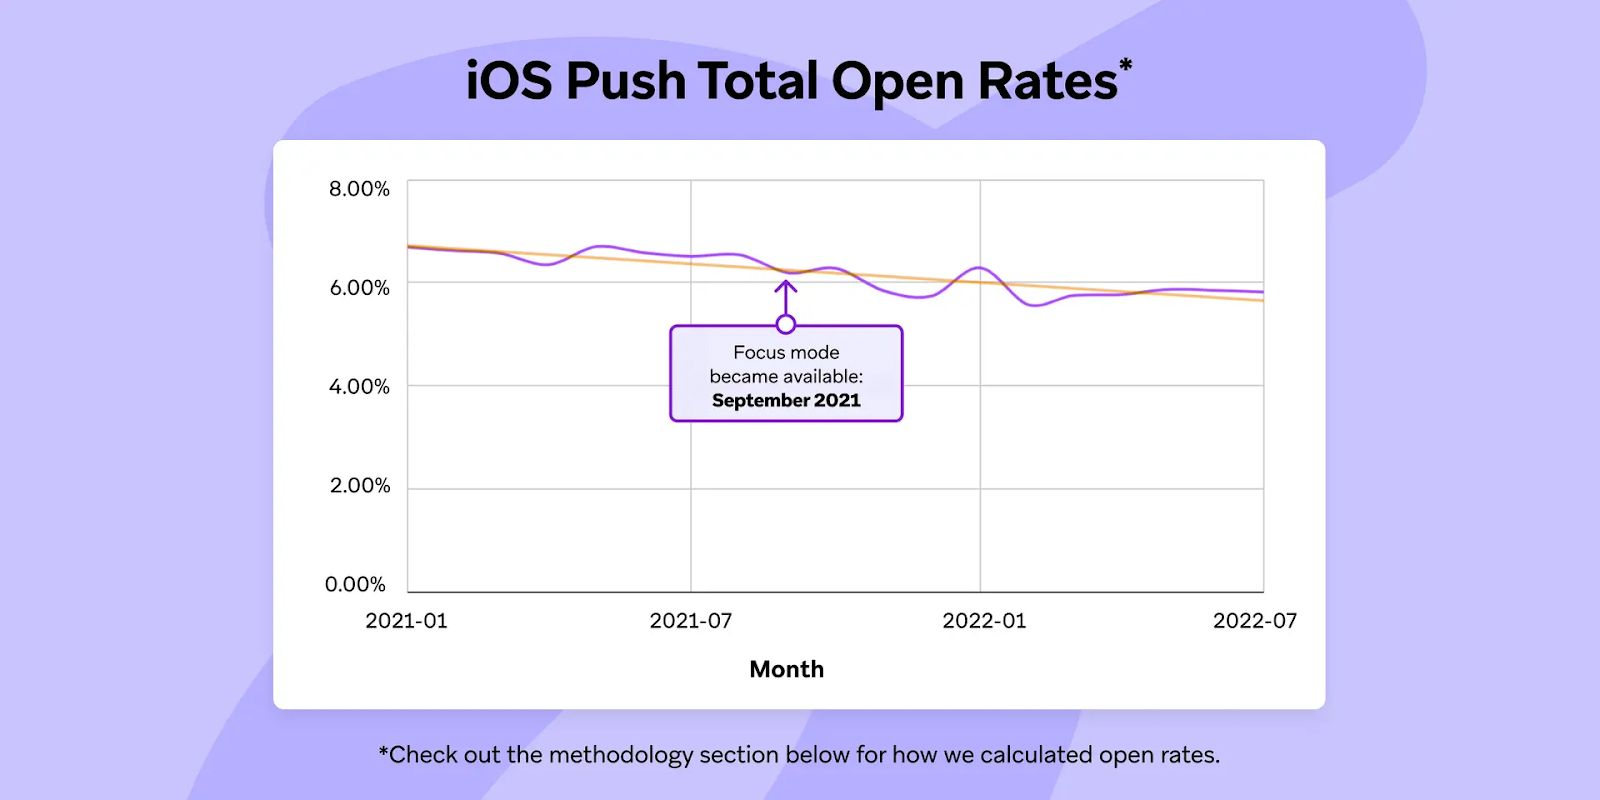
- iOS 16.4 (2023) enabled Web Push in Safari on iOS, letting websites push alerts even without an app; this lifted potential iPhone web-push reach by an estimated 50 million users.
- Rich media (images, buttons) in pushes became widely adopted around 2021 to 2023; studies show push messages with images get 56% higher open rates than text-only.
- Notification Summary and Focus modes on iOS, introduced in iOS 15 (2021), mean that many alerts now get postponed or grouped. Industry data shows delayed engagement up to +40 minutes.
- Android OEM behaviors (like battery optimization on Xiaomi, Samsung) now delay pushes more often; roughly 15-25% of delivered pushes face delay issues according to app-monitoring firms.
- Regulation and privacy (GDPR, ePrivacy) have forced many apps to require explicit consent for behavioral segmentation, trimming effective personalization ability by 10-15%.
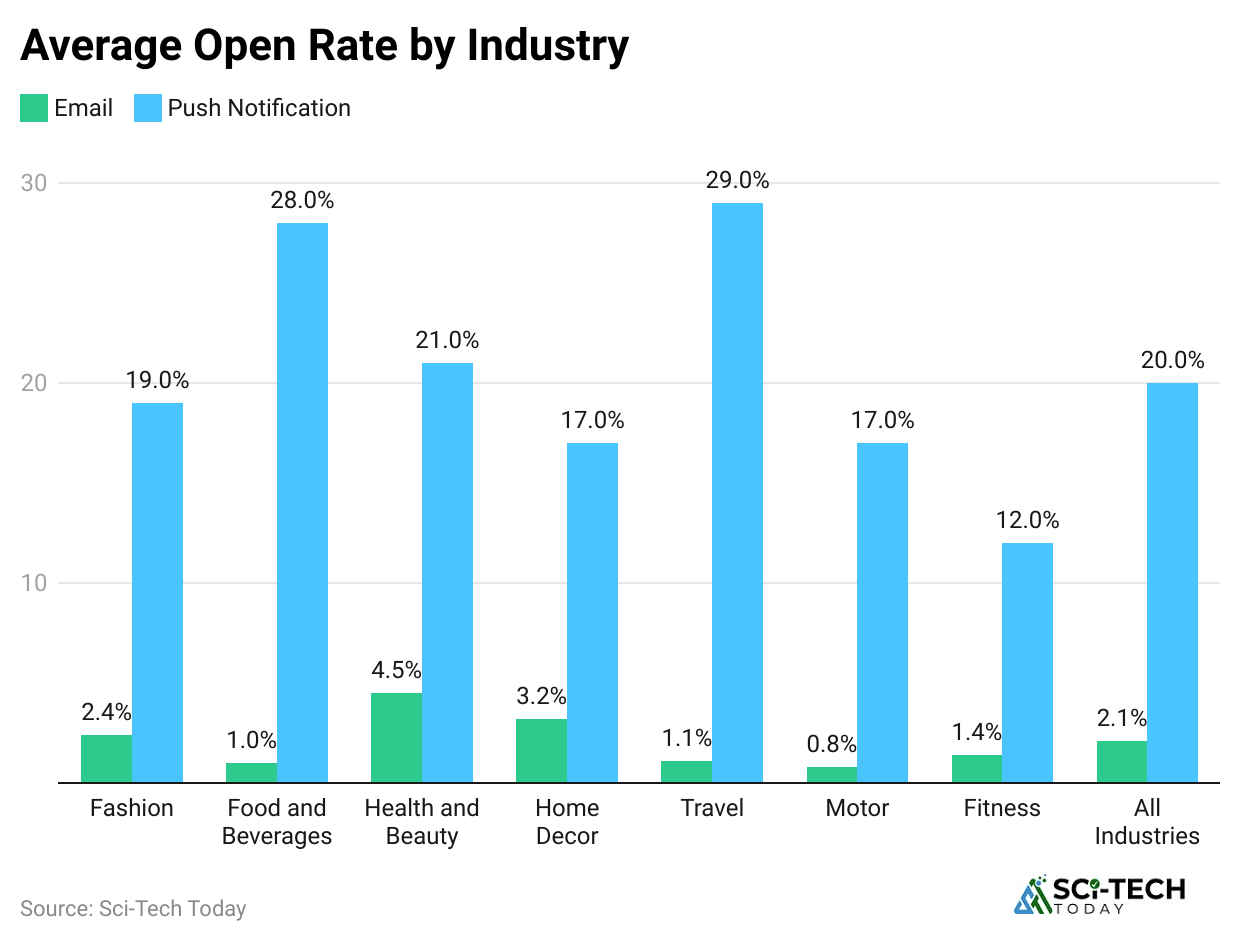
- Behavioral and transactional-triggered pushes now outperform blast campaigns; open rates are about 30% higher, as per multiple platform benchmarks.
- In 2025, best practices emphasize earning the opt-in, using pre-permission prompts, then segmenting with real behavior data that the formula generates significantly better metrics across opt-in, CTR, and retention.
| Evolutionary Change | What It Meant (Numbers) |
| Android 13 runtime permission | Reduced default reach by 20 to 30% |
| iOS 16.4 Web Push support | +50M new potential reach on iPhone web |
| Rich media pushes | +56% open rates vs plain pushes |
Opt-In Rates by Vertical
 (Reference: mobiloud.com)
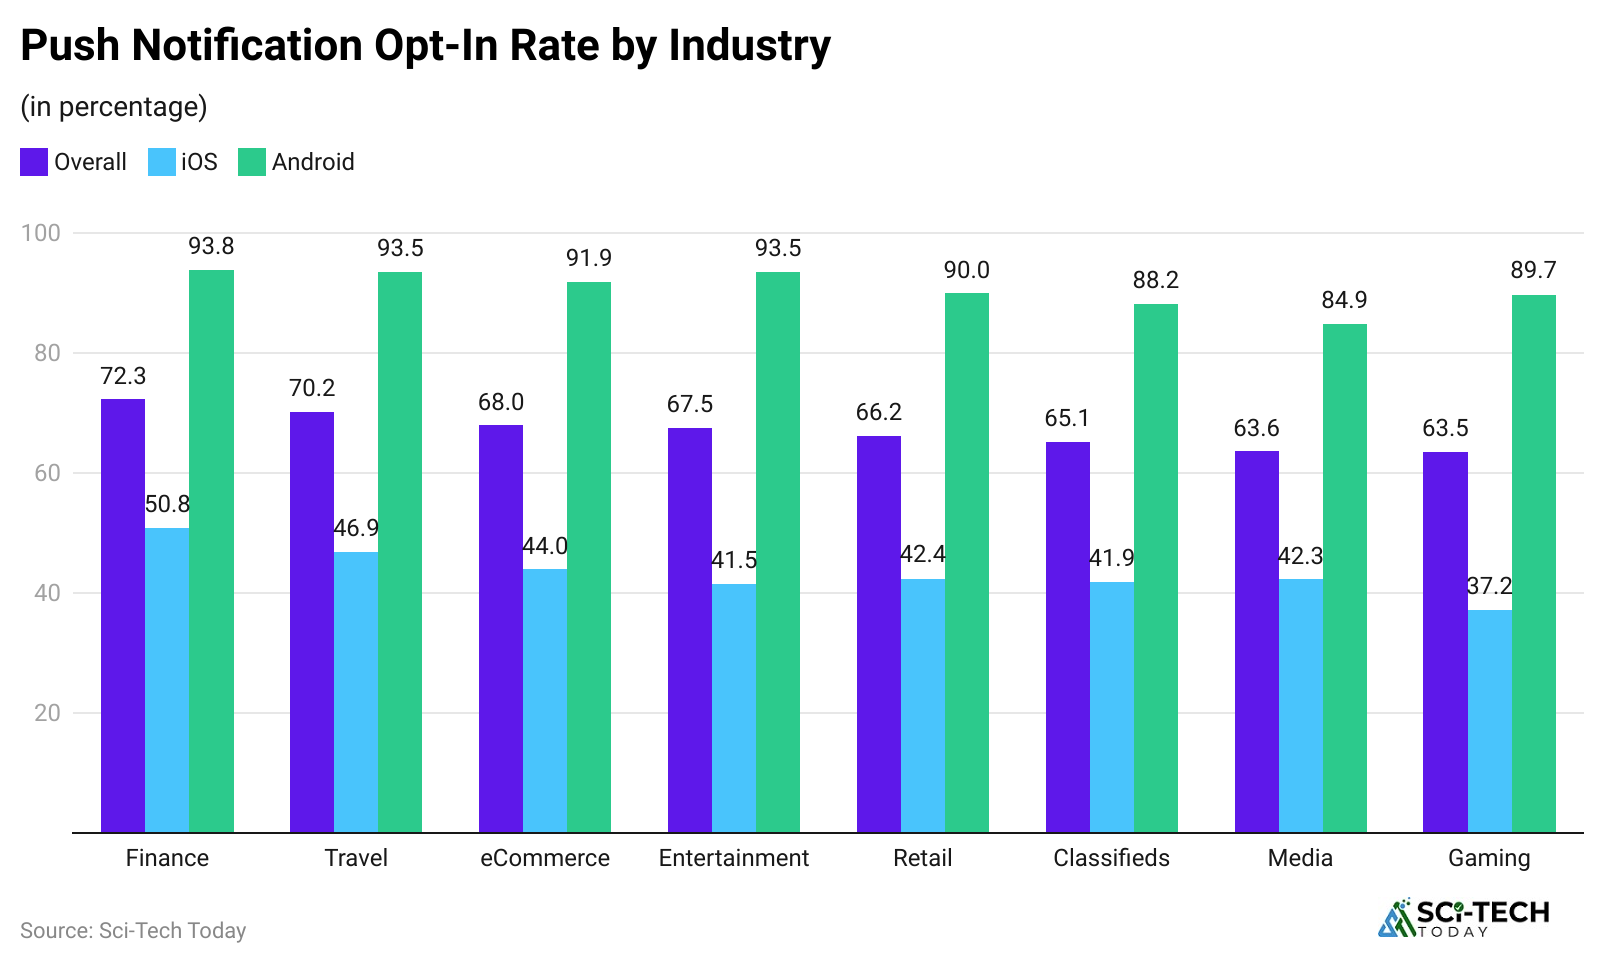
- Finance apps currently average 49.5% opt-in on Android and 48.7% on iOS; these users expect real-time alerts about trades or balances.
- Utility apps (weather, home control) often reach 51.5% Android opt-in and 51.6% iOS, because users see clear value in timely notices.
- Shopping apps see mid-30s numbers around 36.0% Android and 33.2% iOS opt-in hinges heavily on the preview of deals or restocks.
- Games have lower rates: 27.8% opt-in Android, and only 20.6% on iOS. Many players ignore it unless incentivized with rewards.
- Business and productivity tools hover around 56.7% Android and 46.3% iOS. Teams often rely on alerts, so opt-in is higher.
- Productivity apps (to-do, calendars) come around 53.6% Android and 44.8% iOS, because timely reminders are valuable.
- News apps are moderate: 36.7% Android vs 29.8% iOS, but suffer higher opt-out due to content overload.
- Entertainment apps (streaming, events) see 40.3% Android and 27.0% iOS, driven by new release alerts.
- On average, across these verticals, Android opt-in is about 5 to 10 percentage points higher than iOS, but that gap has narrowed since Android 13.
- Pre-permission explainers typically boost opt-in by 15 to 25%, especially in categories like shopping and games, where initial opt-in is low.
| Vertical | Android Opt-in (%) | iOS Opt-in (%) |
| Finance | 49.5% | 48.7% |
| Utilities | 51.5% | 51.6% |
| Shopping | 36.0% | 33.2% |
| Games | 27.8% | 20.6% |
| News | 36.7% | 29.8% |
Engagement and Click-Through Rates (CTR)
 (Source: andrewchen.com)
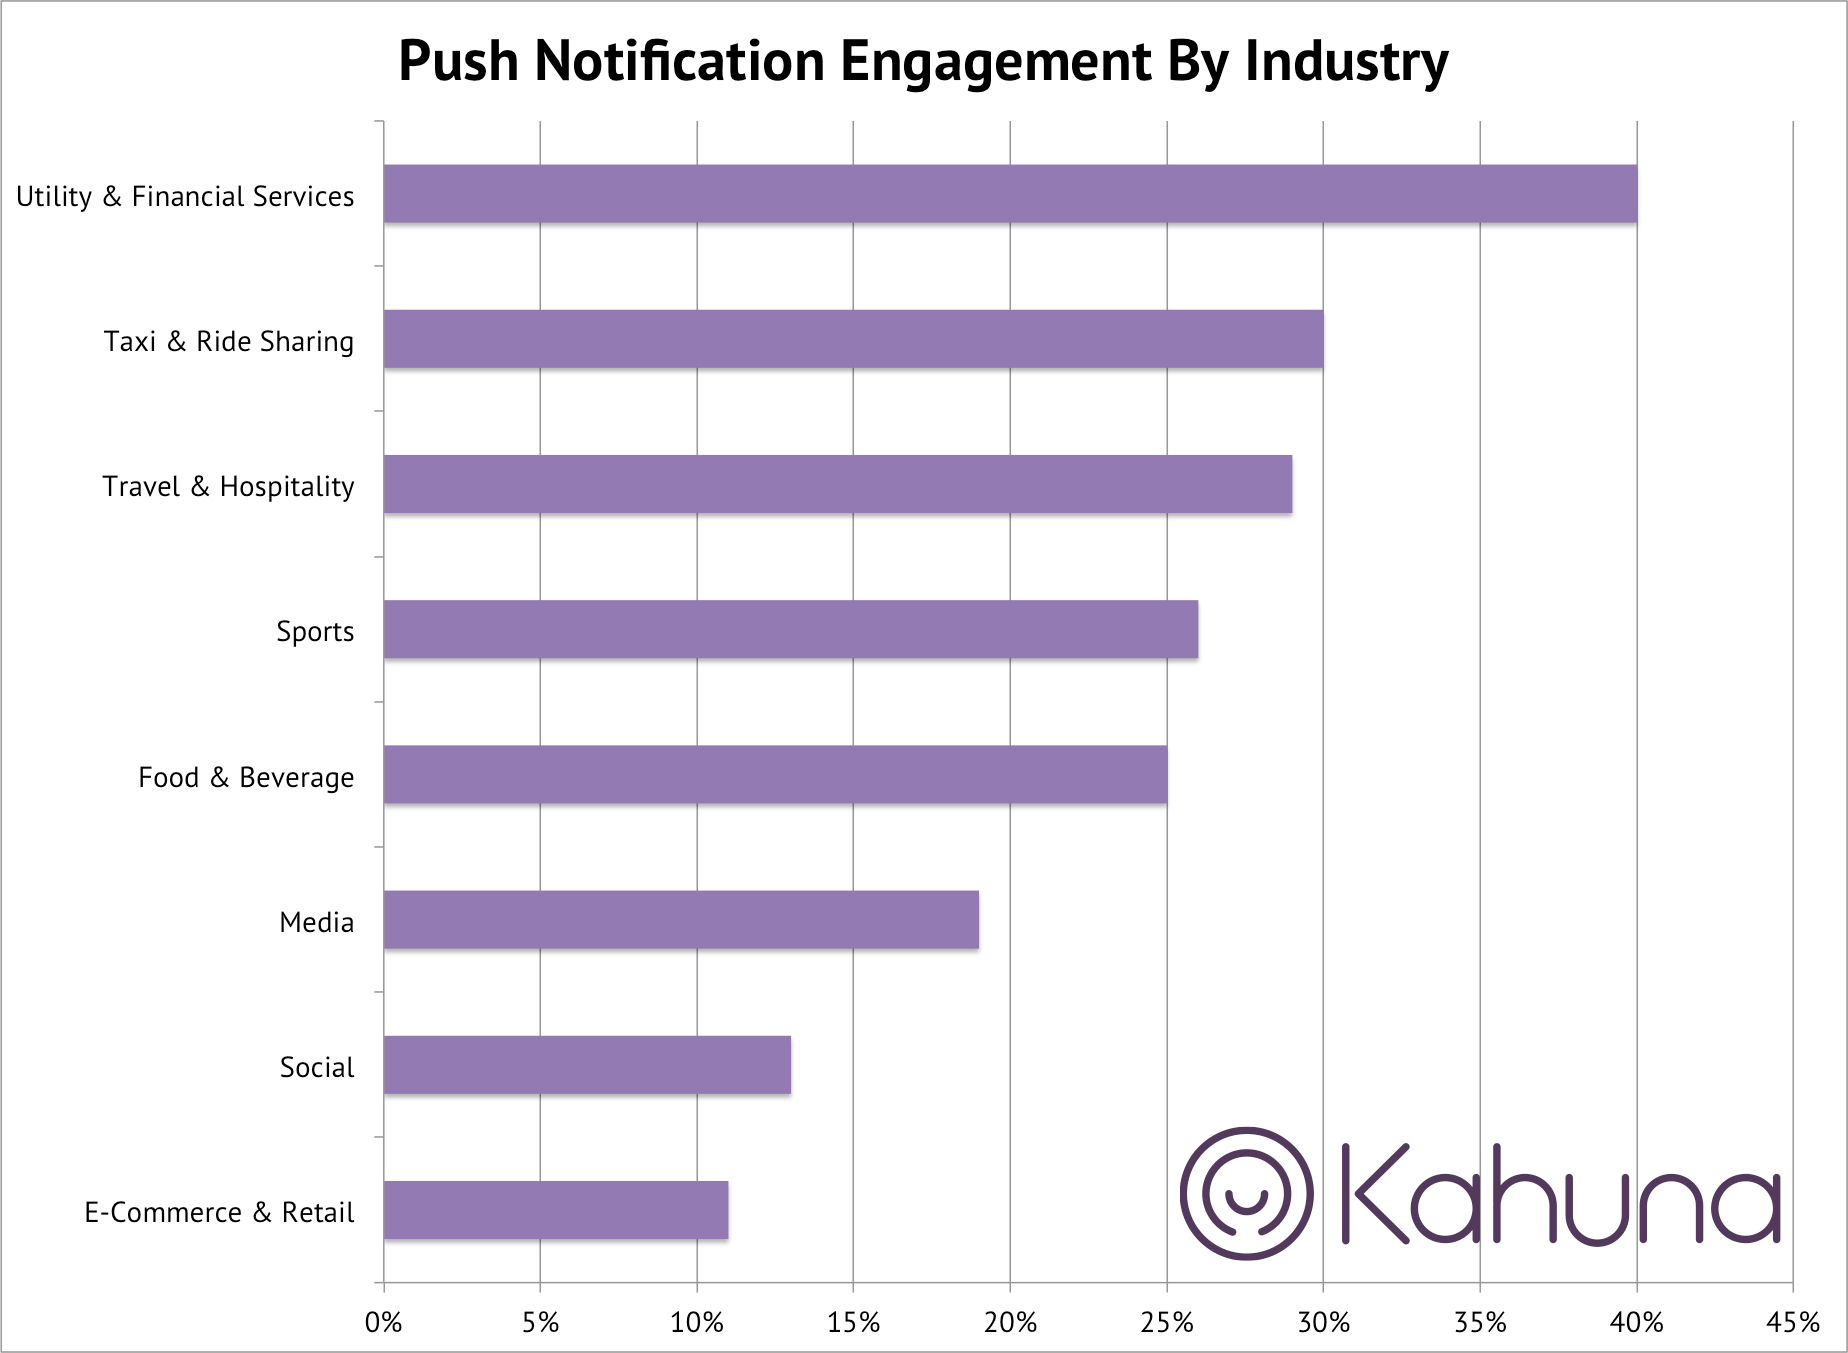
- Overall, Android reaction rate averages 4.6%, while iOS sits around 3.4%, based on large-scale USD app studies.
- Mixed-vertical CTR averages near 2.25%, but high-interest sectors like finance or utilities may exceed 4 to 5% CTR when well-targeted.
- Broadcast campaigns typically land below 2% CTR, while behavioral or event-triggered pushes can exceed 3 to 4% CTR, a solid 50 to 100% boost.
- Onboarding sequence messages (welcome, tips) often hit 4 to 6% CTR, compared to falling back into the 1 to 2% range for standard promos.
- Apps using action buttons (like “Track Order,” “Buy Now”) see CTR lifts of 20-30% against single-action pushes.
- Personalization (name, last-viewed items) increases CTR by 15-25%, especially in retail and commerce verticals.
- Messages delivered at optimal local times can improve performance by 10 to 15% CTR compared to uniform send times.
- Frequency matters: sending more than 5 messages per week reportedly drops CTR by 10 to 20% per additional message.
- Rich media (images) can boost CTR by 56% more opens, but that also translates to higher click potential when context is clear.
- Combining segmentation, personalization, and timing can push CTR into the 5 to 8% range, depending on the vertical and offer.
| Scenario | Typical CTR (%) |
| Android average | 4.6% |
| iOS average | 3.4% |
| Mixed-vertical average | 2.25% |
| Personalized + behavioral | 4 to 8% potential |
Frequency Effects and Opt-Out Risk
 (Reference: dataanalysis.substack.com)
- Localytics found 46% of users would disable push if they get 2 to 5 messages per week; that’s nearly half of your audience.
- 32% of users would stop using the app altogether if they receive 6 to 10 messages weekly; that’s a fast churn path.
- Some cohorts drop off after just one message per week, with a 6% uninstall rate, especially in sensitive verticals.
- CTR declines sharply with oversending; each extra message after 3 a week can cost 5 to 10% CTR points.
- News and gaming apps fatigue fastest engagement dives after 3 to 4 pushes a week.
- Letting users choose topic categories and preferred frequency can reduce opt-outs by 20%.
- Limiting promos to 2 per week and isolating transactional alerts preserves trust and retention.
- Silent hours (no sends between 10 pm to 7 am local time) can cut complaints by 30 to 40%.
- If a user ignores 3 pushes in a row, some apps pause activity automatically, which reduces churn risk by 15%.
- Clear “digest” or “snooze” options reduce friction in apps, and offering a weekly digest lowers opt-outs by 10%.
| Frequency | Risk or Benefit |
| 2 to 5/week | 46% may disable push |
| 6 to 10/week | 32% may abandon the app |
| 3/week | CTR drops 5 to 10% per extra |
| Quiet hours | Complaints down 30 to 40% |
Web vs App Push- Reach and Performance Differences
 (Source: pushpushgo.com)
- Web push CTRs vary widely; some sites report low-teens percentages (10 to 15%) on transactional alerts, others land in low single digits.
- Chrome tends to outperform Safari for opt-in rates and engagement, with Chrome often 1.5 to 2× higher in benchmarks.
- Web push on iOS, possible since iOS 16.4 via home-screen web app, adds millions of reachable users, but only if the user completes adding the site.
- Prompt strategy matters; soft ask (in-page explainer) before system prompt can increase the allowance rate by 30 to 50%.
- Speed matters if the explainer appears after a page load delay of 3s, allowing rate drops by 20%.
- Web push is especially effective for price drop, restock, and content alerts, where CTRs beat email and onsite banners.
- You can’t send silent background notifications on the web, so messages must be timely and high-value, or they get ignored fast.
- Web push on desktop benefits from larger real estate, and click-through often comes with a long dwell time after.
- For B2B SaaS, web push for incident alerts or usage thresholds can drive 20 to 30% immediate engagement.
- Deep links in web pushes should point to specific content or pages; generic homepage links cut conversion by over 50%.
| Channel | Key Numbers |
| Web push CTR (transactional) | 10 to 15% typical |
| Chrome vs Safari opt-in | Chrome 1.5 to 2× better |
| Web push soft-ask increase | +30 to 50% allowance rate |
Lifecycle Impact and Revenue Uplift
 (Reference: mobiloud.com)
- OneSignal reports that apps using onboarding push sequences see 24% higher install-to-purchase conversion and a huge early ROI.
- Retention improves; push-enabled cohorts show up to 20 percentage points better 30-day retention than non-push cohorts.
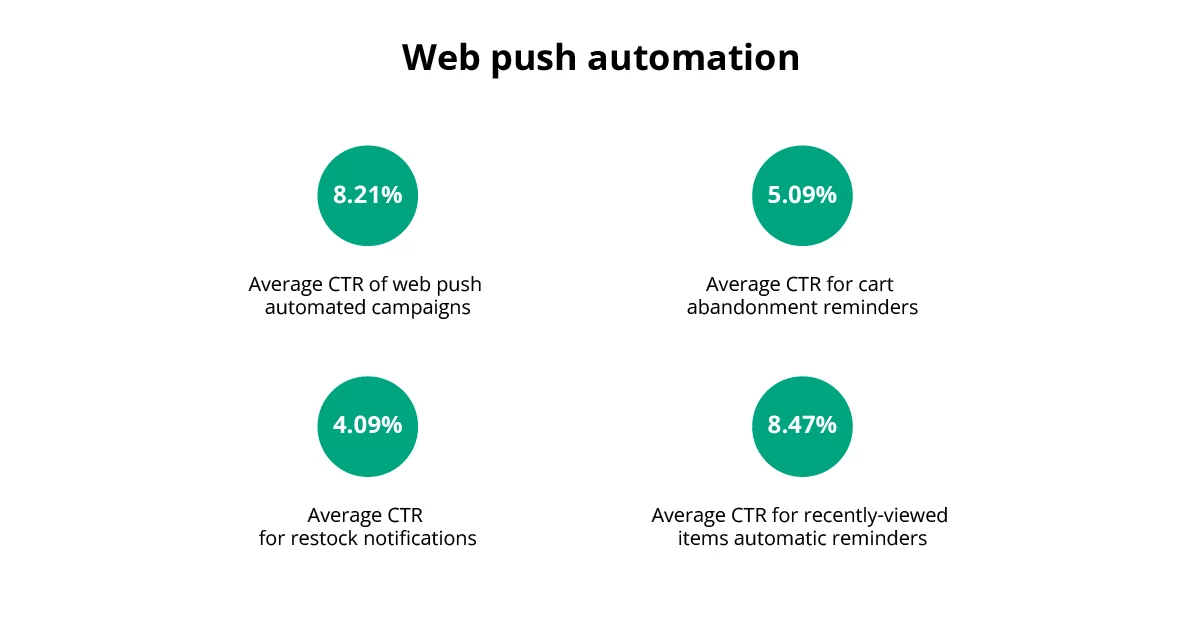
- Cart or browse-abandon pushes drive some of the highest CTRs, often 4 to 6%, sometimes up to 10% when scarcity cues are added.
- Post-purchase updates like shipping or delivery status get very high engagement, often 5 to 8% CTR.
- Price-drop alerts outperform generic promos, CTR often 2 to 3× higher, and revenue per push 4 to 5×.
- Replenishment reminders in CPG can generate repeat purchases within 24 to 48 hours, boosting overall lifetime value.
- Re-activation pushes (for lapsed users) delivered just after a period of inactivity often outperform generic win-backs by 30% on CTR.
- Social-proof pushes (low stock or limited-time) boost taps by 15 to 25%.
- Multi-channel sequences (push + in-app + email) outperform single channel by 20% Lift in conversion rate.
- Deep link quality is pivotal; broken or generic links cut revenue attribution by more than 50% in some cases.
| Lifecycle Event | Impact (CTR / Performance) |
| Onboarding sequence | +24% install-to-purchase |
| Post-purchase updates | 5 to 8% CTR |
| Price-drop alerts | 2 to 3× CTR vs promo; 4 to 5× revenue |
Practical KPI Targets and Final Playbook
 (Source: pk-anexcelexpert.com)
- Set opt-in targets based on your vertical: for shopping, aim for 35 to 40%; for finance or utility, shoot for 45 to 50%.
- CTR aim: start with platform average (Android 4.6%, iOS 3.4%), then refine with segmentation + UX to push toward 5 to 8%.
- Keep promo opt-outs under 0.3% per week; anything above means you’re overdoing it.
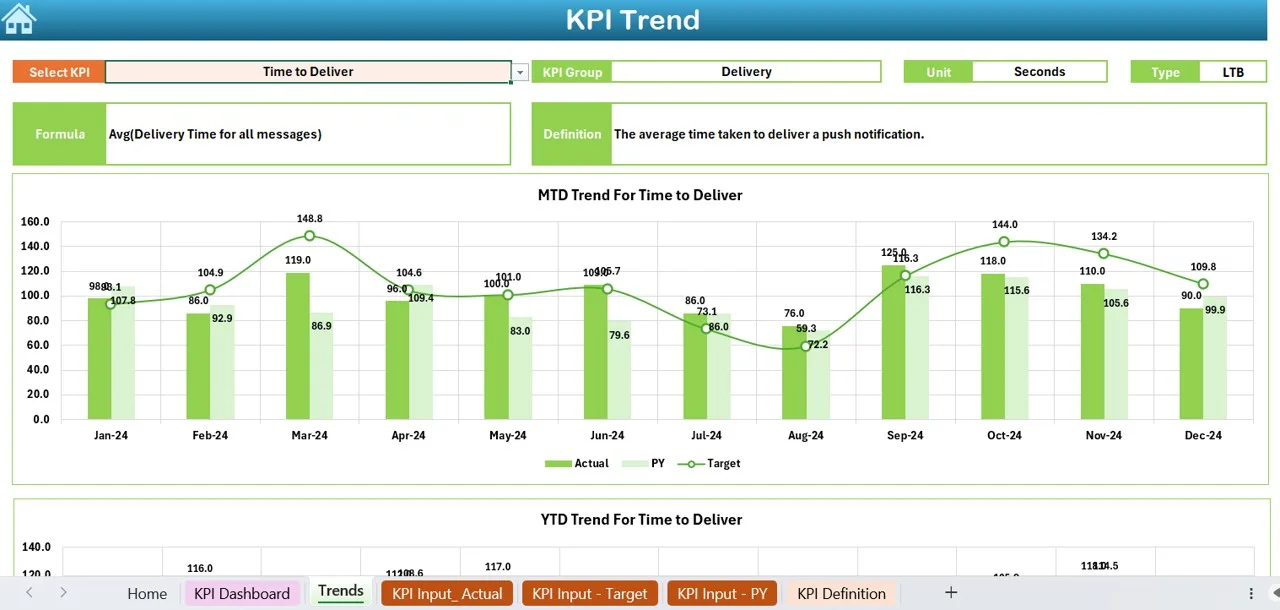
- Time-to-first-push: deliver a meaningful first push within 24 hours of install, ideally tied to helpful content or a feature.
- Quiet-hour coverage: enforce 8 hours of local quiet time, suppressing non-critical alerts.
- Streak suppression: don’t exceed 2 promos/day, 5 promos/week unless the user explicitly opts in for more frequency.
- A/B cadence tests: run new frequency cadences weekly, ship the winner monthly, focus on CTR and opt-out delta.
- Deep link tracking: measure session and conversion from push opens; aim to capture at least 30% of conversions via pushes.
- Re-permission campaigns: if someone disables push, gently re-invite after 2 to 4 weeks with new value or feature messaging. Expect a 10 to 20% re-consent rate.
- Weekly review: track opt-in, CTR, opt-out, delivery, and conversions, and tweak. Small shifts weekly build big improvements.
| KPI | Benchmark/Target |
| Opt-in (shopping) | 35 to 40% |
| Opt-in (finance/utility) | 45 to 50% |
| CTR goal after optimization | 5 to 8% |
| Promo opt-out rate | 0.3% per week |
| Time to first push | 24 hours post-install |
| Quiet hours | 8h local suppression |
| Re-permission rate | 10 to 20% regained |
Conclusion
Push notifications may seem like small alerts, but the statistics prove they carry a big influence. The numbers show that the right message, at the right time, to the right audience can dramatically boost engagement and conversions. At the same time, the data also warns us about the risks of overuse of too many or irrelevant notifications that can drive people away faster than they came.
From the adoption rates across Android and iOS, to the impact of personalization, segmentation, and timing, every stat points out that notifications work best when they’re targeted and respectful of the user’s attention. I hope you like these push notification statistics. If you have any questions, kindly let me know in the comments section. Thanks.
