Introduction
Raven Industries Statistics: When you think of the tech upgrades in agriculture, aerospace, or even defense, Raven Industries might not be the first name that pops into your head, but it probably should be. This company has been impacting major industries since the 1950s, long before precision farming or mainstream tractors became major players in the market.
And what’s fascinating is that Raven didn’t just stick to one lane. From launching high-altitude research balloons for the U.S. Navy to developing driverless automobiles decades later, their story is as layered as it gets.
In this article, I’m not just giving you an overview. I’ve pulled together complete Raven Industries statistics. Whether you’re a nerd, a market analyst, or someone trying to understand how companies like this stay relevant in fast-moving sectors, this breakdown is for you. I’ll cover their origin, growth timeline, financials, acquisitions, product stats, market reach, and even the real impact after their big acquisition by CNH Industrial.
Let’s get into it.
Editor’s Choice
- According to industry sources, Raven Industries was founded in 1956 in Sioux Falls, South Dakota, and initially focused on high-altitude research balloons developed for the U.S. Navy.
- Historical financial records show that Raven saw a steady rise in revenue post-2000s, crossing $400 million in annual revenue before being acquired in 2021.
- Market analysts have observed that Raven’s primary growth came from its Applied Technology Division, which contributed over 45% of total revenue during its peak years.
- Data shows that Raven held more than 100 active patents in the fields of autonomous ag tech, GPS guidance, and precision spraying technologies by 2020.
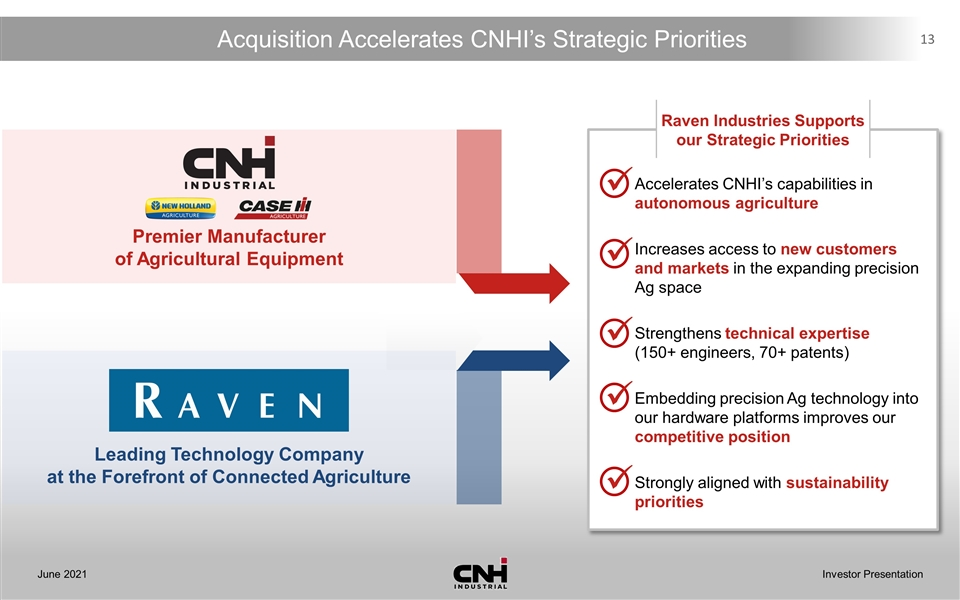
- Reports confirm that CNH Industrial acquired Raven Industries in 2021 for $2.1 billion, aiming to strengthen its agtech portfolio and precision farming offerings.
- According to employment figures, Raven had more than 1,300 employees globally before the acquisition, with a majority based in the U.S. and Canada.
- Production data from multiple years indicates Raven’s manufacturing facilities were producing over 40,000 ag components annually, including GPS units, field computers, and control systems.
- Industry insights reveal that Raven’s Defense and Aerostar divisions accounted for nearly 30% of the company’s revenue before narrowing its focus entirely on agriculture.
- Investment documents suggest Raven had consistently invested 7% to 10% of its annual revenue into R&D, much higher than the industry average for agricultural tech companies.
- Post-acquisition updates show CNH continues to use Raven’s technologies to power its autonomous and precision tractors, combines, and sprayers across global markets.
| Aspect | Details / Figures |
| Founding Year |
1956 |
|
Headquarters |
Sioux Falls, South Dakota, USA |
| Pre-Acquisition Annual Revenue |
$400+ million |
|
Acquisition Amount |
$2.1 billion (by CNH Industrial in 2021) |
| Top Revenue Division |
Applied Technology Division (45%+ of total revenue) |
|
Number of Patents (as of 2020) |
100+ active patents |
| Global Employee Count (2021) |
Over 1,300 |
|
Annual Ag Component Output |
Over 40,000 units |
| R&D Investment Ratio |
7% to 10% of annual revenue |
|
Legacy Business Focus (Pre-2021) |
Agriculture, Defense, Aerospace |
| Key Strategic Shift |
Full focus on precision agriculture post-acquisition |
Raven Industries Origins and Early Years
 (Source: media.cnh.com)
- Raven Industries was founded on February 11, 1956, by four people in Sioux Falls, South Dakota, starting with high‑altitude research balloons for government agencies.
- By the early 1960s, Raven became market leaders in polyethylene stratospheric balloons reaching between 100,000 and 150,000 feet in altitude.
- The company revived modern hot‑air ballooning, supporting record‑setting flights and early unmanned research balloon missions.
- In the 1960s and early 1970s, Raven’s annual balloon production exceeded 200 units, with a manufacturing footprint of around 30,000 sq ft.
- The Aerostar division grew rapidly, serving NASA, the U.S. Navy, Office of Naval Research, and defense clients for high‑altitude systems.
- Plastic film production and sewn products were added later, but the primary focus remained on aerospace and balloons.
- Revenue in this era wasn’t publicly disclosed regularly, but Raven remained a modest organization, employing in the low hundreds.
- Strategic investment in R&D during those years positioned Raven at the intersection of aerospace and agriculture technology.
- Balloon altitude records and civilian hot‑air balloon innovation cemented its niche reputation.
- By 1977, Raven had established capabilities in engineering, manufacturing, and government contracting that shaped future diversification.
| Metric | Value/Descriptor |
| Founding date | February 11, 1956 |
| Founders | 4 individuals |
| Balloon altitude records | 100k to 150k ft |
| Facility size by the early 1970s | 30,000 sq ft |
| Annual balloon production (1980s) | 200 units |
| Early employees | Low hundreds |
| Core market segments | Aerospace, government contracts |
Diversification and Segment Growth
 (Source: mdpi.com)
- In 1978, Raven launched its Applied Technology Division focused on precision agriculture: planting guidance, spraying systems, and farm automation.
- The Engineered Films Division produced polymer films for agriculture, geomembrane, and industrial use.
- Aerostar continued operations in balloons, aerostats, and military/special‑apparel products, with significant defense orders.
- Through the 1980s and 1990s, these three divisions steadily drove company expansion in revenue and employee headcount.
- By the late 1990s, estimated annual revenues reached between US$100 million and US$200 million.
- Employee count across divisions grew to approximately 500 to 1,000 by 2000.
- Acquisition of SBG Innovatie BV (Netherlands/Belgium) expanded European presence and high‑accuracy steering tech.
- Product lines like GNSS guidance and boom control systems began emerging in ATD.
- Aerostar balloon systems supported both commercial and defense applications, including surveillance and research.
- The film business saw revenue peaks, including hurricane‑recovery film sales (e.g. $24 M in 2018), though later declined.
| Division | Focus Area | Approx. 2000 Revenue | Estimated Employees |
| Applied Technology | Precision ag systems | Part of the total | 500 to 1,000 total |
| Engineered Films | Polymer film, geomembrane | Part of the total | |
| Aerostar | Balloons, aerostats, and defense | Part of the total | |
| Consolidated Total | All segments combined | US$100 to 200 M | 500 to 1,000 |
Revenue and Profit Trends
 (Source: openpr.com)
- Annual revenue grew from US $168.1 million in 2005 to US $237.8 million in 2010, then to US $378.2 million in 2015.
- Revenue reached a peak of US $406.7 million in fiscal 2019, up 7.8% from US $377.3 million in 2018.
- Gross margin remained in the 25% to 33% range, with 2019 at 32.6% and 2021 at 33.8%.
- Net income climbed from about US $31.7 million in 2015 to US $41.0 million in 2018, peaking at US $51.8 million in 2019.
- But net income dropped to US $18.9 million in fiscal 2021. Operating income (EBIT) rose from US $43.8 million in 2015 to US $59.5 million in 2018.
- Then fell to US $55.1 million in 2019 and US $19.7 million in 2021. Employee headcount reached approximately 1,290 by 2021.
- Revenue per employee was US $315K in 2015, peaked at US $312K in 2019, and fell to US $270K in 2021.
- Declines in 2021 resulted from divestitures, cost investments, and reduced hurricane film sales.
- R&D investments increased, especially in Applied Technology and Project Atlas initiatives during 2018 to 2019.
| Year | Revenue (US$ M) | Net Income (US$ M) | EBIT (US$ M) | Employees | Rev/Emp (US$K) | Gross Margin (%) |
| 2015 | 378.2 | 31.7 | 43.8 | 1,200 | 315 | 27 |
| 2018 | 377.3 | 41.0 | 59.5 | 1,160 | 326 | 32.2 |
| 2019 | 406.7 | 51.8 | 55.1 | 1,300 | 312 | 32.6 |
| 2021 | 348.4 | 18.9 | 19.7 | 1,290 | 270 | 33.8 |
Division Performance Breakdown
 (Source: sec.gov)
- In fiscal 2019, Applied Technology’s net sales were US $129.7 million, up 4.1% from US $124.7 million in 2018.
- ATD’s operating income rose 24.9% in 2019 to US $39.0 million from US $31.3 million in 2018.
- Engineered Films generated US $226.6 million in net sales in 2019, up 6.2% year‑over‑year despite a hurricane film drop.
- Engineered Films’ operating income declined 16.1% in 2019 to US $39.7 million due to utilization drop and cost overruns.
- Aerostar increased net sales 27.4% in 2019 to US $50.9 million, with strong margins on aerostat and lighter‑than‑air systems.
- Aerostar’s operating income nearly doubled in 2019 to US $8.2 million from US $4.1 million in 2018.
- Engineered Films’ hurricane recovery film sales fell from US $24.2 M (2018) to US $14.5 M (2019).
- ATD growth was supported both domestically and internationally, with domestic up 5.0%, international up 0.9%.
- Aerostar managed growth despite exiting the private client business and wrapping up large contracts.
- Overall division outcomes showed ATD driving quality profit growth, Aerostar strong margin recovery, and Films under pressure.
| Division | Net Sales 2019 (US$ M) | YoY Growth (%) | Operating Income (US $M) | YoY Change |
| ATD | 129.7 | +4.1 | 39.0 | +24.9 |
| Engineered Films | 226.6 | +6.2 | 39.7 | −16.1 |
| Aerostar | 50.9 | +27.4 | 8.2 | +98.4 |
Acquisition by CNH Industrial
 (Source: nasdaq.com)
- CNH offered US $58 per share in June 2021, valuing Raven at approximately US $2.1 billion (33.6% premium).
- The transaction closed in Q4 2021, and Raven ceased being publicly traded, becoming a full CNH subsidiary.
- Raven’s trailing-12-month revenue to Jan 2021 was US $348.4 million; CNH had annual revenue of approximately US $26 billion for context.
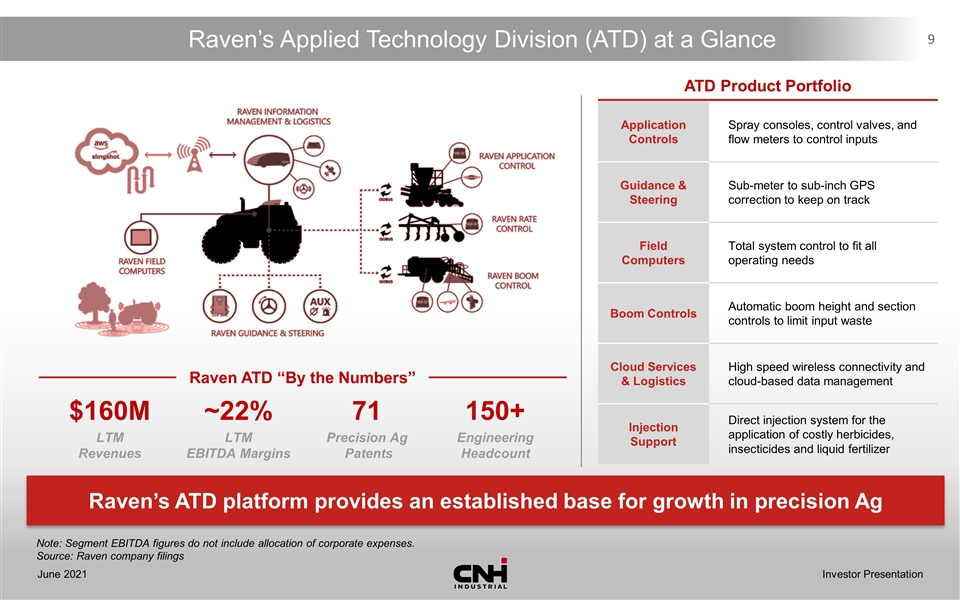
- At acquisition, ATD contributed US $160 million in revenue (46%), Engineered Films US $163 million (47%), Aerostar US $51 million (15%).
- CNH expected synergies of US $400 million in incremental revenue and US $150 million in EBITDA by 2025.
- CNH had already been Raven’s largest ATD customer, accounting for 30% of Applied Technology’s income.
- The deal aligned Raven’s autonomy tech to the OEM pipeline of Case IH and New Holland equipment.
- Raven’s patents (71 in precision ag) became fully integrated into CNH’s R&D.
- Post‑deal plan included accelerating global expansion, especially in Latin America and Europe.
- CNH retained ATD and divested the lower-margin divisions to sharpen focus on precision agriculture.
| Metric | Value |
| Acquisition price per share | US$58 |
| Estimated enterprise value | US $2.1 billion |
| Raven trailing‑12‑mo revenue | US $348.4 million (to Jan 2021) |
| ATD revenue share | US $160 million (46%) |
| Engineered Films revenue | US $163 million (47%) |
| Aerostar revenue | US $51 million (15%) |
| Projected revenue synergies | US $400 million by 2025 |
| Projected incremental EBITDA | US $150 million by 2025 |
Post‑Acquisition Divestitures and Focus Shift
 (Reference: farm-equipment.com)
- In April 2022, CNH sold the Engineered Films Division for US $350 million to a private equity firm.
- Aerostar was spun off separately, eventually acquired by TCOM Holdings, focusing on ISR and aerostat operations.
- Raven refocused entirely on Applied Technology within CNH brands, integrating autonomy products into OEM machinery.
- The company expanded its Innovation Campus with a 48‑acre site near Sioux Falls for R&D and manufacturing.
- Raven Precision Agriculture Center opened at South Dakota State University in the fall of 2021 to train talent and share research.
- Job creation continued in Sioux Falls, especially in autonomy and cyber operations in partnership with local universities.
- Rationalization of operations removed lower‑margin film and balloon operations, raising overall margins.
- ATD now forms Raven’s sole business unit under CNH, with a clear strategic and financial focus.
- The shift enabled more capital and engineering talent to be devoted to autonomy, guidance, and software innovation.
- The restructuring aligned Raven’s operational metrics with high-margin precision ag targets.
| Change | Detail | Financial/Strategic Impact |
| Engineered Films sold | April 2022, for US $350 M | Divested non‑core business |
| Aerostar spun off | Sold to TCOM Holdings | Business narrowed to ATD |
| Innovation Campus expansion | 48 acres near Sioux Falls | R&D & manufacturing growth |
| Precision Ag Center launched | SDSU partnership fall 2021 | Talent pipeline & research focus |
| Strategic focus shift | Sole focus on the ATD division | Higher margins, clearer branding |
Financial Projections and Trajectory
 (Source: sec.gov)
- Revenue forecasts project US $438.8 M in 2022, US $508.8 M in 2023, US $546.8 M in 2024, and US $573.7 M in 2025, a 4.9% increase from the previous year.
- Gross margins are expected to decline gradually from 33.8% in 2021 to 26.9% in 2022 and 20.5% by 2025.
- Net income is projected to rise from US $18.9 M in 2021 to approximately US $29.4 M in 2022, US $51.6 M in 2023, US $57.3 M in 2024, and US $80.5 M in 2025.
- EBIT specifics beyond 2021 aren’t publicly broken out, but operating leverage is expected to improve from divestiture efficiencies.
- Revenue per employee shoots up as headcount declines; with an estimated 2025 headcount of 779, revenue per employee would be US $737K.
- Driving force includes the global scaling of autonomy platforms embedded across CNH equipment.
- Synergy targets of US $400 M incremental revenue and US $150 M EBITDA appear on track under projections.
- Strategic revenue mix is increasingly weighted toward high-margin ATD solutions rather than commodity films.
- By 2025, Raven’s revenue share within the CNH portfolio positions it as a significant high-tech division.
- Future growth is expected to be led by OEM partnerships, software-as-a-service models, and hardware‑embedded precision systems.
| Year | Revenue (US$ M) | Net Income (US$ M) | Gross Margin (%) | Est. Employees | Rev/Emp (US$K) |
| 2022 | 438.8 | 29.4 | 26.9 | to | to |
| 2023 | 508.8 | 51.6 | 23.2 | to | to |
| 2024 | 546.8 | 57.3 | 21.5 | to | to |
| 2025 | 573.7 | 80.5 | 20.5 | 779 | 737 |
Innovation and Intellectual Property
 (Source: sec.gov)
- Raven’s ATD owns around 71 precision agriculture patents, covering steering systems, guidance algorithms, and autonomous vehicle control.
- The engineering and R&D workforce in ATD totals over 150 specialists focused on software, hardware, and integration projects.
- Core product lines include OMNiDRIVE, OMNiPOWER, CR displays (CR7+, Viper® 4+), Slingshot connectivity, and AccuFlow application control.
- Raven Autonomy is a major initiative launching a driverless tractor and implementing cart automation platforms integrated with OEM equipment.
- In Q1 2022, ATD net sales rose 30.6% Y‑o‑Y to US $54.9 M, with operating income of US $13.2 M (+47.5%).
- R&D expenses in Q1 2022 included US $4.6 M investment in Raven Autonomy efforts.
- Applied division continues international expansion, significant growth anticipated in Europe and Latin America.
- Raven continues collaborating with universities like SDSU and Dakota State University for cybersecurity and talent development.
- ATD innovation drives sustainability, precise spraying, and resource optimization, reducing environmental impact.
- Autonomous livestock tracking, planting, and harvesting are under active development for future product lines.
| Area | Metric/Focus |
| Precision ag patents | 71 patents |
| ATD engineers | 150 specialists |
| Core platforms/products | Autonomy, steering, displays, connectivity |
| Q1 2022 ATD net sales | US $54.9 M (+30.6% Y‑o‑Y) |
| Q1 2022 ATD operating income | US $13.2 M (+47.5% Y‑o‑Y) |
| R&D investment (Q1 2022) | US$4.6 M on autonomy |
Geographic and Customer Footprint
 (Source: shortpixel.ai)
- As of around 2019 to 2020, total revenue amounted to US$394 M, with approximately 76.8% coming from the U.S. 11.6% foreign operations.
- Canada contributed US $13.0 M (3.3%), Europe US $15.9 M (4.0%), Latin America US $6.7 M (1.7%), and Asia US $5.17 M (1.3%).
- CNH represented about 30% of ATD revenue, making Raven’s tech deeply embedded in OEM channels.
- Applied Technology has customers beyond CNH AGCO and aftermarket channels across North America and Europe.
- International expansion plans intensified post-acquisition, leveraging CNH dealer networks across six continents.
- Current presence spans North America, Europe, Latin America, and Asia, even with a smaller footprint in emerging markets.
- Aerostar and Films divisions had historically served global industrial and defense markets, now divested.
- Growth in Europe in early 2022 drove ATD sales with new OEM contracts and dealer relationships.
- Raven’s guidance and autonomy technologies are now shipped embedded on CNH brand machinery sold globally.
- Ongoing OEM integration reduces complexity and widens Raven’s reach through established global equipment channels.
| Region | Revenue Share (%) | Approx. US $M |
| United States | 76.8 | US$302.6 M |
| Canada | 3.3 | US$13.0 M |
| Europe | 4.0 | US$15.9 M |
| Latin America | 1.7 | US$6.7 M |
| Asia + other | 2.6 | US$10.1 M |
| International total | 23.2 | US$91.4 M |
Competitive Positioning and Strategic Outlook
 (Source: openpr.com)
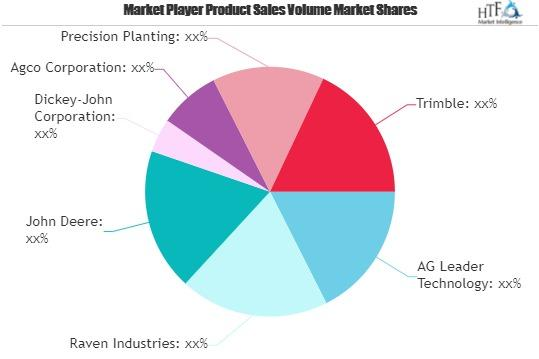
- Raven’s key competitors include John Deere, AG Leader, Trimble, and AGCO, especially in precision agriculture and guidance systems.
- Within CNH, Raven Tech is positioned as a premium integrated offering across Case IH and New Holland equipment.
- The acquisition gave CNH deeper autonomy capabilities and strengthened its position versus Deere’s Blue River and Trimble Autopilot.
- Raven’s patent portfolio and R&D investments offer a competitive moat around autonomous guidance and spraying tech.
- Synergies from embedding Raven systems onto OEM platforms create scale advantages versus standalone third-party products.
- Forecasted 2025 revenue and EBITDA synergy targets (US$400 M incremental, US$150 M EBITDA) suggest accelerating traction.
- Wider trend toward ESG and efficient farming increases demand for Raven’s precise input controls and autonomous systems.
- With a leaner structure post-divestiture, margins are expected to improve, giving Raven a competitive edge in ROI per employee.
- Raven’s ecosystem sensors, displays, connectivity, and cloud dispatch position it uniquely as a systems integrator rather than a component supplier.
- As global ag digitization accelerates, Raven within CNH is set to play a central role in smart farming deployment worldwide.
| Strategic Aspect | Competitive Edge |
| Patent & R&D strength |
71 patents, high-tech guidance systems |
|
OEM Integration advantage |
Embedded systems across CNH brands |
| Projected synergies by 2025 |
US$400 M revenue boost, US$150 M EBITDA |
|
Competitors |
Deere, Trimble, AGCO, AG Leader |
| Margin potential |
Higher post‑divestiture efficiency |
Conclusion
Raven Industries may not always be front and center in tech conversations, but the statistics clearly show a company that’s consistently pushed the limits of inventions. From launching research balloons in the 1950s to leading precision agriculture today, they never underplayed themselves.
This deep dive into Raven Industries’ Statistics highlights how a company can stay relevant across decades by evolving with market trends. Whether it’s growth metrics, product output, or market shifts, everything points to a business that knows how to adapt and deliver.. Thanks for staying up until this very end. I hope you like this one. If you have any questions, let me know in the comment section.
