
Introduction
Robot Statistics: Robotics has become the fundamental infrastructure of the present. The pursuit of efficiency, precision, and safety across global industries has strengthened the role of robots as essential operational tools.
Driven by converging advancements in AI, sensor technology, and high-speed communication, the capabilities of automated systems are expanding exponentially, moving beyond static factory floors into dynamic environments like surgical theaters, logistics networks, and homes.
The profound impact of this transformation can only be understood through hard data. I’d like to discuss robot statistics, offering readers a clear perspective on the scale, velocity, and economic power of the global automation trend.
We are looking at a market shift where every major economic sector is recalibrating its human-to-robot ratio, changing labor, and unlocking unprecedented levels of productivity. So, let’s get started.
Editor’s Choice
- The global operational stock of industrial robotic units reached approximately 3 million by the end of 2025, reflecting a substantial year-on-year growth rate of 9.7% worldwide.
- South Korea holds the world’s highest robot density, utilizing an astonishing 1,012 industrial robots per 10,000 employees in its manufacturing sector, far surpassing the global average of 162.
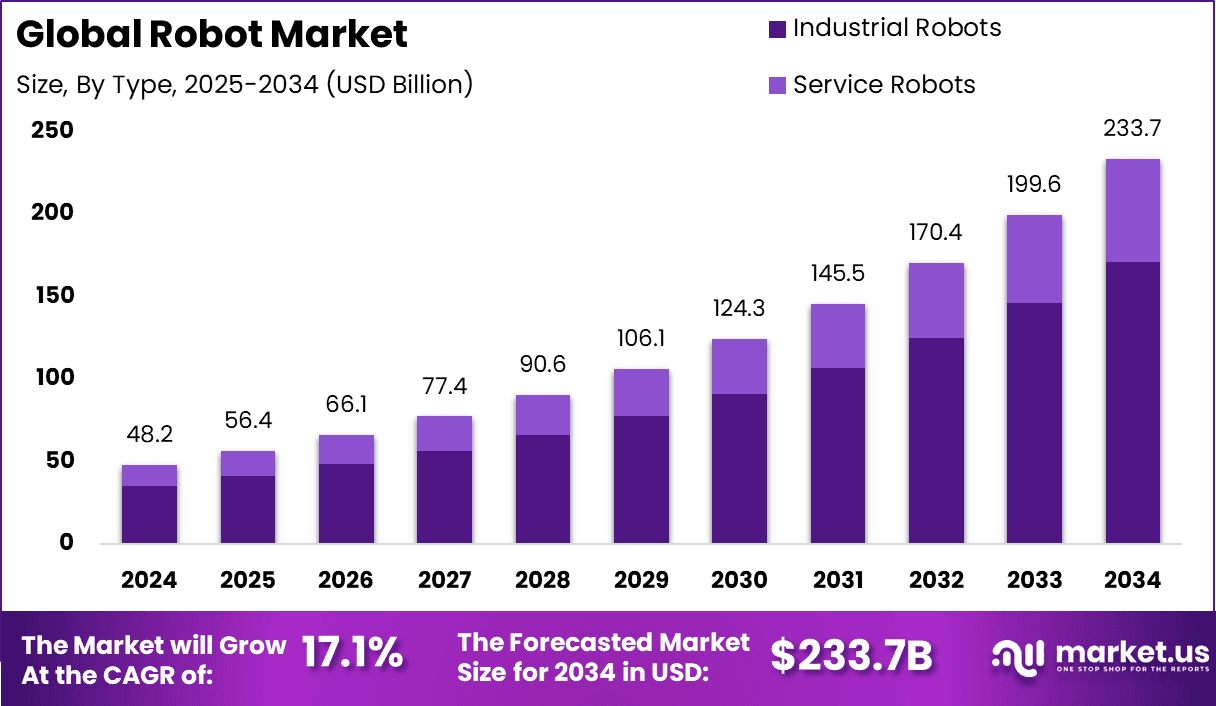
- The global robot market is estimated to reach USD 233.7 billion by 2034, rising from USD 48.2 billion in 2024, with a strong growth rate of 17.1% during 2025–2034.
- The Asia-Pacific region (APAC) held the largest share of 62.2% in 2024, generating around USD 29.98 billion in revenue due to rapid industrialization and strong investments in robotics.
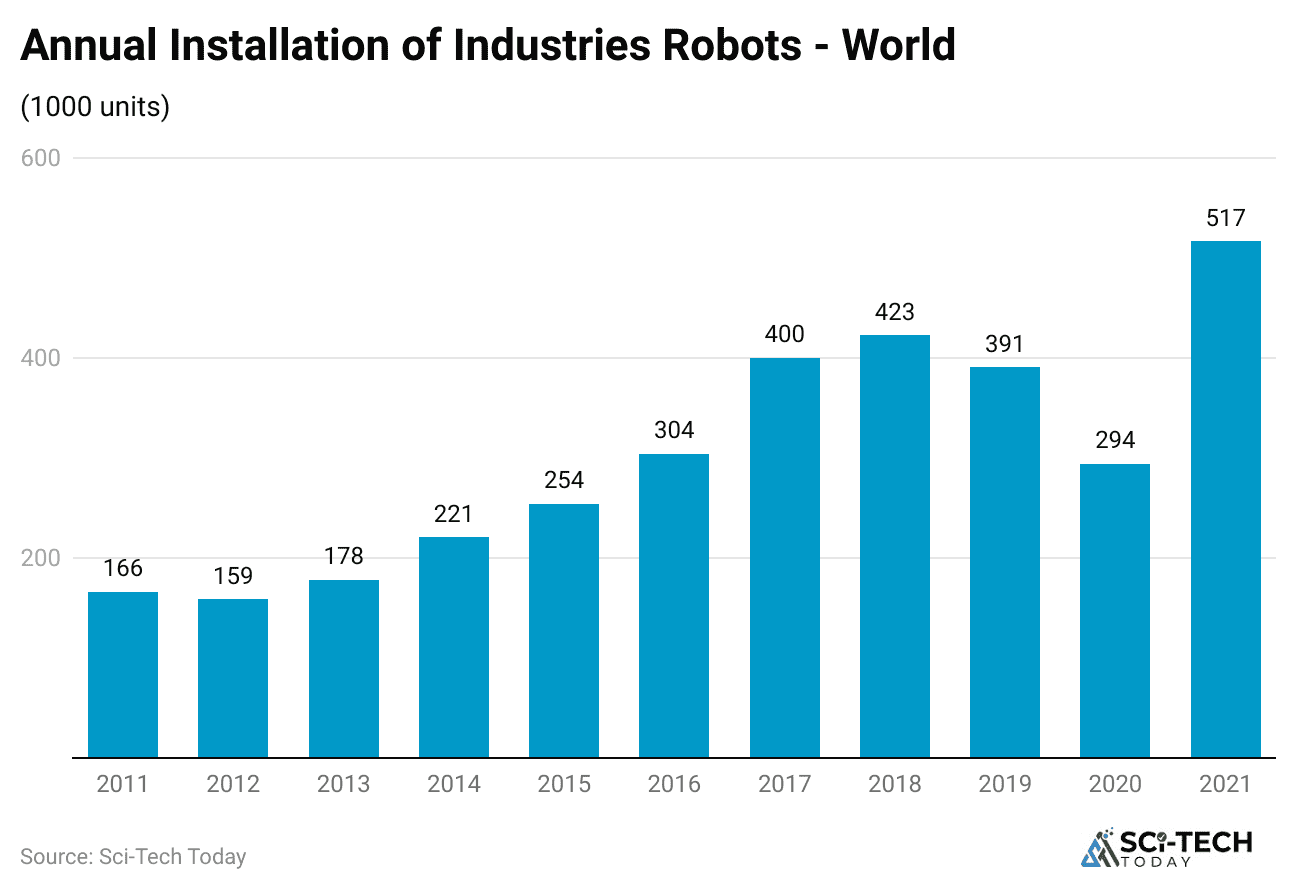
- The annual global installations of new industrial robots amounted to over 541,000 units in 2024.
- The service robotics market, encompassing logistics and healthcare, is expanding rapidly and is expected to exhibit a CAGR of around 5% between 2024 and 2032.
- The automotive industry was the largest single customer segment in 2024, responsible for installing 135,461 new robotic units globally to maintain high volume.
- China installed 276,288 new industrial robots in 2024, which solidifies its position as the largest single market, accounting for approximately 51% of the world’s total annual installations.
- The average robot density across global manufacturing has risen to 162 industrial robots per 10,000 employees.
Industrial Robot Installation
 (Reference: ifr.org)
- The global operational stock of industrial robots reached approximately 4.3 million units by the end of 2025, representing a solid growth rate of 9.7% over the previous year’s total.
- Annual global installations of new industrial robots amounted to 541,302 units in 2025, which represents only a slight decline of 2.1% compared to the peak installation year of 2024.
- The automotive industry was responsible for installing 135,461 new robotic units in 2025, making it the largest single customer segment for new robot shipments globally.
- New robot installations in the electronics industry followed closely, tallying 125,804 units, confirming its critical role as the second-largest sector driving global robot demand.
- The Asia/Australia region is the undeniable engine of this growth, accounting for approximately 70% of all newly installed industrial robots worldwide in 2025.
- China alone installed 276,288 new industrial robots in 2025, which is more than the total number of new units installed across the Americas and Europe combined.
- The Americas region recorded a solid installation base of 71,463 new industrial robot units in 2025, showing steady investment in automation technology.
- The number of robot installations in Europe reached 85,310 units in 2025, reflecting a healthy, sustained investment in manufacturing modernization across the continent.
- The total sales value of the industrial robotics market globally reached $15.7$ billion in 2025, slightly lower than the all-time high of the previous year but still indicating immense market strength.
- Over the last eight years, from 2016 to 2025, the operational stock of industrial robots has more than doubled, demonstrating the exponential acceleration of automation adoption globally.
| Data Point | 2023 Figure | Contextual Note |
| Total Operational Stock | 4.3 million units |
9.7% YOY growth worldwide. |
|
New Installations (Global) |
541,302 units | Driven heavily by the electronics and automotive sectors. |
| New Installations (China) | 276,288 units |
It represents roughly 51% of the entire global market. |
|
Total Sales Value |
$15.7$ billion |
Reflects the capital expenditure by industries on physical robot systems. |
Robot Statistics
- The global robot market is estimated to reach USD 233.7 billion by 2034, rising from USD 48.2 billion in 2024, with a strong growth rate of 17.1% during 2025–2034.
- The Asia-Pacific region (APAC) held the largest share of 62.2% in 2024, generating around USD 29.98 billion in revenue due to rapid industrialization and strong investments in robotics.
- The market includes a wide range of robots, such as industrial, service, humanoid, and robotic process automation systems, used for both autonomous and semi-autonomous tasks.
- Technological progress in artificial intelligence and automation has accelerated adoption across industries like manufacturing, logistics, and services.
- Data from Exploding Topics indicates that Asia contributes over one-third of total robotics revenue, confirming its global dominance.
- There are over 3.4 million industrial robots currently operating worldwide, and the global robot-to-human ratio in manufacturing is 1:71.
- Industrial companies are planning to allocate 25% of their capital to automation in the next five years, and about 14% of workers have already lost jobs due to robotic integration.
- Zippia reports that 88% of companies intend to use robotics in their operations, showing high adoption across sectors.
- Around 3 million robots are active globally, with about 400,000 new robots being added every year.
- In 2023, U.S. industrial robot installations increased by 12%, reaching 44,303 units, led by the automotive sector, which accounted for 40% of new robots, followed by electronics and electrical industries.
- The U.S. ranks fifth globally in robot density for automotive manufacturing and tenth overall in manufacturing, with 295 robots per 10,000 employees, compared to China’s 470 robots per 10,000 employees.
- The industrial robot segment held the largest share of 73.2%, mainly due to its use in welding, assembly, and material handling tasks.
- The hardware segment accounted for USD 12.9 billion in 2024, driven by demand for actuators, sensors, and controllers.
- On-premises solutions represented 72% of the market, as companies preferred full control over robotic infrastructure and data.
- Fixed robots contributed around USD 21.2 billion in 2024, being widely used in repetitive and high-speed industrial processes.
- The manufacturing and industrial vertical dominated with a 49.9% market share, driven by automation needs for efficiency and precision.
- Assembly and production applications were the most common uses of robotics, supporting faster and more accurate manufacturing operations.
Industrial Robotics Statistics
 (Source: market.us)
According to Market.us, robot density, which measures the number of operational robots relative to the human workforce, is the most telling Robot Statistics metric for automation maturity. These figures highlight the world’s most automated economies.
- The global average robot density across the manufacturing industry has risen substantially to 162 industrial robots per 10,000 employees, an increase from 151 the year before.
- South Korea holds the undisputed position as the world leader in robot density, boasting an astonishing 1,012 industrial robots per 10,000 manufacturing workers.
- Singapore closely follows as the second most automated country, with a robust density figure of approximately 730 robots per 10,000 employees in its highly specialized manufacturing sector.
- Germany maintains its status as Europe’s automation powerhouse, recording a density of 429 units per 10,000 workers, significantly higher than the European average of 190.
- In the Americas, the United States boasts a density of 285 robots per 10,000 employees.
- The automotive sector exhibits the highest robot density of any industry globally, with a density of approximately 889 robots per 10,000 employees worldwide.
- China’s national robot density has rapidly climbed to 395 units per 10,000 employees, showcasing its commitment to becoming the world’s most automated manufacturing nation by 2025.
- The country’s robotics market is highly concentrated, with the top five markets (China, Japan, the US, South Korea, and Germany) accounting for over 70% of the global operational robot stock.
| Country/Industry | Robot Density (Units/10k Employees) | Global Ranking |
| South Korea | 1,012 | Global No. 1 |
| Singapore | 730 | Global No. 2 |
| Germany | 429 | European No. 1 |
| China | 395 | Rapidly ascending in automation level. |
| Automotive Sector (Global) | 889 | Highest density among all major industries. |
Surgical Robots Statistics
- The global surgical robots market is projected to reach US$ 17.18 billion by 2034, rising from US$ 5.15 billion in 2024.
- The market is expected to grow at a compound annual growth rate (CAGR) of 12.8% from 2025 to 2034.
- The systems segment, which includes robotic units and related technologies, is anticipated to lead the market with a 55.6% share during the forecast period.
- Neurosurgery was the most profitable surgery type in 2024 and is expected to maintain dominance, accounting for 32.4% of the total share.
- Hospitals are the main users of surgical robots, representing 72.4% of the market in 2024.
- North America held the largest market position in 2024, contributing 43.5% of the total global revenue and generating around US$ 2.24 billion in market value.
Puddling Robot Statistics
- The Global Puddling Robot Market is projected to reach USD 1,052 million by 2034, rising from USD 150 million in 2024, with a CAGR of 21.5% during 2025–2034.
- In 2024, the Asia-Pacific region held the largest share of 73.4%, generating USD 110.1 million in revenue due to its strong focus on rice cultivation and smart farming technologies.
- The Semi-Autonomous/Operator-Assisted segment accounted for 42.5%, showing a strong preference for robots that combine automation with manual control for better efficiency.
- The Electric/Battery-Powered segment dominated with 74.3%, supported by the shift toward energy-efficient and eco-friendly agricultural machinery.
- Large-Scale Commercial Farming represented 62.4% of the market, indicating widespread use of robotic systems to increase productivity and reduce labor dependency.
- The Chinese market was valued at USD 44.3 million in 2024 and is expected to grow at a CAGR of 25.8%, driven by government policies promoting smart agriculture and mechanization.
- The Asia-Pacific region continues to lead the market, supported by extensive paddy fields, labor shortages, and rapid adoption of agri-robotic innovations.
Entertainment Robots Statistics
- The global Entertainment Robots Market is projected to reach USD 31.97 billion by 2034, growing from USD 4.10 billion in 2024 at a CAGR of 22.8% between 2025 and 2034.
- In 2024, North America led the market with a 35.10% share, generating USD 1.4 billion in revenue.
- Robot Toys were the top-selling product category, holding a 43.1% share, as they remain highly popular among children and households.
- The Entertainment application accounted for a 29.7% share, driven by rising use in interactive games and digital media experiences.
- Stainless Steel was the most used material, contributing to a 32.6% share, due to its strength and durability in robot construction.
- The Education sector represented the largest end-user category, with a 39.2% share, reflecting growing adoption of robots in teaching and learning environments.
- Regionally, North America maintained dominance with a 35.1% share, supported by the strong integration of robotics in the education and entertainment sectors.
- The U.S. market alone was valued at USD 3.20 billion in 2024 and is expected to grow steadily at a CAGR of 22.73%, confirming its leadership in advanced robotics adoption.
AI Companion Robot Statistics
- The global AI Companion Robot market is projected to reach USD 94.2 billion by 2034, rising from USD 10.8 billion in 2024, at a CAGR of 24.2% from 2025 to 2034.
- In 2024, North America held a 35.6% share, generating USD 3.8 billion in revenue, supported by strong healthcare innovation, aging populations, and high consumer adoption of smart technologies.
- The U.S. market accounted for USD 3.66 billion and is forecasted to grow at a CAGR of 23.1%, driven by rising investments in AI-based personal assistance and home care robots.
- The Hardware segment dominated the market with a 48.2% share, supported by progress in sensors, actuators, and humanoid robotics that improve real-world interaction.
- Mobile robots held a leading 56.5% share among mobility types, as movement is essential for caregiving, companionship, and household assistance tasks.
- The Multimodal interaction category accounted for 38.7%, combining voice, gesture, touch, and emotion recognition for better human-robot engagement.
- The Elderly age group represented the largest user base with 44.1%, as companion robots increasingly support emotional well-being and routine assistance for aging populations.
- Elderly Care and Assisted Living led the market by application with a 29.4% share, focusing on reducing loneliness, supporting medication schedules, and enhancing cognitive activity.
- Residential use dominated the market with a 52.3% share, showing growing consumer trust and integration of AI companion robots into family environments.
Agricultural Robot Statistics
- The global Agricultural Robot market is projected to reach USD 86.5 billion by 2033, increasing from USD 13.4 billion in 2023, with a strong CAGR of 20.5% during 2023–2033.
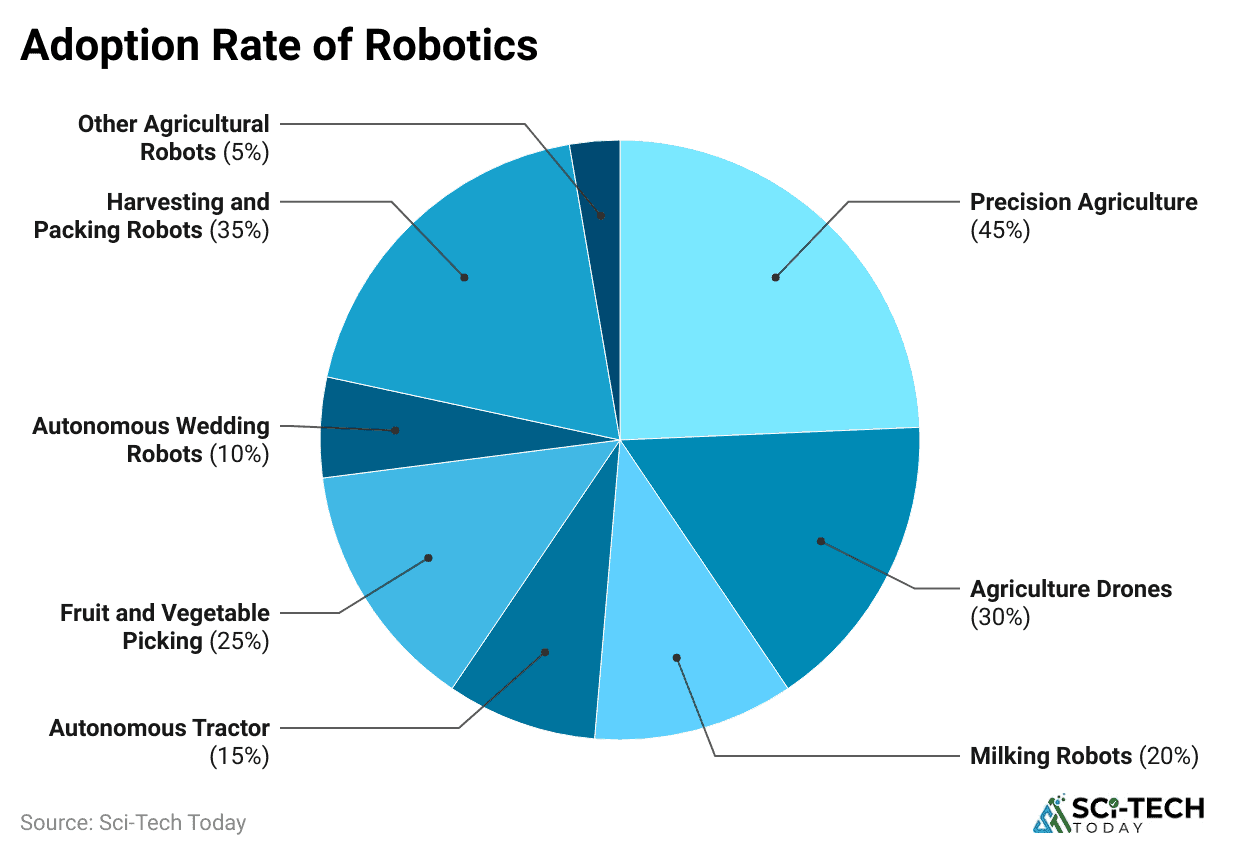
- Milking Robots lead the market, holding a 48.6% share in 2023, and are widely used for automating dairy operations.
- Drones and driverless tractors are growing rapidly as investments and industrial farming expand.
- Hardware accounts for over 55% of total offerings, including automated tractors and drones that perform physical tasks on farms.
- Software supports robot performance and navigation, while services maintain smooth operation and technical support.
- Planting and Seeding is a major application area, focusing on accurate seed placement and crop uniformity.
- Soil management is expanding quickly as mobile robots assist in fertilization, weeding, and monitoring soil health.
- Rising labor shortages and high labor costs are major factors pushing farmers toward automation and robotic solutions.
- The high cost of adopting digital and robotic systems remains a challenge for small and medium-sized farms.
- New opportunities are emerging in livestock management, where IoT and sensors are used to track animal health and productivity.
- Drones and robotic systems are improving precision in plowing, spraying, and harvesting operations.
- Fully autonomous robots are under development but face challenges due to high costs and technical complexity, delaying their widespread use until after 2025.
- North America dominates drone sales, supported by favorable government regulations for agricultural drone usage.
- The European Union promotes robotic technologies that enable precise pesticide use and sustainable farming practices.
- Major companies such as John Deere and AGCO Corporation continue to innovate in precision spraying, navigation, and route-planning systems to enhance efficiency in agricultural robotics.
The Rise of Service Robot Statistics By Professional and Personal
 (Reference: ifr.org)
- The total number of professional service robots sold globally reached over 158,000 units in 2023, representing a substantial value of $18.7$ billion for the sector.
- Sales of Autonomous Mobile Robots (AMRs) for logistics and material handling surged, with over 130,000 units sold in 2023, driving the segment’s total value past $4.2$ billion.
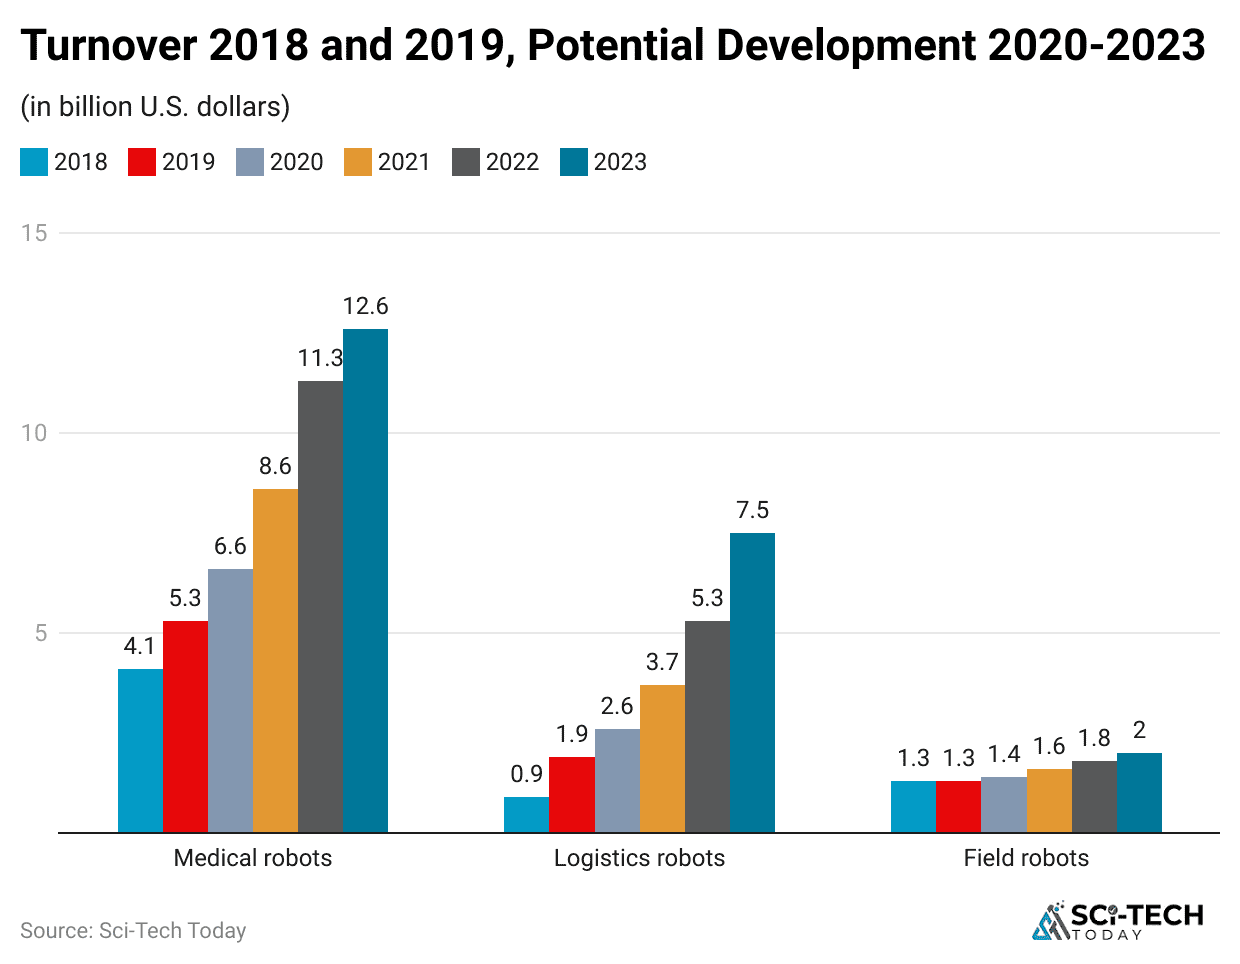
- The medical robotics market, including surgical and rehabilitation systems, generated approximately $7.5$ billion in revenue in 2023.
- It is estimated that over 7.2 million robotic surgical procedures have been performed globally over the last decade.
- The market for delivery and professional cleaning robots has seen a massive jump, with sales reaching approximately 43,000 units in 2023.
- The market for personal and domestic service robots, primarily vacuum cleaners and lawnmowers, saw a sales volume of over 18.4 million units in 2023.
- Revenue in the personal service robot segment exceeded $6.2$ billion in 2023, reflecting consumer willingness to invest in home automation solutions.
- The market for service robots is projected to have a robust Compound Annual Growth Rate (CAGR) of around 20.5% between 2024 and 2032.
- Agricultural robots, used for tasks like planting and harvesting, have a projected market value of $11.9$ billion by 2027.
| Service Robot Type | 2023 Sales Volume (Approx.) | 2023 Market Value (USD) |
| Autonomous Mobile Robots (AMRs) | 130,000+ units | $4.2$ billion |
| Medical Robots (Surgical/Rehab) | Less than 10,000 units | $7.5$ billion |
| Personal/Domestic Robots | 18.4 million units | $6.2$ billion |
Economic and Workforce Robot Statistics
 (Reference: market.us)
- Companies worldwide are projected to dedicate an average of 25% of their total capital expenditure towards industrial automation and robotics over the next five years.
- In the United States, the average cost of a standard industrial robot is approximately $21,350, while the average cost of a collaborative robot, or cobot, is lower at around $11,510.
- The global robotics industry is forecast to grow its total market value from its current standing to over $200$ billion by 2030.
- It is estimated that automation and AI have led to a cumulative wage reduction of up to 70% in certain low-skilled, highly automated industries since 1980.
- The adoption of automation has been linked to the displacement of approximately 1.7 million manufacturing jobs worldwide since the 1980s.
- Conversely, the demand for robotics engineers and technicians is soaring, with job openings in the US projected to increase by over 6% by 2025.
- The projected average annual salary for a robotics engineer in the US is set to reach $114,789 by 2025, reflecting a significant growth of over 10.3% since 2020.
- In warehouses, using Autonomous Mobile Robots (AMRs) can lead to a reduction of up to 40% in labor costs and an increase of up to 50% in order fulfillment speed.
- A major US retailer reported that its collaborative robots collectively saved the company approximately $22$ million in one year through optimized internal logistics.
- Nearly 88% of global manufacturing and logistics companies are actively planning or implementing robotics into every layer of their IT and operational infrastructure within the next 5 years.
| Metric | Figure |
| Projected Market Value (2030) | Over $200$ billion |
| Robotics Engineer Salary (US, 2025) | $114,789 |
| Job Displacement (Manufacturing, Global) | 1.7 million jobs |
| Annual CapEx for Automation | 25% of CapEx |
Sector-Specific Robot Statistics By Beyond Automotive
 (Reference: market.us)
- The metal and machinery sector contributes approximately 12% to the total global new robot installations.
- The plastics and chemicals industries combined account for about 4% of global new robotics installations.
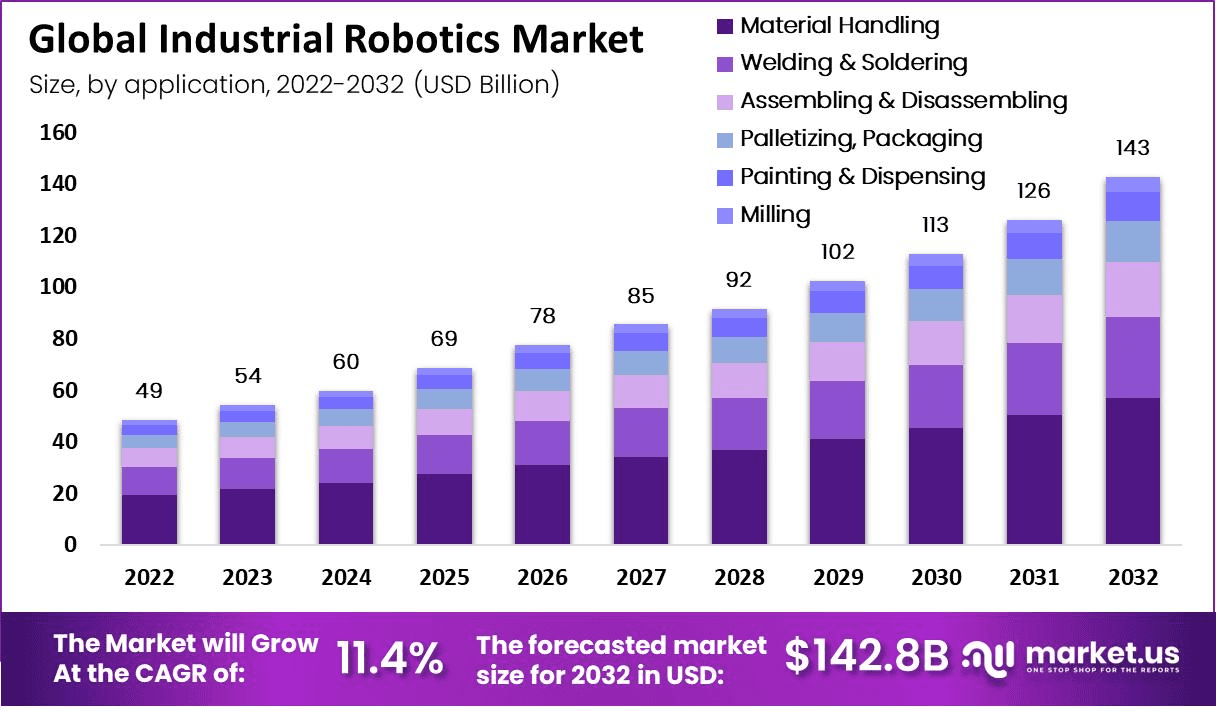
- Approximately 45.4% of the total operational robot stock is dedicated to handling operations.
- Welding and soldering applications account for 20.7% of the global industrial robot stock, emphasizing the robot’s role in precision, high-duty-cycle assembly.
- Assembly and disassembly tasks, which require complex manipulation, utilize 10.9% of the world’s industrial robot stock.
- In the food and beverage industry, new robot installations account for roughly 3% of the global total, with a strong focus on hygienic handling and automated packaging.
| Application Type | % of Global Robot Stock |
| Handling Operations/Tending | 45.4% |
| Welding/Soldering | 20.7% |
| Assembly/Disassembly | 10.9% |
| Dispensing Operations | 3.3% |
Logistics and Warehouse Automation
 (Reference: roboticstomorrow.com)
- Autonomous Mobile Robots (AMRs) and Automated Guided Vehicles (AGVs) are utilized in approximately 82% of robotic automation for ground movements and material handling processes within warehouses.
- Around 80% of robots used in logistics are applied specifically in goods receiving and storage processes.
- Approximately 77% of warehouse robots are dedicated to specialized tasks like material handling and forklift operations.
- The sorting of packages and goods accounts for the utilization of about 75% of deployed logistics robots.
- The AMR market alone is projected to sell over 180,000 units annually by 2030, which is more than triple the sales volume recorded in 2023.
Robot Statistics on Adoption Challenges and Future Trends
 (Reference: market.us)
- A significant 71% of potential adopters cite the high upfront cost of robotics hardware as a primary obstacle to full automation.
- The lack of internal expertise and a shortage of skilled personnel are highlighted by 61% of organizations as key barriers to successfully implementing and maintaining robotic systems.
- In the retail and consumer goods sector, nearly 60% of companies admit that limited internal knowledge about robotics and uncertainty regarding Return on Investment (ROI) stall their adoption plans.
- Approximately 42% of companies face major difficulties in sourcing end-to-end robotics solution providers who can offer integrated hardware, software, and support across multiple international regions.
- More than 55% of industrial companies express a strong preference for a single system integrator to manage all aspects of maintenance, covering both the robotic hardware and its complex control software.
Emerging Trends and Forecasts
- Collaborative robots (cobots) are predicted to make up an increasing proportion of the market, with sales volume expected to reach roughly 34% of total new robot installations by 2025.
- The cloud robotics market, which leverages centralized cloud processing for robot control, is expected to surge from a value of $11.04$ billion in 2025 to over $73.79$ billion by 2034, reflecting a massive 23.5% CAGR.
- Software components, which are crucial for cloud robotics and AI functionality, are already dominating the market, capturing over 54% of the global cloud robotics market share in 2024.
- In the medical field, innovative devices like Veebot robots achieve an impressive 83% accuracy rate in identifying the optimal vein for patient blood draws.
- Market forecasts suggest that the automotive industry will be relying on robots to manufacture approximately 75% of all new vehicles produced globally by the end of 2025.
| Challenge/Trend | Key Numeric Indicator |
| Hardware Cost Barrier | 71% of companies |
| Cobot Market Share | 34% of new sales by 2025 |
| Cloud Robotics CAGR | 23.5% (2025-2034) |
| Medical Robot Accuracy | 83% accuracy rate |
Conclusion
Overall, the analysis of current robot statistics gives a clear picture of a global economy undergoing a profound and accelerating change toward automation. From the volume of 4.3 million operational industrial units to the specialized precision of the $7.5$ billion medical robotics sector, the data confirms that robots are fundamentally changing productivity and human-machine collaboration.
The high automation densities in Asia and Europe, coupled with massive investments in new software-driven domains like cloud robotics, project a future where the current metrics will soon seem modest. I hope you guys like this piece of work. If you have any questions, kindly let us know. Thanks for staying up till the end.
