Introduction
Snacks Statistics: Snacking isn’t just something people do between meals anymore. It’s now a huge industry worth billions of dollars. From munching on chips while watching TV to grabbing a protein bar after hitting the gym, snacks have become a big part of our everyday lives. But have you ever thought about what’s behind this rising trend?
Learning about Snack Statistics helps us understand how people’s eating habits are changing, what kinds of snacks they prefer, and where the big money is being made. In this guide, we’ll look at the latest snack facts, including global sales, top snack types, shifts in consumer habits, healthier choices, and trends across different parts of the world.
Editor’s Choice
- Almost 81% say they pay attention to the sensory experience of their snacks.
- Sixty-nine per cent of global consumers look for snacks that are portion-controlled.
- Around 95% of them say they snack because they do so to savour the flavours and texture.
- 49% of Gen Z believe that meditating or doing other mindful techniques is an important aspect of health.
- Nearly 83% do not want to sacrifice flavour when choosing indulgent snacks.
- 76% prioritize enjoying an indulgent snack over a focus on ingredients.
- Around 73% would rather have a smaller portion of an indulgent snack than a bigger portion of a low-fat/sugar alternative.
- 48% of American consumers (Internet Users aged 18+) agree that eating healthy means “balancing between healthy choices and indulgence (i.e., not overly restrictive).
- Nearly 94% are likely to have a snack as a reward or a treat.
- 81% snack to find quiet moments to themselves, up 9% from the previous year.
- 77% agree, “Snacking is one of the few indulgences I have these days.”
- 76% snack for a mood boost during the day.
- 79% agree, “Food is our one true universal love language around the world.
- 70% agree, ‘In a world where we’re all caught up in our routines, sharing snacks brings us back to the simple joy of connecting with others.
- 77% have taken steps to connect with others through food in the last 6 months.
- 71% agree,” Sharing snacks with others is my love language.”
Snacks Sales Soar Statistics
| Product | Dollar Sales (USD MIL) | Unit Sales (MIL) | Volume Sales (MIL LB) |
|
Total |
USD 68,358.7 | 16,795.6 | 10,967.0 |
| Cookies | USD 11,654.2 | 2,957.9 |
2,413.5 |
|
Crackers |
USD 9,412.3 | 2,437.6 | 1,829.3 |
| Potato Chips | USD 8,621.5 | 2,694.8 |
1,297.4 |
|
Bars |
USD 7,051.5 | 1,394.9 | 867.0 |
| Tortilla/Tostada Chips | USD 6,905.4 | 1,876.0 |
1,270.8 |
|
Other Salted Snacks |
USD 6,607.8 | 1,132.6 | 778.8 |
| Snacks, Nuts/Seeds | USD 4,944.9 | 963.3 |
795.9 |
|
Cheese Snacks |
USD 2,867.0 | 827.8 | 368.6 |
| Dried Meat Snacks | USD 2,559.2 | 492.4 |
137.6 |
|
Pretzels |
USD 2,014.4 | 494.2 | 442.3 |
| Corn Snacks | USD 1,914.3 | 571.3 |
265.2 |
|
RTE Popcorn/Caramel Corn |
USD 1,804.5 | 468.7 | 197.9 |
| Snacks Mix | USD 1,599.2 | 329.5 |
258.5 |
|
Pork Rinds |
USD 392.3 | 151.9 | 43.6 |
|
Apple Chips |
USD 10.2 | 2.7 |
0.6 |
Popular Snacks Statistics
#1. Powerhouse Potato Chips
- Potato chips brought in $8.6 billion in total sales, which is a 7.7% increase compared to 2023.
- While the number of items sold dropped slightly by 1.9%, the category continues to grow due to its ability to stay fresh with new and exciting flavours.
#2. Tortilla Chips
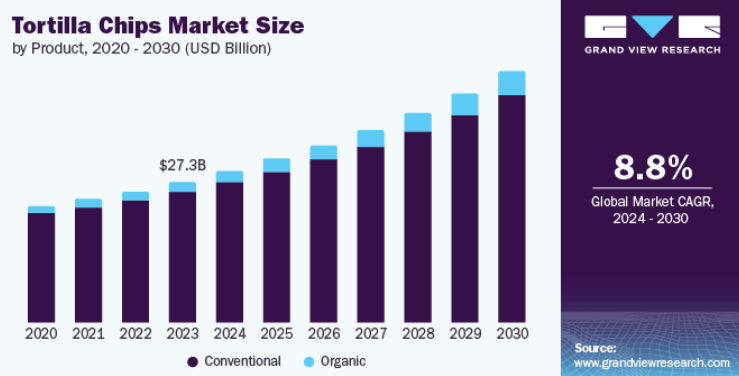 (Source: grandviewresearch.com)
- Tortilla chips showed steady growth in the $6.9 billion category, with a 9.4% increase in dollar sales and a small 0.3% rise in units sold.
- In 2024, the tortilla chips market was valued at around $37.5 billion.
- Experts expect it to reach between $48 billion and $55 billion by 2030–2033, growing at a yearly rate of 4% to 6.5%.
- Salted or plain tortilla chips are the top sellers, bringing in close to $6.4 billion in 2024.
- About 22% of sales came from gluten-free chips, and there’s also rising demand for organic and premium-quality chips.
- Approximately 85% of tortilla chip sales occur in physical stores, such as supermarkets and convenience stores.
- Online shopping for chips is growing fast, making up about 10% to 20% of the market and increasing by over 10% each year.
- Bold and unique flavours are gaining popularity. Varieties such as chilli-lime, sriracha, sour cream, and cheesy blends accounted for around 25% to 40% of new product launches.
#3. Pretzels
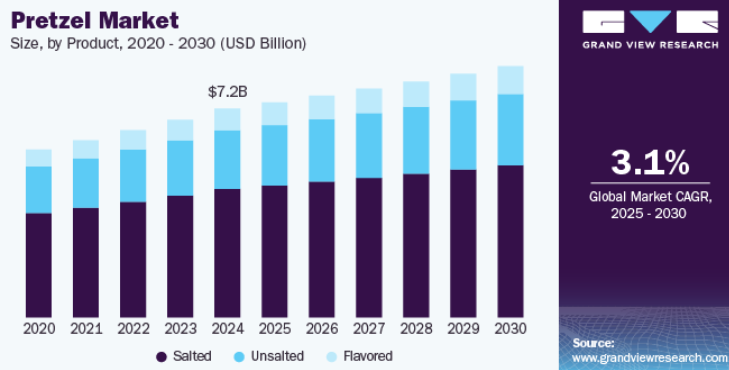 (Source: grandviewresearch.com)
- Pretzels had a strong year in 2023, with sales going up by 8.7%, the number of items sold rising 2.2%, and total weight sold growing by 0.7%.
Three key trends are helping push these numbers up:
- Store-brand pretzels saw a big boost, with sales climbing over 20%
- More companies are offering healthier choices, like baked instead of fried pretzels
- New and creative flavours, along with combo snacks like trail mix, are driving more interest
- Pennsylvania produces about 80% of all pretzels made in the U.S.
#4. Crackers
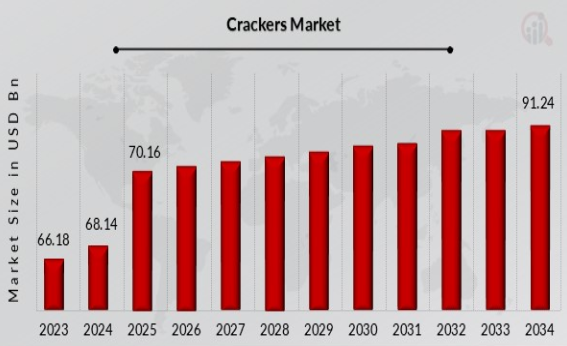 (Source: marketresearchfuture.com)
- Cracker sales went over $9.4 billion, with a 7.2% boost in dollar sales, even though the number of boxes sold dropped by 3.3%.
- Research from Kellanova shows that 60% of people who snack prefer something with a crunch.
- The worldwide cracker market was valued between $23 billion and $25 billion in 2024.
- It’s expected to grow steadily at a rate of 4% to 6% per year, possibly reaching $31–$40 billion in the next several years.
- North America accounted for the largest portion, with approximately 35% of global sales, or nearly $8.8 billion, and is growing at a rate of around 6% annually.
- The Asia-Pacific region followed with 30% of the market (approximately $7.6 billion) and has the fastest growth rate, at around 8% per year.
- Europe had a 25% share, worth approximately $6.3 billion, growing at a rate of around 2% annually.
- The rest of the world accounted for the remaining 10%, or approximately $2.5 billion.
- Stuffed or sandwich-style crackers led the market with 35% of total sales (around $8.9 billion).
- Plain or soda crackers held a 25% share (about $6.3 billion).
- Whole wheat and multigrain crackers accounted for 20%, worth approximately $5.1 billion.
- Fortified options (such as high-protein or high-fibre crackers) accounted for 15%, reaching close to $3.8 billion.
- Other unique and specialty varieties took the last 5%, or roughly $1.3 billion.
- Supermarkets and big retail chains were the top shopping spots, bringing in about 45% of sales.
- Local or traditional shops (like mom-and-pop stores) made up around 38%.
- Online shopping grew rapidly, now representing 17% of cracker sales—worth about $11 billion in 2023—and is projected to hit $20 billion by 2032.
#5. Popcorn
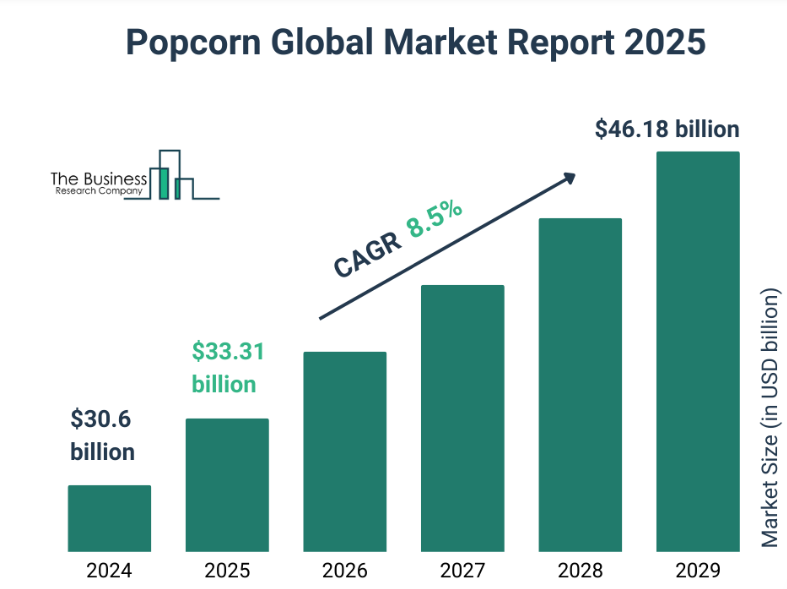 (Source: thebusinessresearchcompany.com)
- In 2024, the worldwide popcorn market is estimated to be worth between $6.5 billion and $14.4 billion, depending on the source.
- Experts anticipate the industry to grow by 6–8% annually, potentially reaching $10–21 billion by 2030 or 2033.
- In the U.S., popcorn sales in 2024 are estimated to be around $3.7–$ 3.8 billion. Forecasts indicate that it could continue growing at a 5.5–7.2% annual rate over the next five years.
- Ready-to-eat popcorn is leading the category, with sales projected to be between $3.8 billion and $4.1 billion in 2024. This segment is on track to grow to around $6.9 billion by 2032, thanks to a 6.9% annual growth rate. RTE popcorn now makes up 62–68% of all popcorn sales worldwide.
- North America remains the biggest market, especially the U.S., which accounts for over 48% of global RTE popcorn sales. Europe is also performing well, while demand is increasing rapidly in the Asia-Pacific region.
- Even though corn prices dropped in 2024, the average price of popcorn stayed high. A unit of popcorn sold for about $3.30, just a little less than the $3.50 average in 2023.
#6. Cheesy
- The cheese snack market, now valued at nearly $2.9 billion, saw a 4.1% increase in sales, with spicy and cheesy flavours being a popular combination among buyers.
- Many cheese snack brands made with 100% real cheese are showing up on healthy snack lists because they’re high in protein and low in carbs—making them a smart choice for people who want something quick and nutritious.
#7. Whole Corn
- The total amount sold (by weight) also increased by 23.4%. While new and creative products are helping to boost the category, classic snacks remain the top choice for most people.
- In 2024, the U.S. is expected to produce about 384.6 million metric tons of corn (about 15.14 billion bushels), making it the third-biggest corn harvest in U.S. history. That’s less than the 2023 record.
- Farmers are planting around 82.7 million acres, which is slightly less than last year.
- Yields are very strong at an average of 183.1 bushels per acre, though the USDA later adjusted this to 179.3 bushels per acre.
- Corn is expected to sell for around $4.40 per bushel in the 2024–2025 season. That’s lower than $4.75 in 2023 and much lower than $6.54 in 2022.
- Carryover stocks from 2023 are about 2.02 billion bushels, up from 1.76 billion the year before.
- The total supply is approximately 16.9 billion bushels, including the remaining stock and imports.
- Worldwide corn production is estimated at 1,219 million metric tons in 2024–2025, slightly below the 2023 level of 1,229 million.
- Global corn exports are expected to reach around 189.8 million metric tons, a decrease of about 3%.
- The top corn producers are the U.S., China, Brazil, India, and Argentina.
#8. Pork Grind
- One cup of pork rinds, which weighs about 238.1 grams, has around 1,360.5 calories. It includes 136.1 grams of protein, 85 grams of fat, and no carbs at all.
The following is the nutritional value of Pork Grind:
| % Daily Value | mg | % |
|
Total Fat |
85.g | 109% |
| Saturated Fat | 34.0g |
170% |
|
Polyunsaturated Fat |
0.0g | |
| Cholesterol | 340mg |
113% |
|
Sodium |
4592mg | 200% |
| Total Carbohydrates | 0.0g |
0% |
|
Dietary Fiber |
0.0g | 0% |
| Sugar | 0.0g |
– |
|
Protein |
136.1g | 272% |
| Vitamin D | 0.0mcg |
0% |
|
Calcium |
170mg | 13% |
| Iron | 3.4mg |
9% |
|
Potassium |
340mg |
7% |
Snacks User Demographic Statistics
- Around 66% of U.S. adults snack at least twice a day, and 91% snack at least once every day. Nearly 49% of Americans snack three or more times daily, which is up about 2.7% from last year.
- 58% of people say they prefer snacks over regular meals, and 66% claim they couldn’t go without snacking.
- Younger adults (under 35) are the biggest snackers—74% snack several times per day, compared to 50% of older adults.
 (Reference: media.market.us)
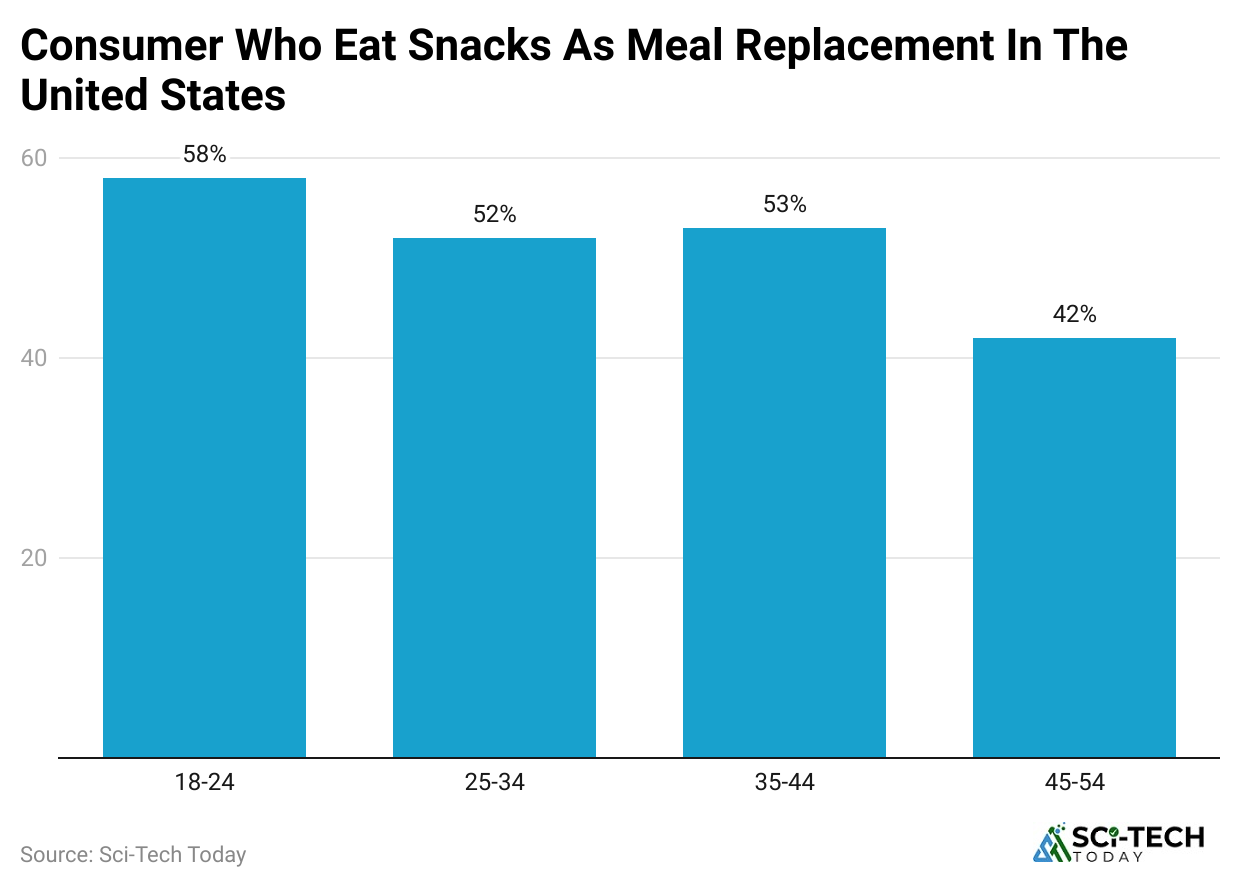
- In the above chart, we can see the consumer statistics of those who eat snacks as a meal replacement in the United States.
Many replace meals with snacks:
#1. 58% of those aged 18–24
#2. 52% of those 25–34
#3. 53% of those 35–44
#4. Drops to 42% among ages 45–54
- Over 55% of Americans replace at least one meal per week with a snack.
- On average, women snack about 3.1 times daily, while men snack around 2.7 times per day.
- 49% of snackers say they do it as part of a healthy routine, while around 41–48% enjoy it as a small treat.
- Healthier snack choices include yoghurt (69%), milk (63%), cheese (60%), protein snacks, fruit bars, and nuts.
 (Reference: mondelezinternational.com)
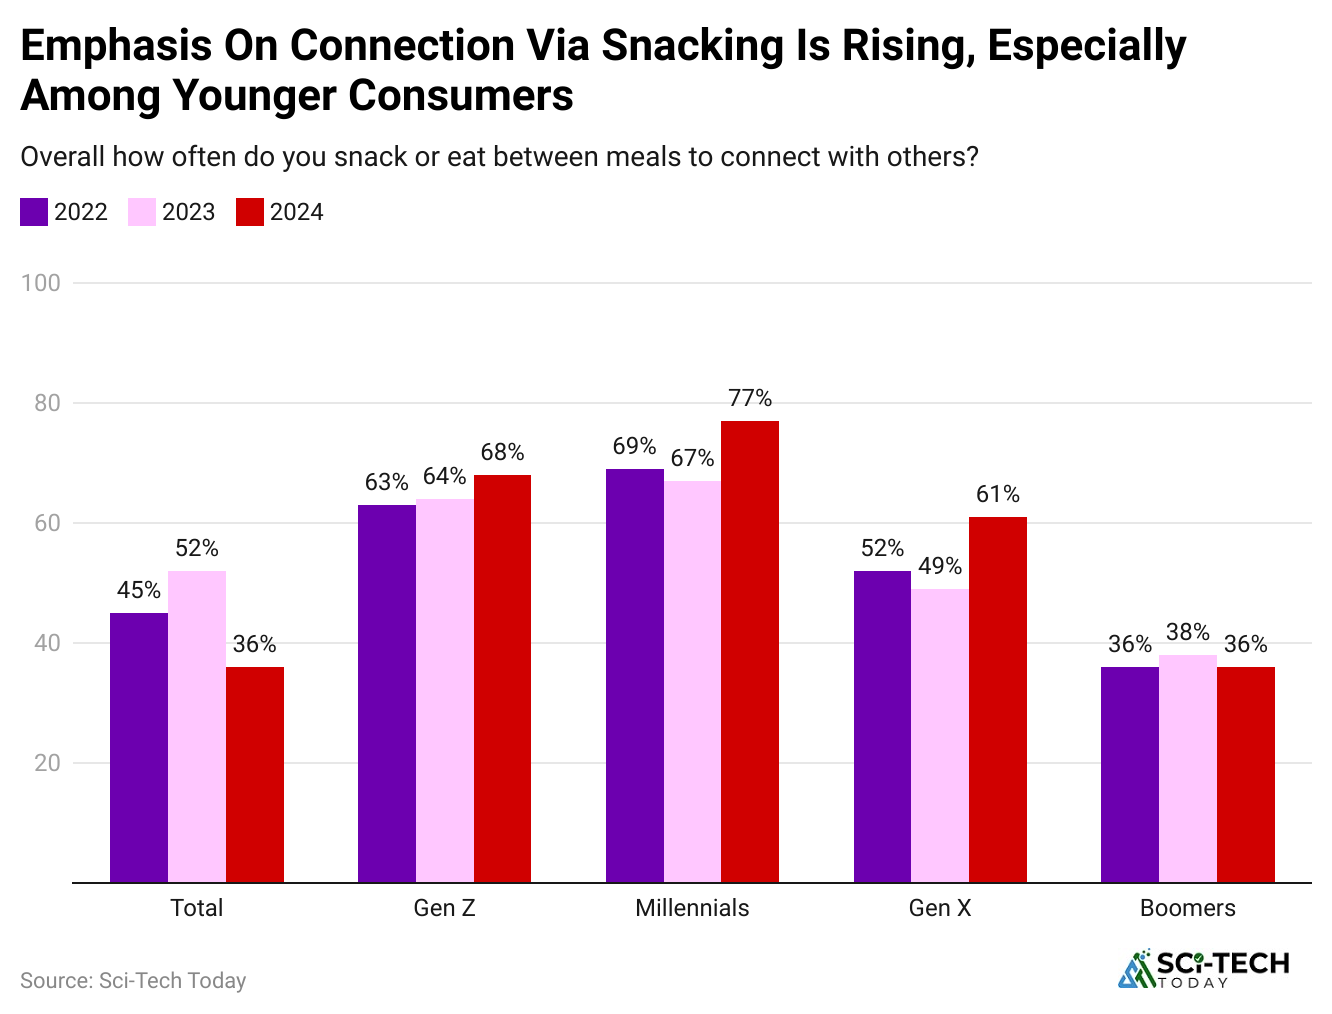
- In the chart above, we can see the demographic statistics by age group.
- The emphasis on connection through snacking is increasing, especially among young people.
- Snacks are purchased in supermarkets, convenience stores, and increasingly online. Online snack shopping is expected to grow from 25% to 32%.
- Even with rising prices, 94% of shoppers say they can still find snacks within their budget.
- About 80% of people stick to familiar brands—often ones they’ve trusted since childhood.
Healthy Snacks Statistics
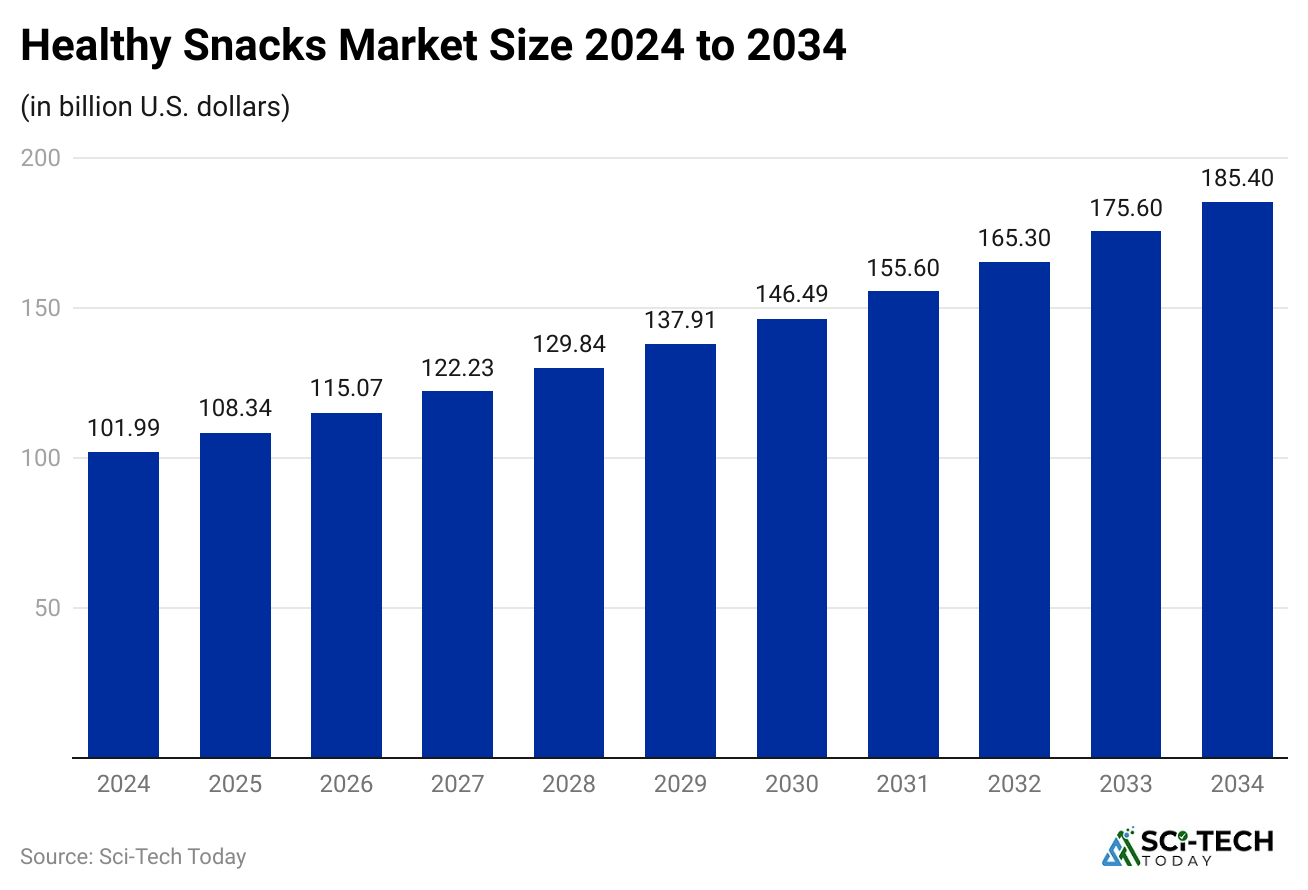
- The worldwide healthy snacks market was valued at about $91 billion in 2024. It’s expected to reach nearly $147 billion by 2033, growing at a steady yearly rate of 5.2% to 6.2%.
- Market estimates for 2024 vary slightly, ranging from $87 billion to $101 billion, depending on the source.
- North America holds the largest portion of the market, accounting for nearly 40% of global sales—approximately $36 billion—with an annual growth rate of over 6%.
- The Asia-Pacific region is experiencing rapid growth, with a yearly growth rate of around 6.7% to 6.8%, resulting in $23 billion in revenue in 2023.
 (Reference: precedenceresearch.com)
| Year | USD Billion |
|
2024 |
USD 101.99 |
| 2025 |
USD 108.34 |
|
2026 |
USD 115.07 |
| 2027 |
USD 122.23 |
|
2028 |
USD 129.84 |
| 2029 |
USD 137.91 |
|
2030 |
USD 146.49 |
| 2031 |
USD 155.60 |
|
2032 |
USD 165.30 |
| 2033 |
USD 175.60 |
|
2034 |
USD 185.40 |
- In India, the healthy snacks market was valued at approximately $4.1 billion in 2024. It’s expected to double and hit $8.2 billion by 2033, growing by roughly 7.2% per year.
- Fruit, nut, and seed snacks held the largest market share, accounting for approximately 37% to 38% in 2023 and 2024.
- Baked healthy snacks, such as protein bars, are also experiencing rising demand, with a growth rate of approximately 6% to 6.4% per year.
- Products that are low or free of sugar made up nearly 39% of sales in 2023.
- The market for gluten-free snacks is expanding fast, with a growth rate of about 7.5% annually.
 (Reference: media.market.us)
- Kibo led the way with a 794.38% surge, showing it’s quickly becoming a top choice for health-conscious snackers.
- Veggie Crisps also did well, with a 565.93% increase in interest. Miss Vickie’s followed close behind with a 406.86% rise in demand.
- Other brands, such as Terra and Beet Chips, also saw strong growth, increasing by 199.01% and 150.62%, respectively, indicating that more people are trying veggie-based snacks.
- Bare, Nut Thins, and Lentil Chips also became more popular, with gains of 111.44%, 97.38%, and 93.79%, proving that better-for-you snacks are in demand.
- Finally, in Late July, Brad’s saw solid increases of 74.05% and 60.49%, showing that shoppers are now choosing healthier snack options from a wide range of brands.
- Pouches and bags are the most popular packaging options, accounting for approximately 42% of total sales.
- Most people buy healthy snacks from supermarkets and big stores, which account for around 43% to 60% of all sales.
- Online sales are increasing rapidly, with digital purchases growing at a rate of approximately 8% per year.
Vegan Snacks Statistics 2025
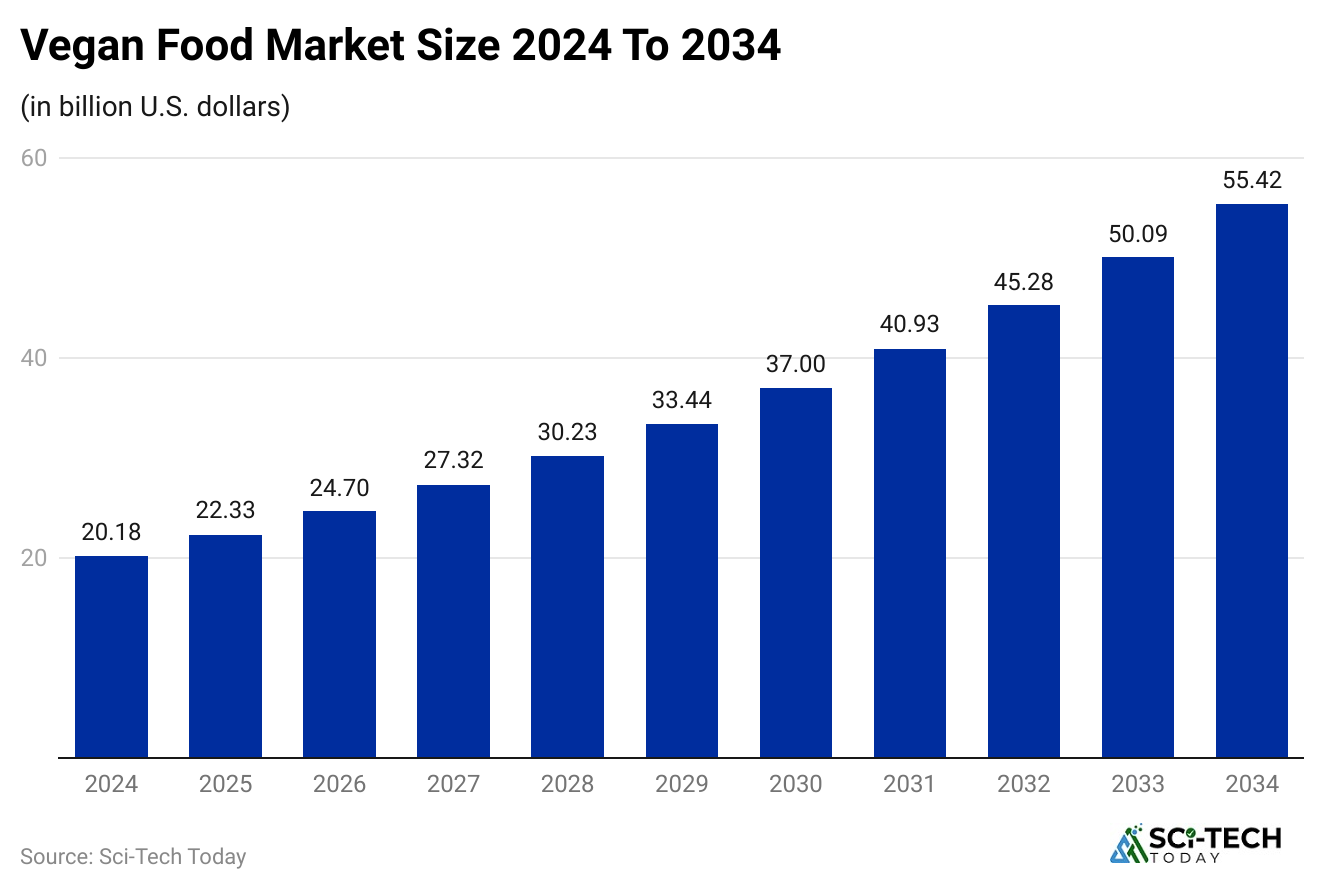
- The vegan snacks industry was valued at $51.1 billion in 2024 and is projected to reach approximately $54.8 billion by 2025.
- The market is growing at an average annual rate of 7.2% and is projected to reach $102.5 billion by 2034.
- As of 2023, it was valued at approximately $36 billion and is projected to reach nearly $76.1 billion by 2033, growing at an annual rate of 8%.
 (Reference: precedenceresearch.com)
| Year | USD Billion |
|
2024 |
USD 20.18 |
| 2025 |
USD 22.33 |
|
2026 |
USD 24.70 |
| 2027 |
USD 27.32 |
|
2028 |
USD 30.23 |
| 2029 |
USD 33.44 |
|
2030 |
USD 37.00 |
| 2031 |
USD 40.93 |
|
2032 |
USD 45.28 |
| 2033 |
USD 50.09 |
|
2034 |
USD 55.42 |
- The European vegan snack industry was valued at $10.2 billion in 2021 and is projected to reach $18.9 billion by 2030, increasing at an annual growth rate (CAGR) of 7.1%.
- The Asia-Pacific region is also experiencing rapid growth in the vegan snacks market, increasing from $12.9 billion in 2021 to a projected $25.4 billion by 2030 at a rate of approximately 7.8% annually.
- China’s vegan snacks market was valued at approximately $3.3 billion in 2021 and is projected to reach $5.5 billion by 2029, with a compound annual growth rate (CAGR) of 6.7%.
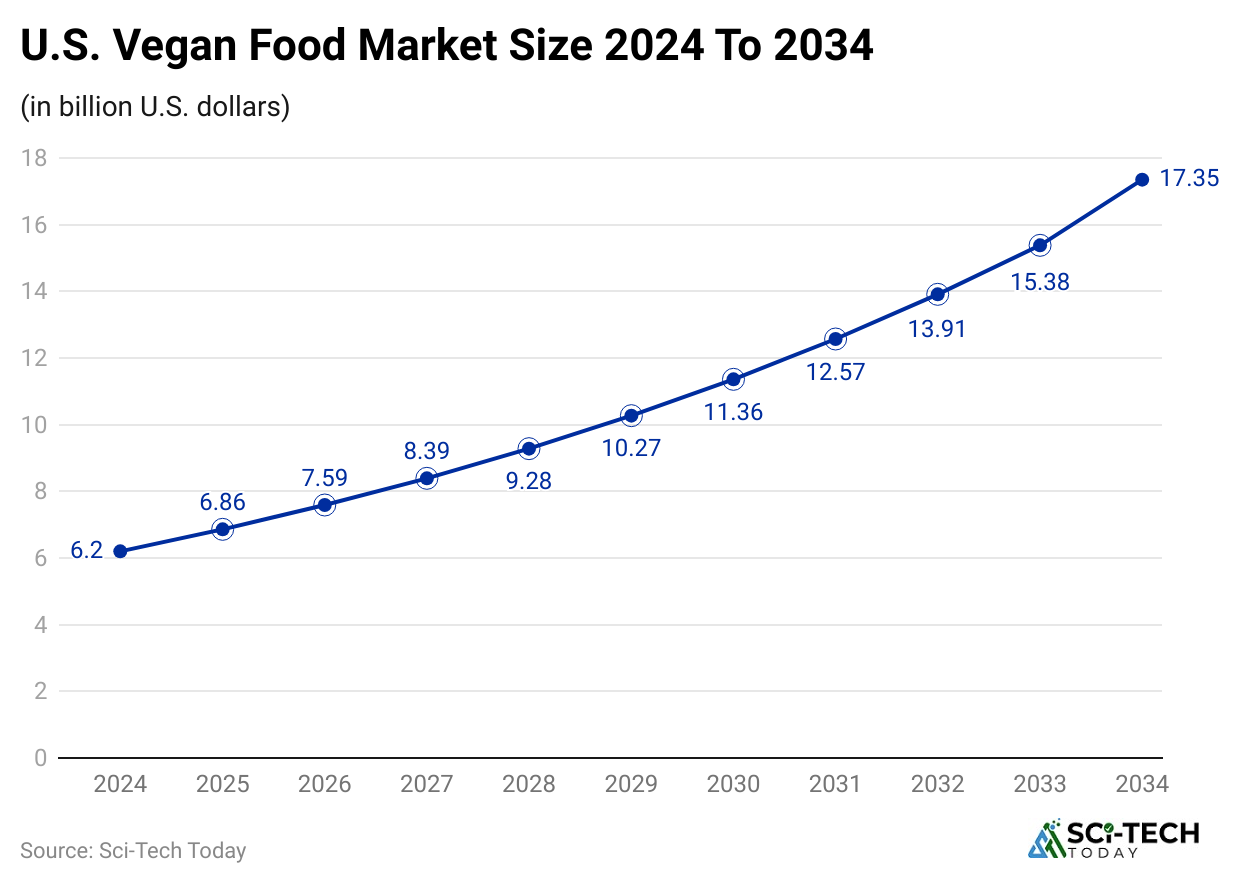
- North America leads the vegan snacks market and is projected to reach $15.2 billion by 2025, with an estimated annual growth rate of 10.5% through 2035.
 (Reference: precedenceresearch.com)
- India’s vegan snacks market was valued at $2.4 billion in 2021 and is projected to reach $3.8 billion by 2029, growing at a 6% annual rate.
Conclusion
In 2024, the snack industry experienced steady growth, driven by shifting tastes, healthier options, and innovative flavour concepts. More people are opting for snacks that are plant-based, high in protein, and low in carbs while still enjoying strong flavours like spicy, sweet, and cheesy. Products like crackers, popcorn, pretzels, and vegan snacks experienced higher sales or demand, even if the number of items sold decreased in some cases.
Store-brand and specialty snacks are also becoming more popular, showing that shoppers want more variety, better prices, and healthier options. As the snack market continues to change, companies that mix good taste, better ingredients, and new ideas are most likely to succeed in 2025 and beyond. Through this article, we have shed enough light on snack statistics.
Sources
- Statista
- Mordorintelligence
- Mondelezinternational
- Statista
- Nielseniq
- Grandviewresearch
- Imarcgroup
- Statista
- Statista
- Mordorintelligence
- Snacintl
- Factmr
- Market
- Precedenceresearch
- Euromonitor
- Packagingcorp
- Ific
- Nexdigm
- Grandviewresearch
- Ncbi
- Media
- Ncbi
- Wikipedia
- Tastewise
- Nielseniq
- Myshortlister
- Technavio
- Globaldata
- Euromonitor
- Mintel
- Zipdo
- Innovamarketinsights
- Marketdataforecast
- Skyquestt
- Coolest Gadgets
- Glanbianutritionals
- Sphericalinsights
- Datamintelligence
- Economictimes
- Straitsresearch
- Datahorizzonresearch
- Giiresearch
- Foodnavigator
