
Introduction
Gen Y Statistics: Like Gen Alpha, every generation leaves its mark, and Gen Y, often called Millennials, has been one of the most talked about. Born between 1981 and 1996, they’re now in their late twenties to early forties, right at the center of today’s workforce, family life, and consumer market. They witnessed the world transition from dial-up internet to smartphones and experienced the 2008 financial crisis.
To really understand them, we need more than stereotypes. That’s where my Gen Y statistics come in. These numbers reveal how educated they are, how they earn and spend, their family choices, tech habits, and values. In this article, I’ll break down the data in detail so you can see the real picture of Gen Y and the impact they’re having right now.
Editor’s Choice
- Gen Y, also known as Millennials, were born between 1981 and 1996, and today they’re around 29 and 44 years old.
- They make up about 72 million people in the US and roughly 1.8 billion globally, making them one of the largest living generations.
- Education is a changing feature, with 25% holding at least a bachelor’s degree, and the average student debt in the U.S. is around $36,000.
- Gen Y’s median individual income sits near $50,000 in the U.S., while their household income averages about $80,00.
- Work habits show 70% are employed full-time, about 15% part-time, and around 10% freelance or self-employed.
- When it comes to housing, only 45% own homes, while 25% still live with parents due to affordability.
- Family trends show the average age at first childbirth is around 26 to 27 years, with 8 children per couple on average.
- Gen Y is highly digital, with 95% owning smartphones, 90% active on social media, and 80% subscribed to streaming services.
- Health surveys reveal stress levels average 6.5 out of 10, and around 30% report anxiety disorders, higher than in past generations.
- Values lean toward meaning and sustainability: 70% want purpose-driven jobs, 60% will pay more for eco-friendly products, and 50% want brands aligned with their values.
- Financially, only 30% save 10% or more of their income, but 40% invest beyond retirement accounts, including stocks and crypto.
- Lifestyle choices prioritize experiences, with Gen Y spending about $1,500 a year on domestic travel and $2,500 on international trips.
| Topic | Key Gen Y Statistics |
| Definition |
Born from 1981 to 1996. Age in 2025: 29 to 44. Also called Millennials |
|
Population |
72M in the US, 1.8B globally |
| Education |
25% with bachelor’s 42% with some college, Avg debt $36K |
|
Income |
Median individual $50K Younger $40K Older $60K Household $80K |
| Employment |
70% full-time, 15% part-time, 10% freelance/self-employed, 4 to 5% unemployment rate |
|
Homeownership |
45% own homes 25% still live with parents |
| Family & Fertility |
The average age at first childbirth is 26 to 27. Avg 1.8 children per couple |
|
Tech & Digital Use |
95% smartphone users 90% active on social media, 3 to 4 hrs/day of mobile use, 80% stream |
| Health & Well-Being |
Avg stress level 6.5/10 Anxiety disorders 30% |
|
Social Values |
70% prefer purpose-driven jobs, 60% pay more for eco-friendly, 50% value-driven buys |
| Finance & Savings |
30% save 10% income 40% invest beyond retirement accounts |
|
Travel & Lifestyle |
$1,500 annual domestic travel, $2,500 international travel |
Who is Gen Y?
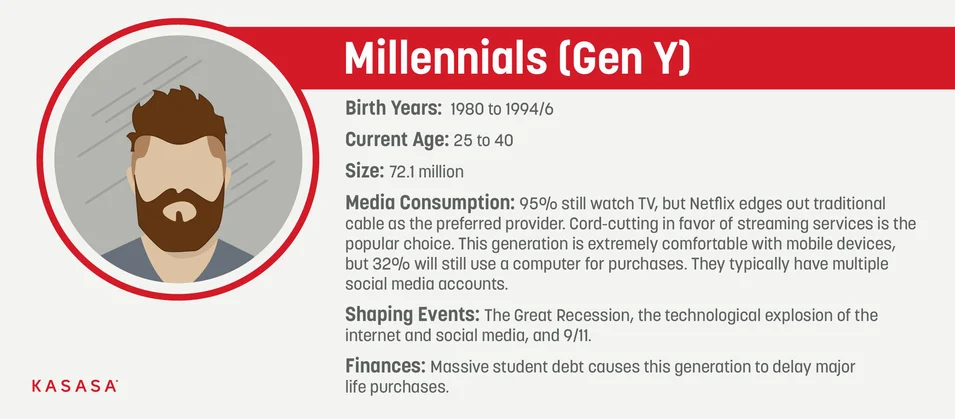 (Source: kasasa.com)
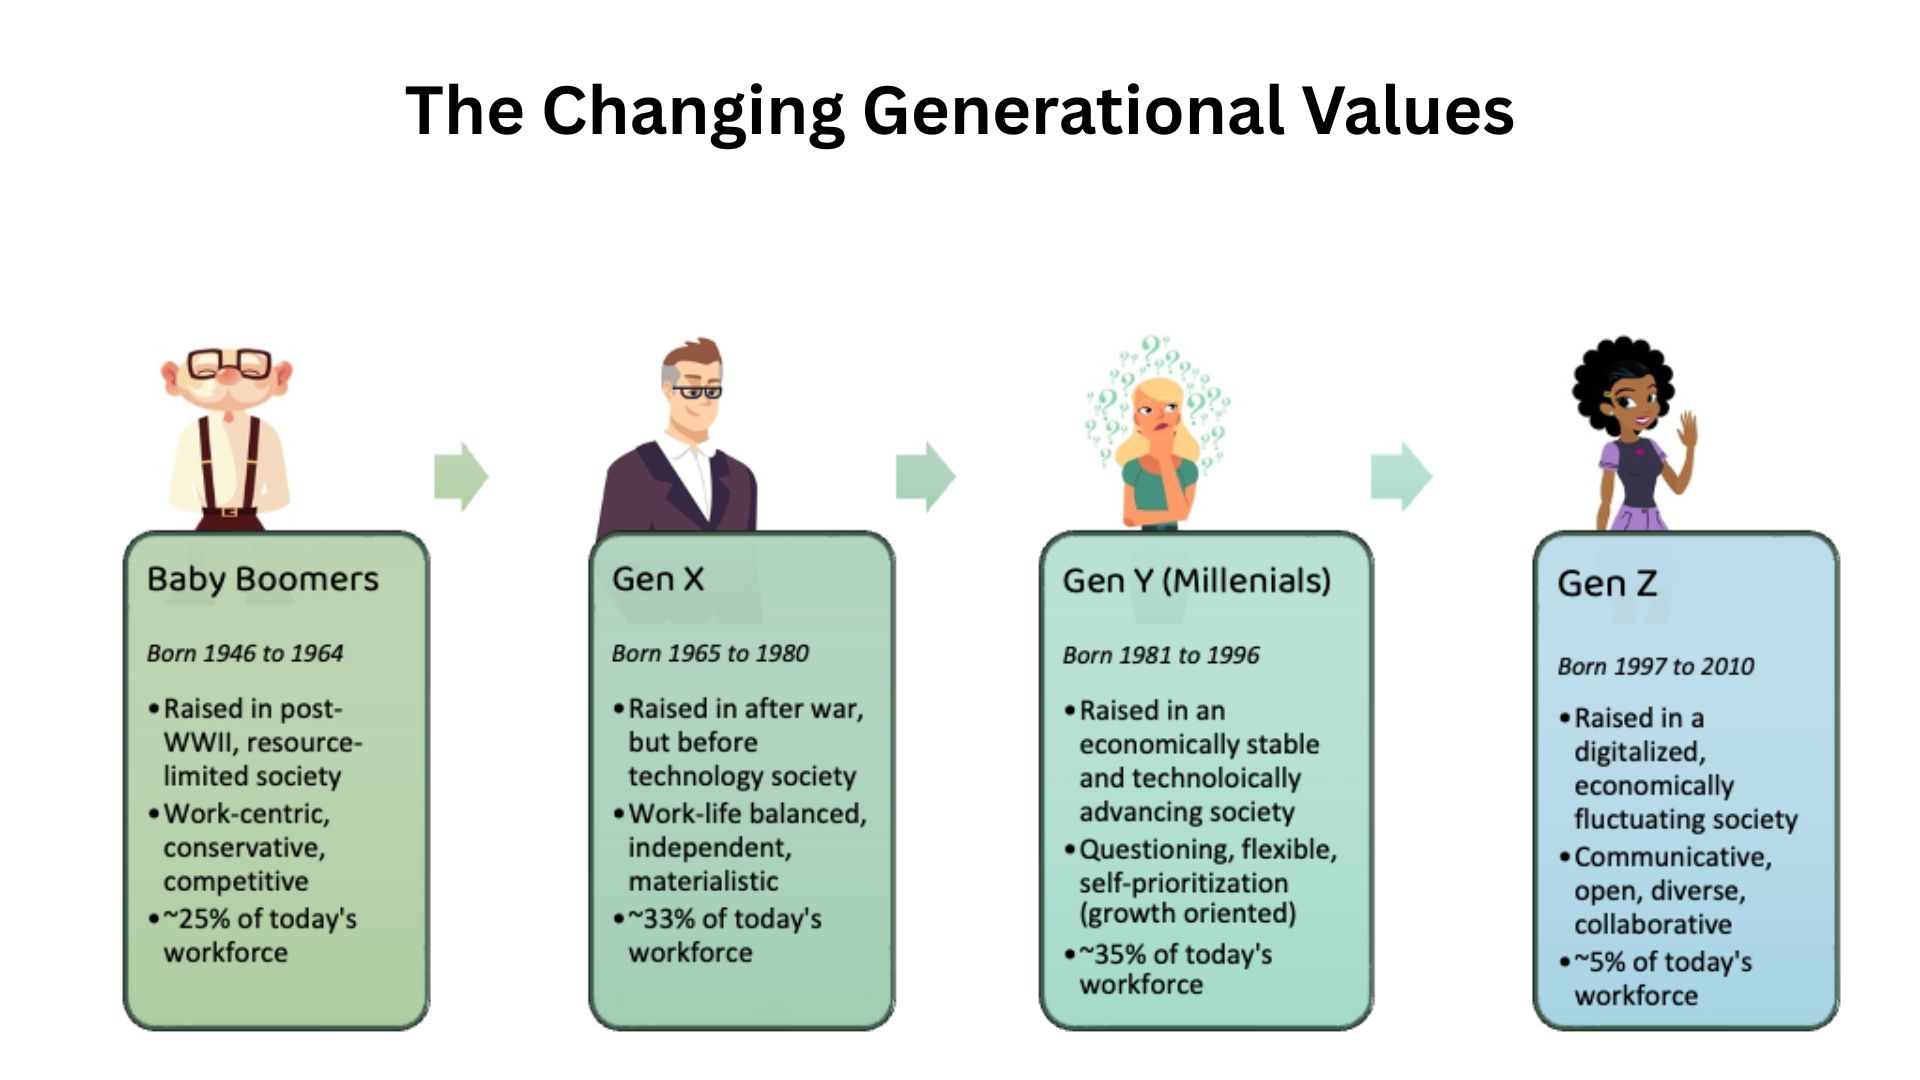
- Born approximately between 1981 and 1996, that gives us a roughly 15-year range. According to Pew Research, that’s the standard framing.
- This means in 2025, Gen Y is about 29 to 44 years old. I find it interesting that the range captures millennials entering their late 30s, early forties now.
- The name Gen Y came right after Gen X, basically meaning the next one. Most people now say Millennials, but the stats often still label them Gen Y. It’s useful to know both terms when searching data.
| Factor | Details |
| Birth years | 1981 to 1996 (Pew Research standard) |
| Age in 2025 | 29 to 44 years old |
| Alternative name | Millennials |
Population Size and Share
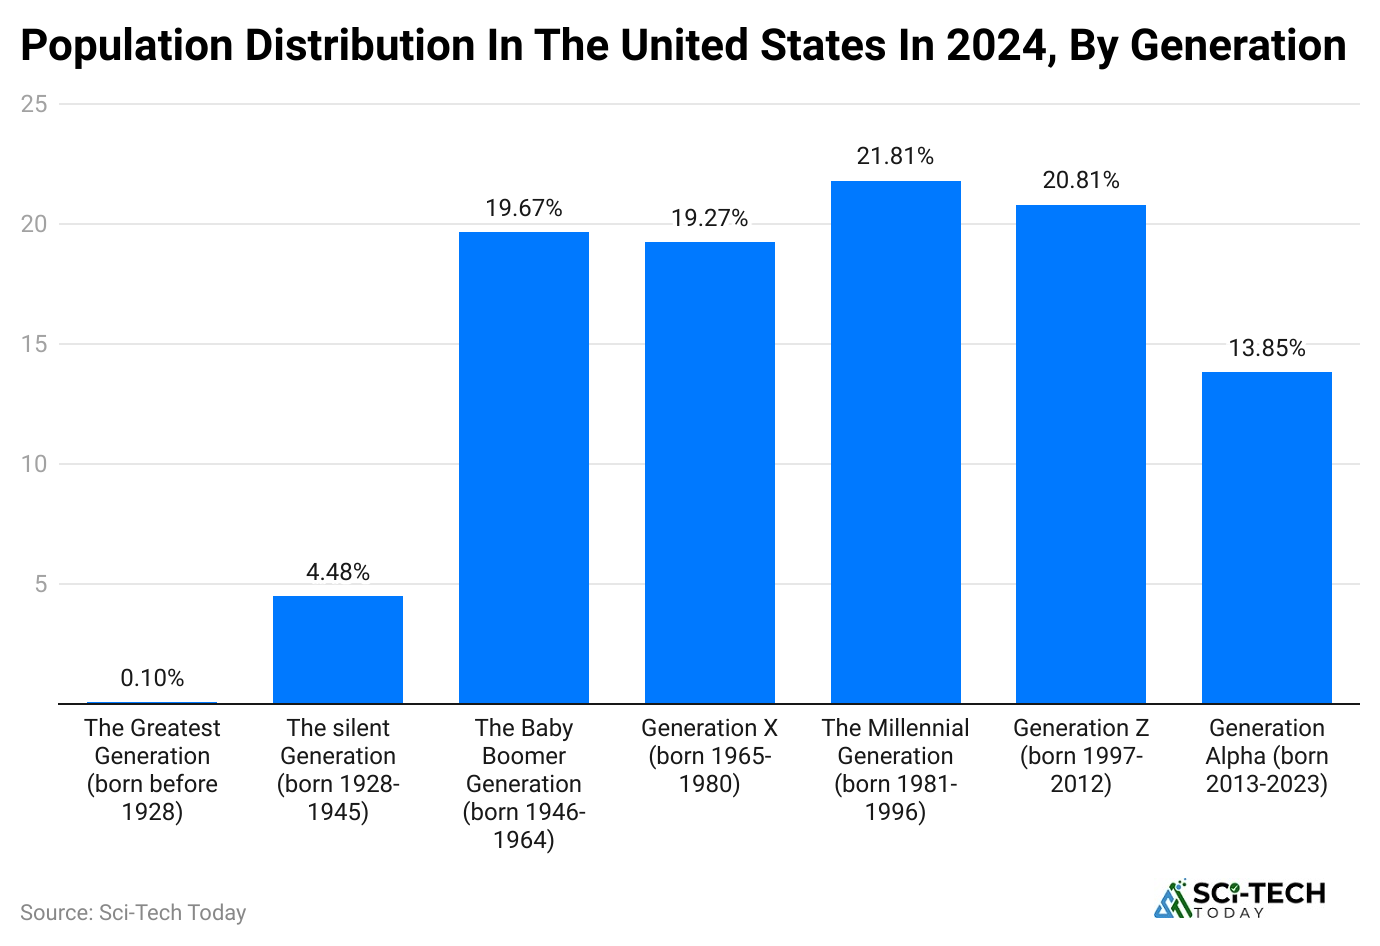 (Reference: statista.com)
- In the US, Gen Y is one of the largest generational cohorts. Pew estimates 72.1 million millennials in the US as of recent data. That’s more than both Gen X (65M) and Baby Boomers (71M) for a while.
- Globally, the number’s much higher, over 1.8 billion millennials worldwide, assuming roughly 25% of the world population lies in that age bracket right now. That’s based on a 2025 world population of 8 billion.
| Region | Gen Y Count |
| United States | 72 million |
| Global | 1.8 billion |
Education Levels
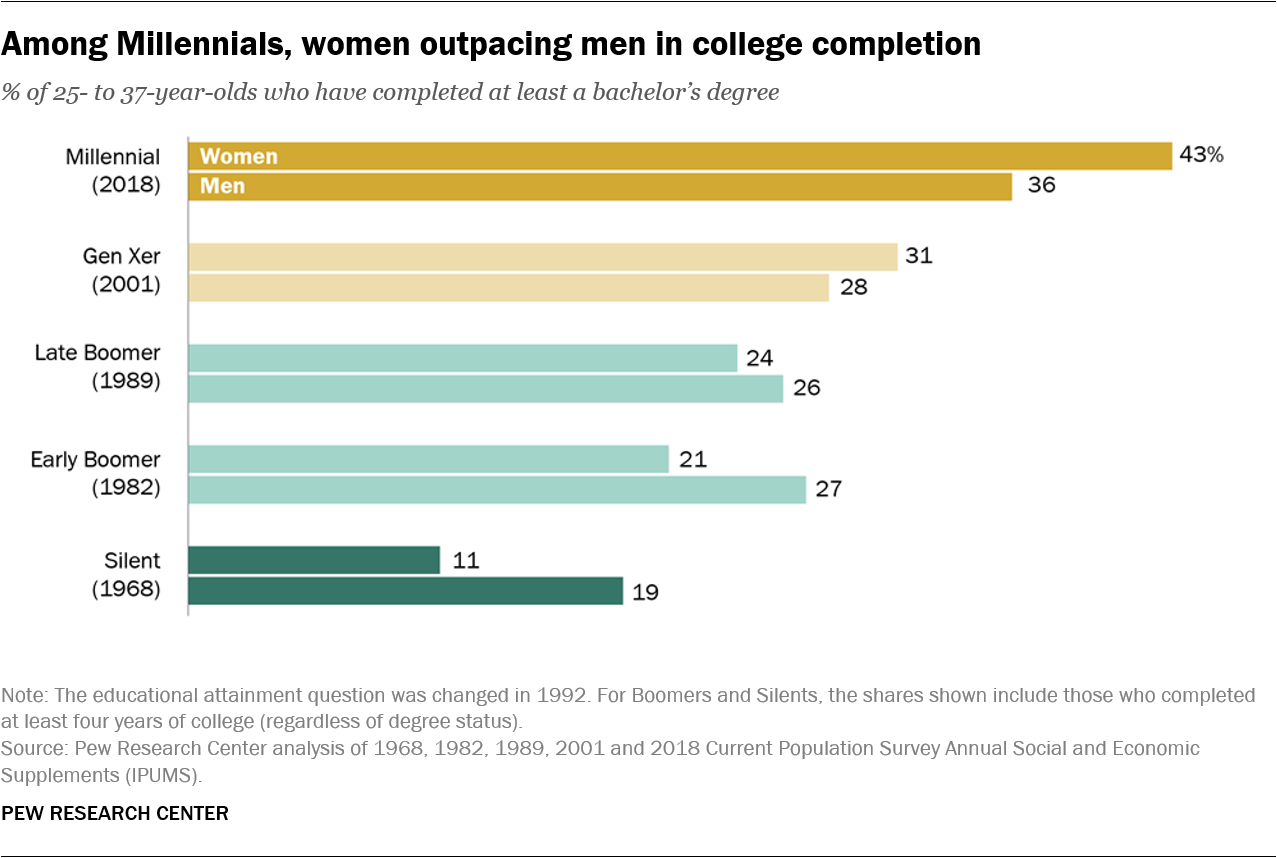 (Source: pewresearch.org)
- In the US, around 25% of Gen Y holds a bachelor’s degree or higher. Roughly 42% have an associate degree or some college experience. This makes them the most educated generation so far.
- They show a high student debt burden; the average in the US is around $36,000 per borrower for Gen Y. That’s a heavy weight, affecting savings, homebuying, and family planning.
| Education Level | Gen Y Share |
| Bachelor’s degree or higher | 25% |
| Some college/associate degree | 42% |
| Average student debt (US) | $36,000 per borrower |
Income and Economic Indicators
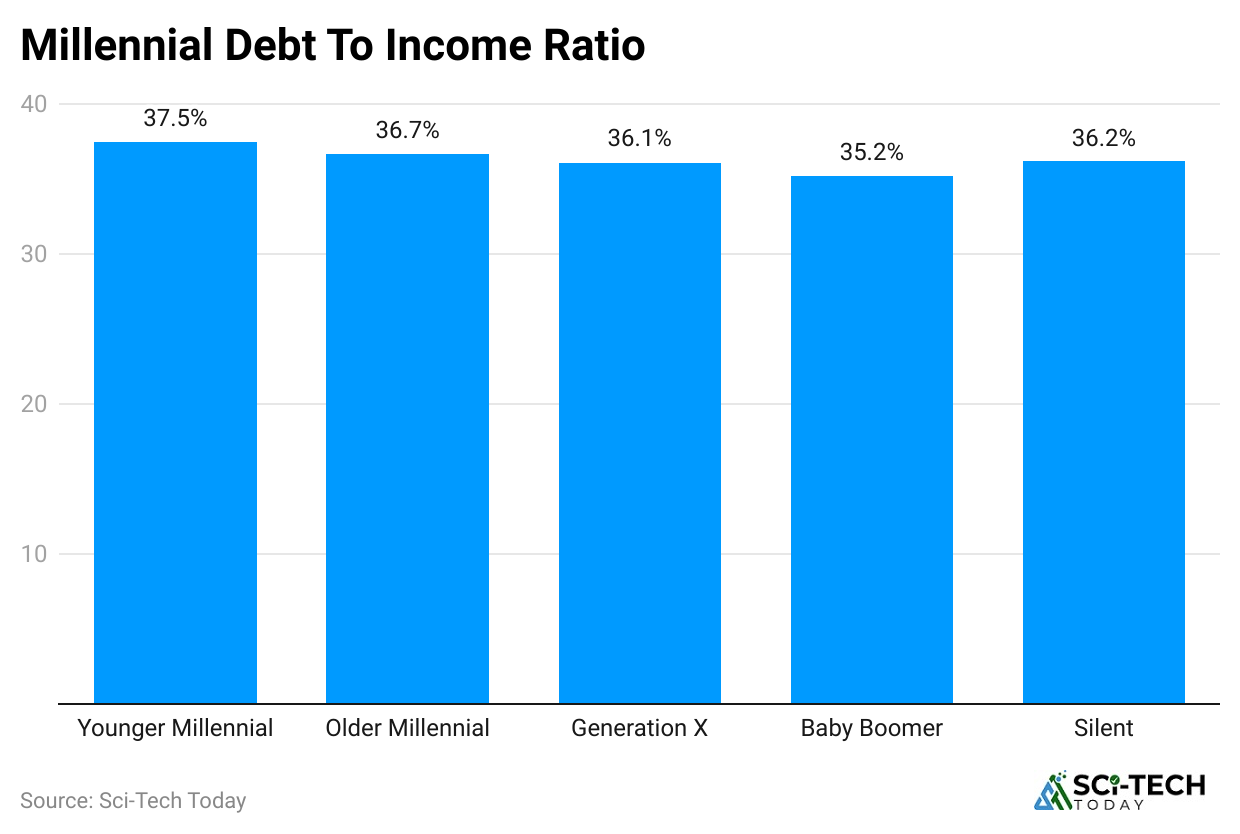 (Reference: tokenist.com)
- Median annual individual income for Gen Y in the US is about $50,000, though it ranges a lot depending on age. Younger millennials (29 to 34) average around $40,000, older ones (40 to 44) nearer $60,000.
- Household income for Gen Y tends to average around $80,000, as many are homeowners or dual-income families now.
| Demographic | Median Income (US) |
| Individual (younger) | $40,000 |
| Individual (older) | $60,000 |
| Gen Y overall individual | $50,000 |
| Gen Y household | $80,000 |
Employment and Job Stability
 (Reference: goodhire.com)
- Unemployment rates for Gen Y in the US hover around 4 to 5%. That’s slightly above Gen X but lower than Gen Z, reflecting the still-recovering job market post-pandemic.
- About 70% of Gen Y work full-time, 15% part-time, and 10% are self-employed or freelancers. They’ve embraced gig-economy roles more than previous generations.
| Employment Type | Percentage |
| Full-time | 70% |
| Part-time | 15% |
| Freelance / self-emp | 10% |
| Unemployment rate | 4 to 5% |
Homeownership and Living Situations
 (Reference: curbed.com)
- The homeownership rate among Gen Y is about 45%, lower than Gen X’s 50 to 55% at the same age in the past. So, affordability is a big issue, student debt, and rising prices matter.
- Around 25% still live with parents, significantly higher than previous generations at similar age peaks. One reason is the cost of living and housing affordability, higher rents, and slower wage growth.
| Situation | Gen Y Share |
| Homeowners | 45% |
| Living with parents | 25% |
Family and Fertility Patterns
 (Source: wordpress.com)
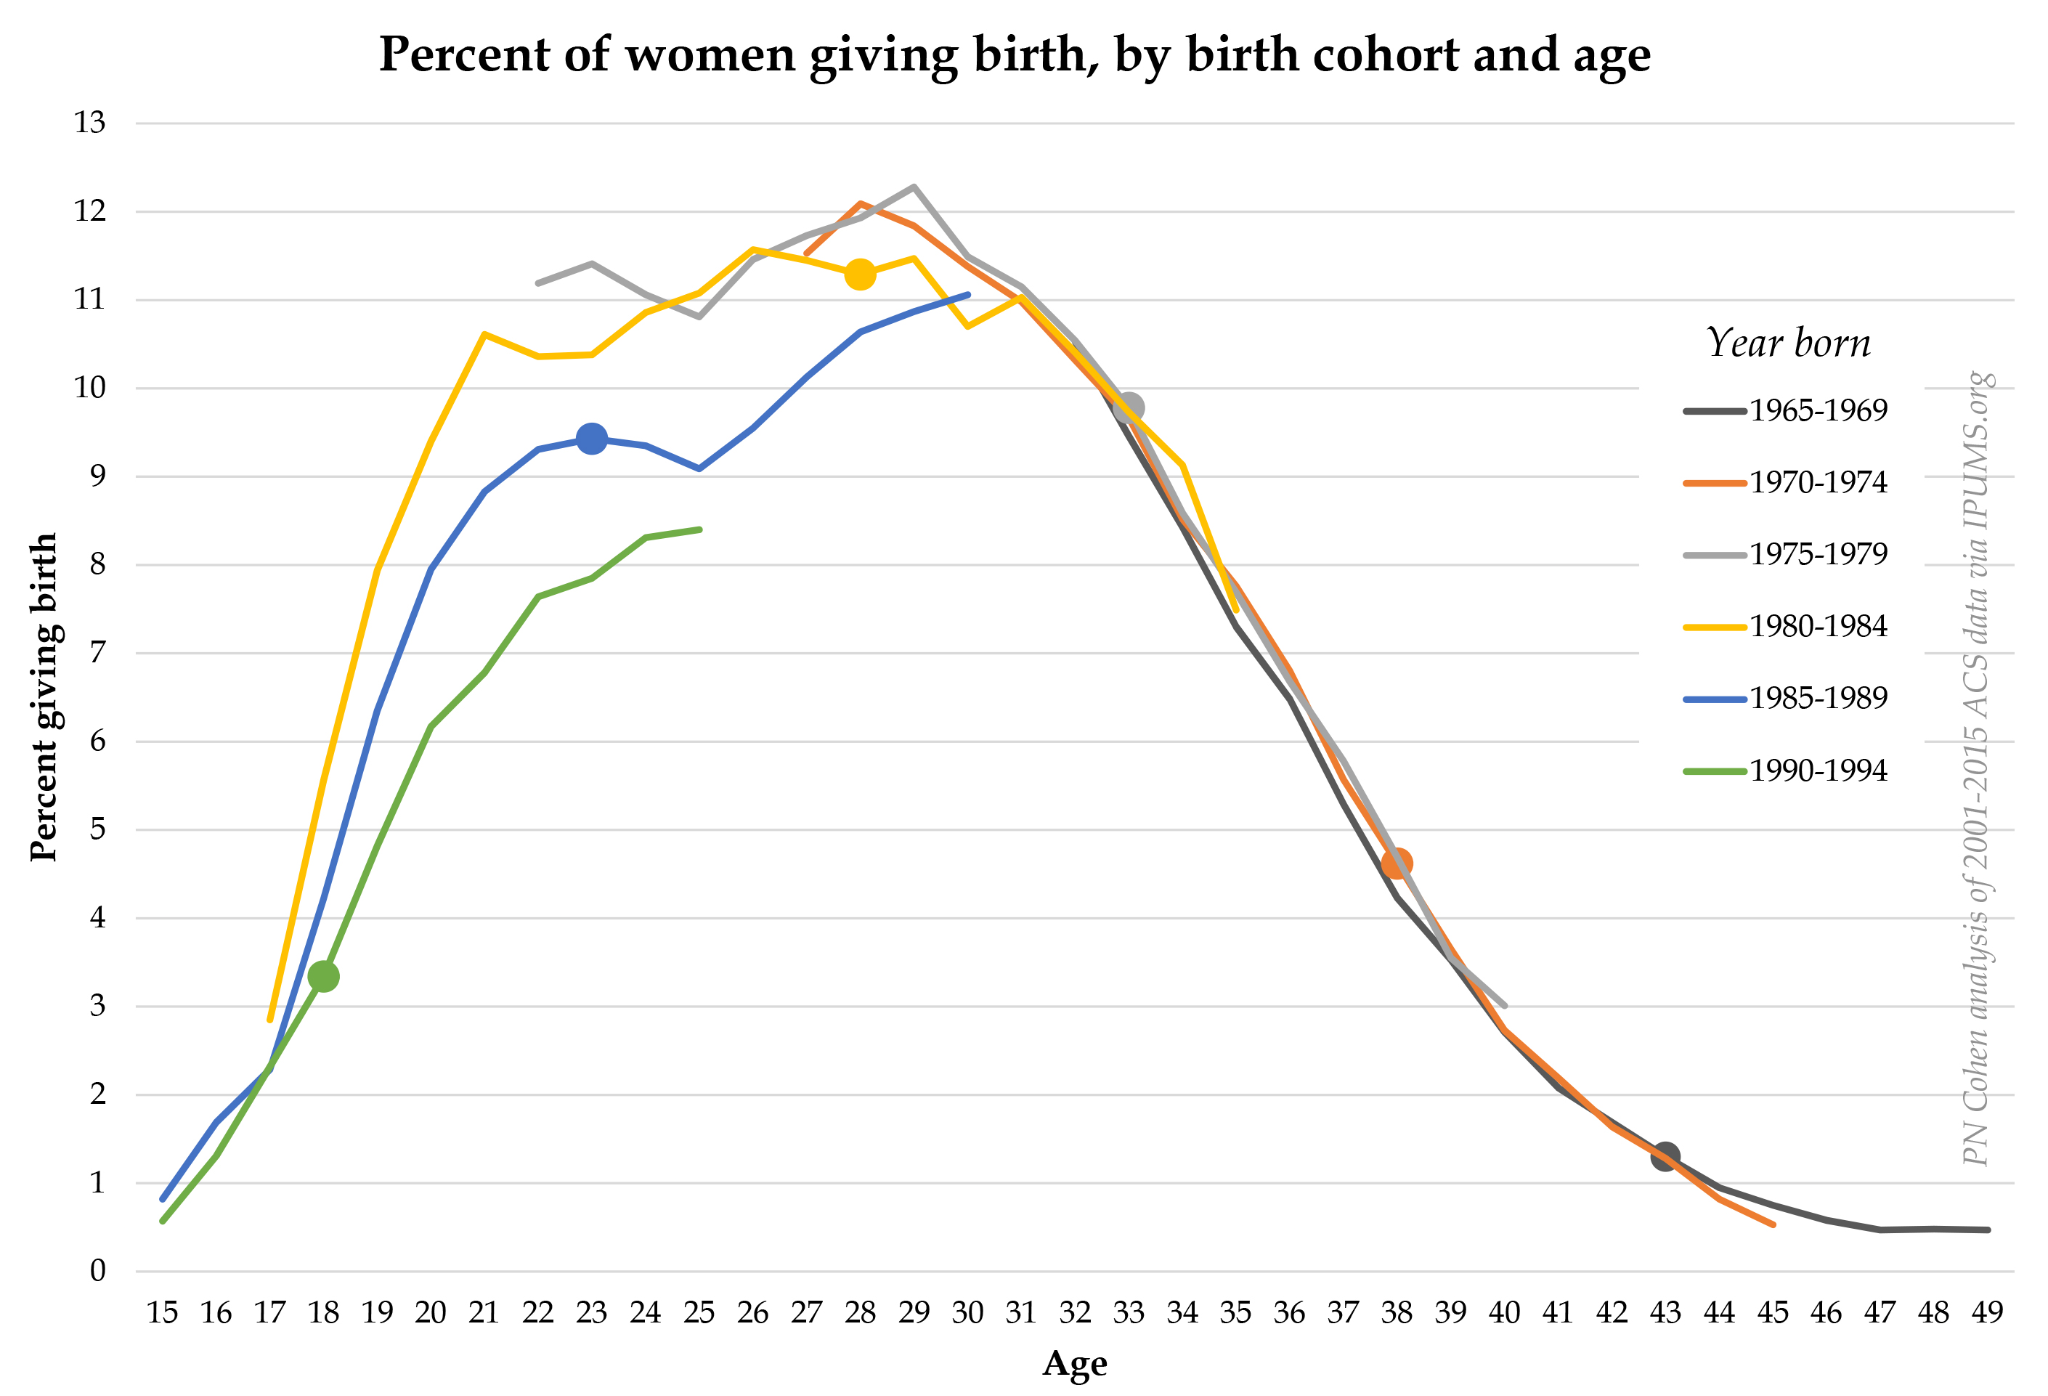
- The average age for first-time moms in Gen Y is around 26 to 27, compared with the early 20s in prior generations. Delayed marriage and career focus play a role.
- Gen Y couples tend to have 1.8 children on average, lower than the replacement rate of 2.1, pointing to slower population growth overall.
| Metric | Value |
| Avg age at first childbirth | 26 to 27 years |
| Avg number of children per couple | 1.8 |
Tech Use and Digital Habits
 (Source: pewresearch.org)
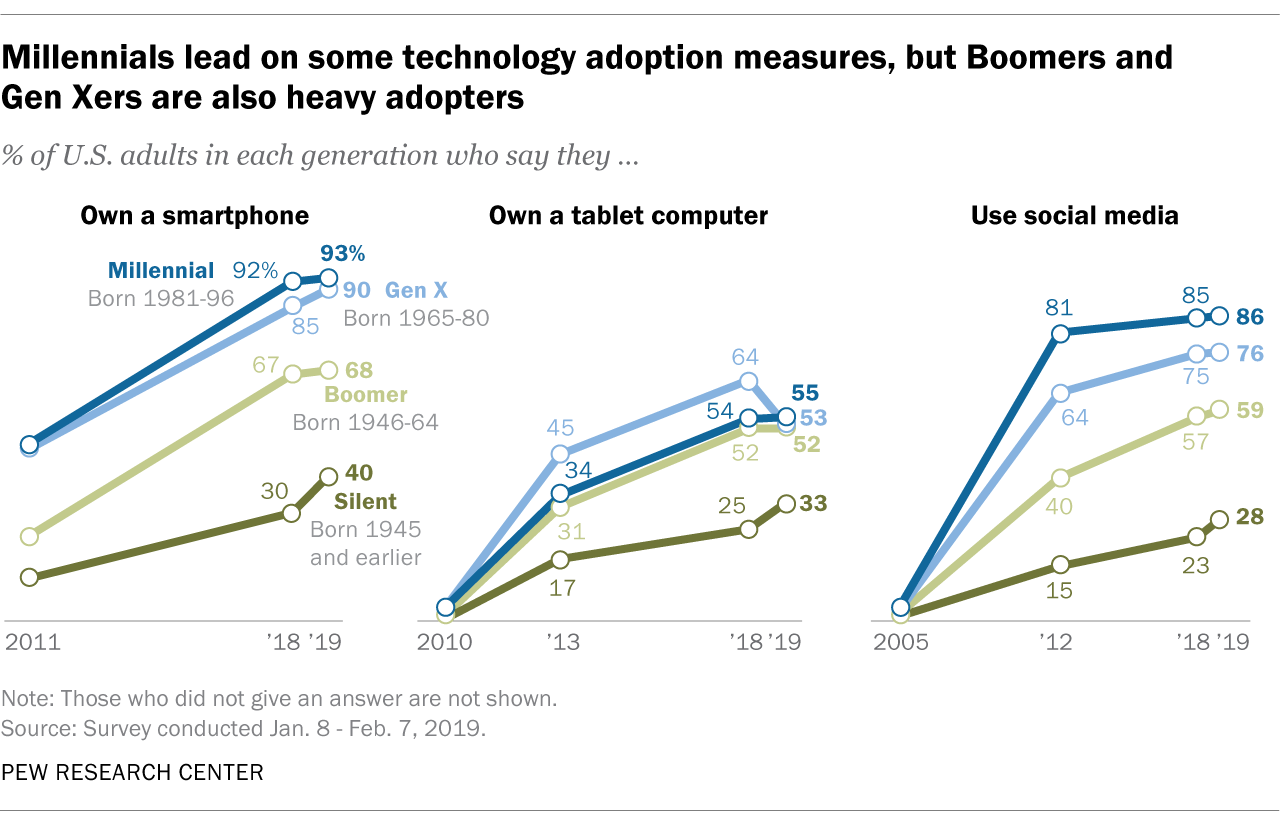
- Digital natives, kind of, Gen Y grew up alongside the internet. Roughly 95% use a smartphone daily, 90% are active on social media at least once a week.
- They spend around 3 to 4 hours on mobile devices per day on average. Streaming content usage is high, 80% subscribe to at least one service like Netflix, Spotify, etc.
| Behavior | Gen Y Share / Avg Time |
| Daily smartphone users | 95% |
| Weekly social media active | 90% |
| Daily mobile device time | 3 to 4 hours |
| Streaming subscriptions | 80% |
Health and Well-Being
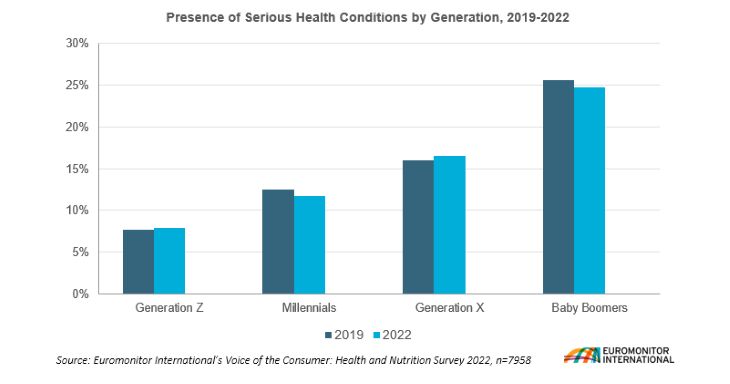 (Source: euromonitor.com)
- Gen Y reports higher stress levels compared to Gen X/Early Boomers at the same age. On a scale of 1 to 10, average self-reported stress is about 6.5.
- Mental health issues, especially anxiety and depression, are more common. Around 30% report having experienced some form of anxiety disorder, versus 18% for Gen X at the same stage.
| Issue | Gen Y Estimate |
| Avg stress level | 6.5 / 10 |
| Anxiety disorder rate | 30% |
Social Values and Lifestyle
 (Source: imagine.jhu.edu)
- Gen Y cares about purpose, 70% say they prefer a job that matters socially over just one that pays well. That’s far higher than Gen X, where only 55% said the same.
- Sustainability matters; around 60% will pay extra for eco-friendly products, and nearly 50% actively seek brands that they feel align with their values.
| Attitude / Behavior | Gen Y Share |
| Prefers a purpose-driven job | 70% |
| Will pay more for eco-friendly | 60% |
| Brands matching values | 50% |
Financial Behavior and Savings
 (Source: researchgate.net)
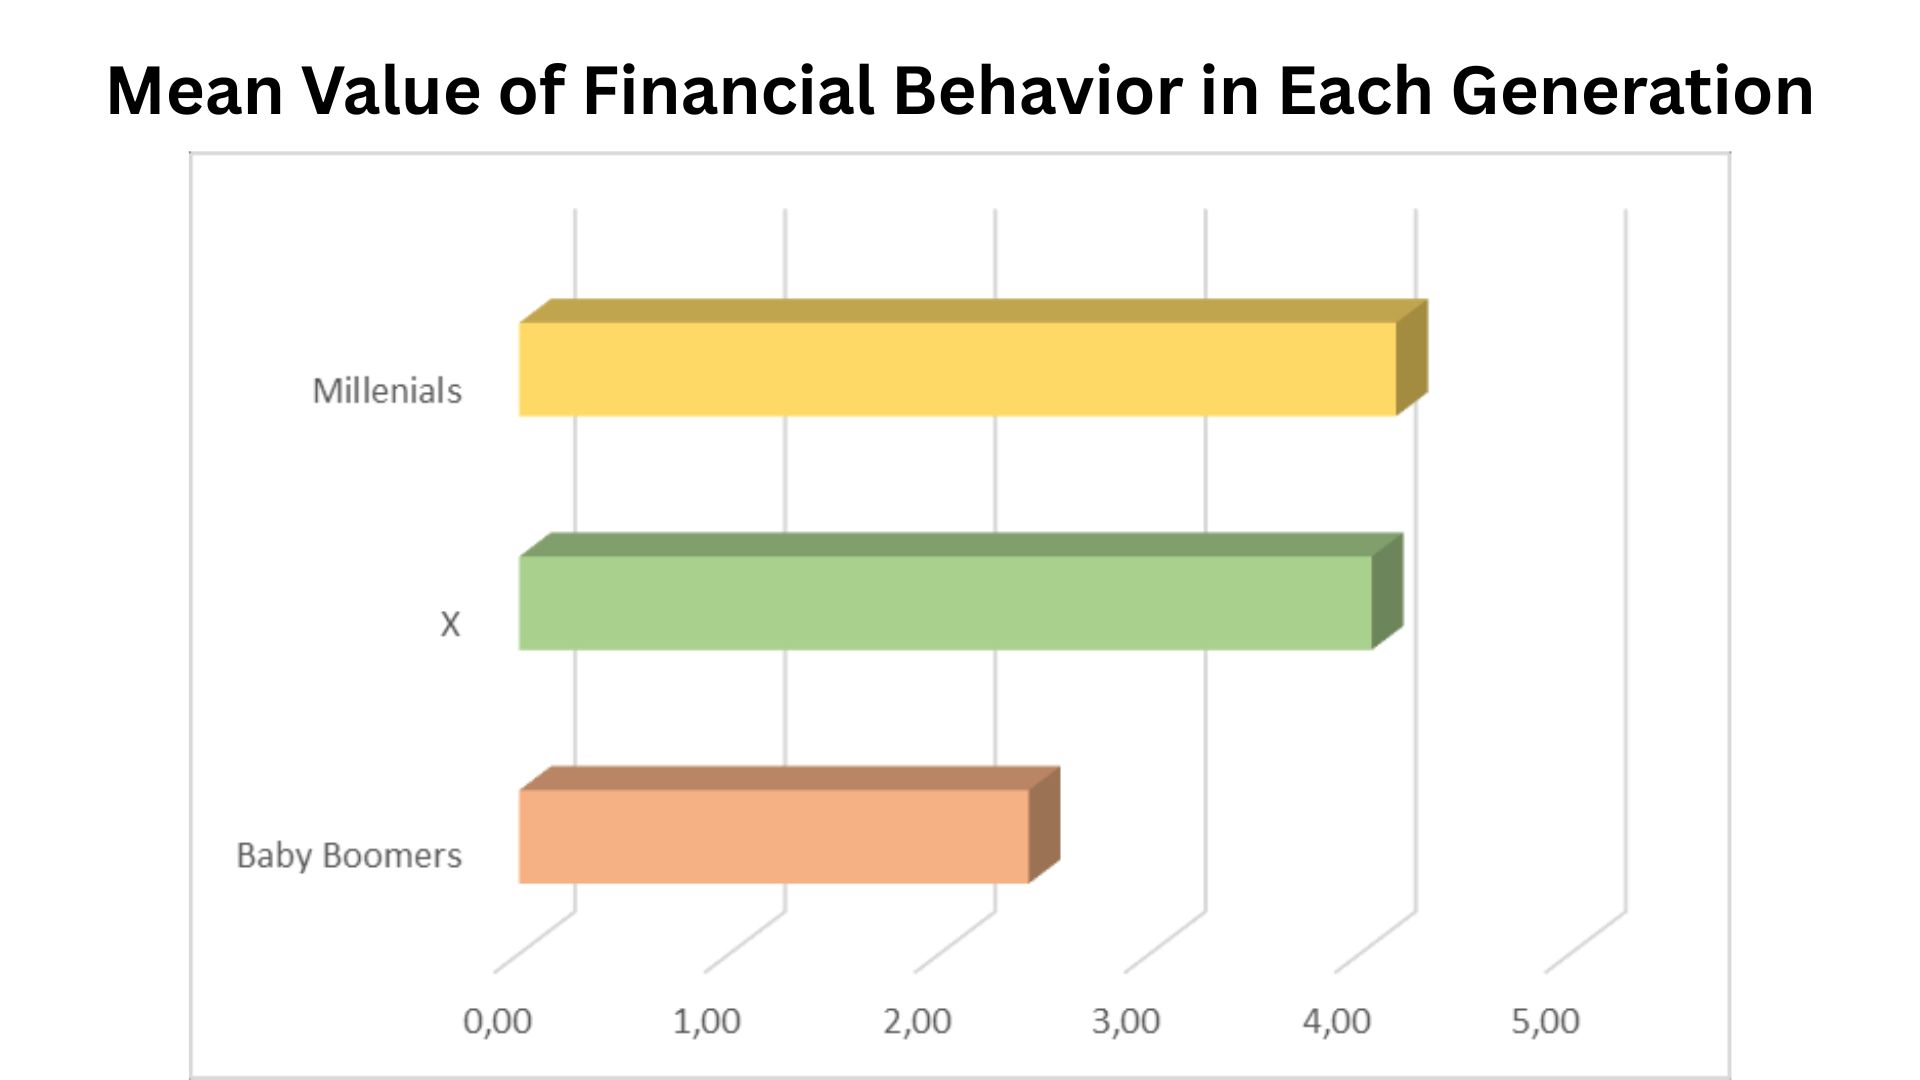
- The savings rate among Gen Y is relatively low. Only 30% consistently set aside 10% or more of their income into savings or retirement accounts.
- Investment behavior: roughly 40% of Gen Y have some form of investment beyond retirement accounts, stocks, mutual funds, crypto, etc. Many rely on robo-advisors.
| Behavior | Gen Y Share |
| Saving ≥10% of income | 30% |
| Investing beyond retirement | 40% |
Travel and Experiences
 (Reference: luggagehero.com)
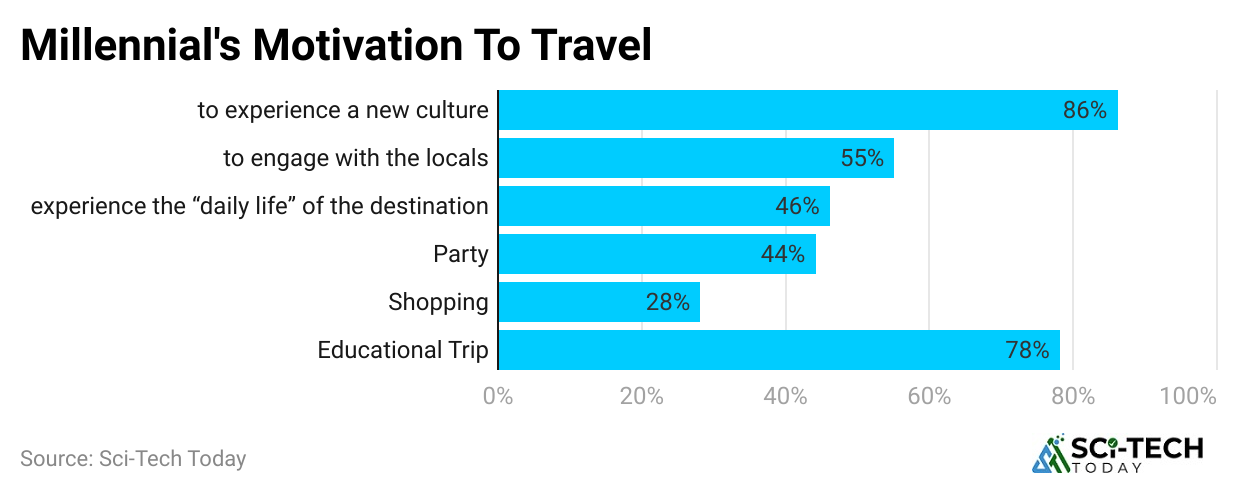
- Experience over stuff, Gen Y spends more on travel, concerts, and food experiences. Annually, they spend about $1,500 per person on travel within the country and $2,500 on international travel.
- 65% consider travel as a big part of life satisfaction, ranking higher than possessions like cars or big houses.
| Expense Type | Gen Y Avg Annual Spend |
| Domestic travel | $1,500 |
| International | $2,500 |
Conclusion
Looking at all these Gen Y statistics, it’s clear that this generation has changed the world in more ways than we usually give them credit for. They’re not just the internet kids or the ones obsessed with social media. They’re highly educated, they’ve lived through major financial and social shifts, and they’re now the ones driving today’s economy, culture, and values.
Yes, they face challenges like debt, housing costs, and higher stress, but at the same time, they’ve pushed for things that matter, purpose in work, sustainability, diversity, and more experiences. Whether it’s the way they spend money, raise families, or even how they travel, these numbers tell us that Gen Y continues to change what success and happiness mean in the modern world.
So when you hear the word Millennials or Gen Y, remember it’s not just a label. Behind it are millions of people whose choices, struggles, and achievements. We’re all heading into. And that’s exactly why keeping an eye on Gen Y statistics isn’t just interesting, it’s necessary. So, I hope you like this article. If you do so, kindly let me know in the comments section. Thankyou.
