





Brief Overview
E-waste Statistics: In 2025, electronic waste (e-waste) generation became one of the fastest-growing and most complex waste streams globally. With constant new advancements, millions of tonnes of e-waste, starting from defunct smartphones and computers to household appliances, are thrown away every year.
This E-waste poses severe environmental and health threats to the surrounding environment and even to the people who are around the junkyard due to the presence of toxic substances like lead, mercury, and cadmium.
However, it also represents an unavoidable opportunity, functioning as a veritable “urban mine” for the recovery of critical raw materials. Governments, private industries, and consumers are increasingly aware that some conservative measures are urgently needed to tackle the mountain-like challenges of e-waste management and to capture the enormous economic value within these non-usable devices.
So, in this article, we’ll have a walk around and an in-depth analysis of e-waste statistics to let you know about the growing market and how you can make use of it. Let’s get started.
Handpicked By The Editor
- The annual generation of e-waste is currently rising 5x faster than the world’s documented capacity for e-waste.
- Experts project that the documented global collection and recycling rate will drop even further to 20% by 2030.
- Only 1% of the global demand for essential rare earth elements, which are crucial for modern technologies like renewable energy systems.
- In the United States, roughly 151 million mobile phones are tossed out annually, and recycling just one million of these phones can recover over 35,000 pounds of copper and 75 pounds of gold.
- Manufacturing a single computer and its screen requires enormous resources, including at least 240 kg of fossil fuels, 22 kg of chemicals, and 1.5 tonnes of water.
Global E-waste Generation Analysis
(Reference: theroundup.org)
- The UN’s 2024 Global E‑waste Monitor confirms that 62 million tonnes (Mt) of e‑waste were generated worldwide in 2022, up 82% from 2010.
- This volume of e-waste is increasing at an annual rate of 2.6 million tonnes, showing a continuous and steep upward trajectory that far surpasses attempts at containment.
- Projections suggest that by 2030, the global annual production of e-waste will soar to 82 Mt.
- In the most dire “business-as-usual” scenarios, some long-range forecasts even suggest that the total annual amount of e-waste could more than double by 2050, potentially reaching around 100 million tonnes.
- While e-waste only constitutes about 3.1% of the estimated 2.56 billion tonnes of total municipal solid waste generated annually.
| Year | Global E-waste Generated (Million Tonnes) |
| 2023 | 60.2 |
| 2024 | 62 |
| 2025 | 66.6 |
| 2030 | 82 |
| 2050 | 100 |
Economic Value And Material Composition
(Reference: mdpi.com)
- The total monetary value of the raw materials embedded within the 62 Mt of e-waste generated in 2024 was conservatively estimated at USD 91 billion before processing costs.
- Out of this massive value, only approximately USD 28 billion worth of materials were recovered through documented and environmentally sound recycling efforts.
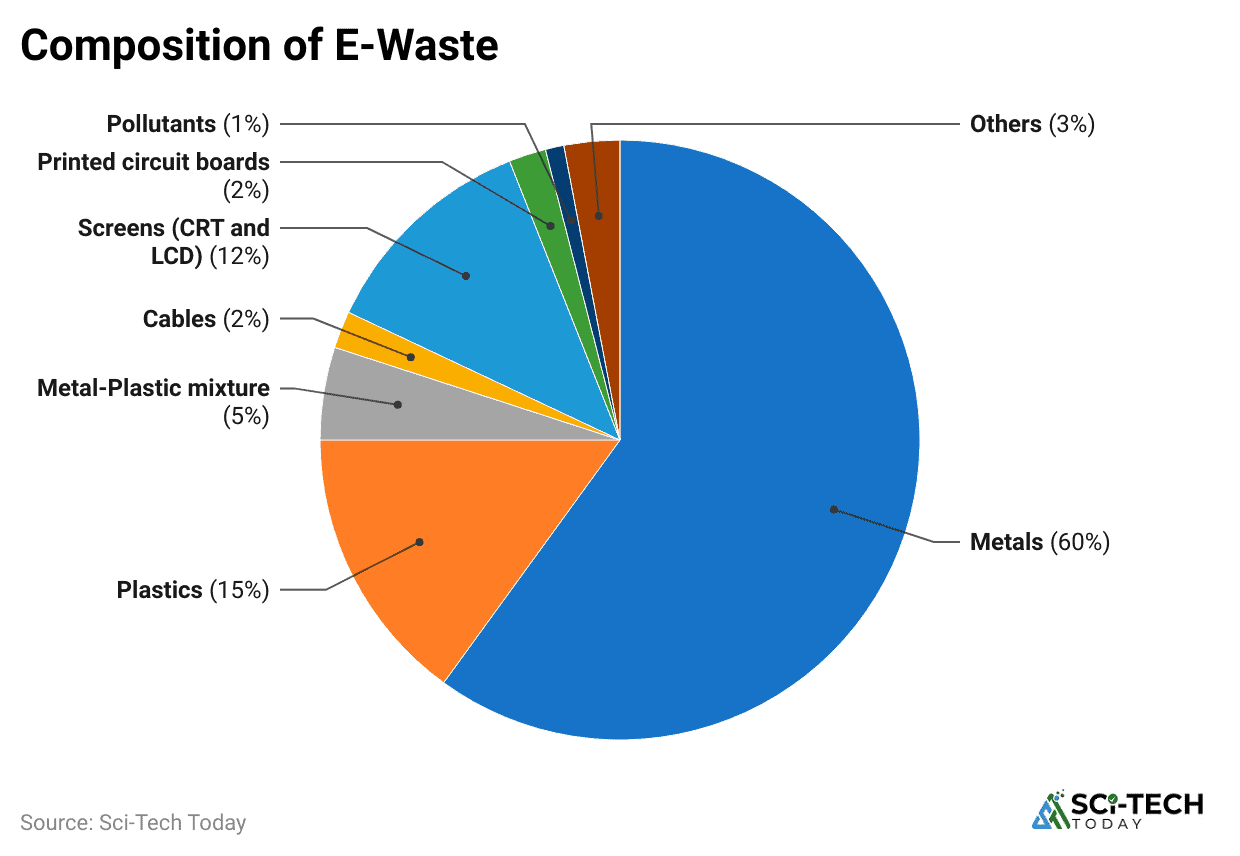
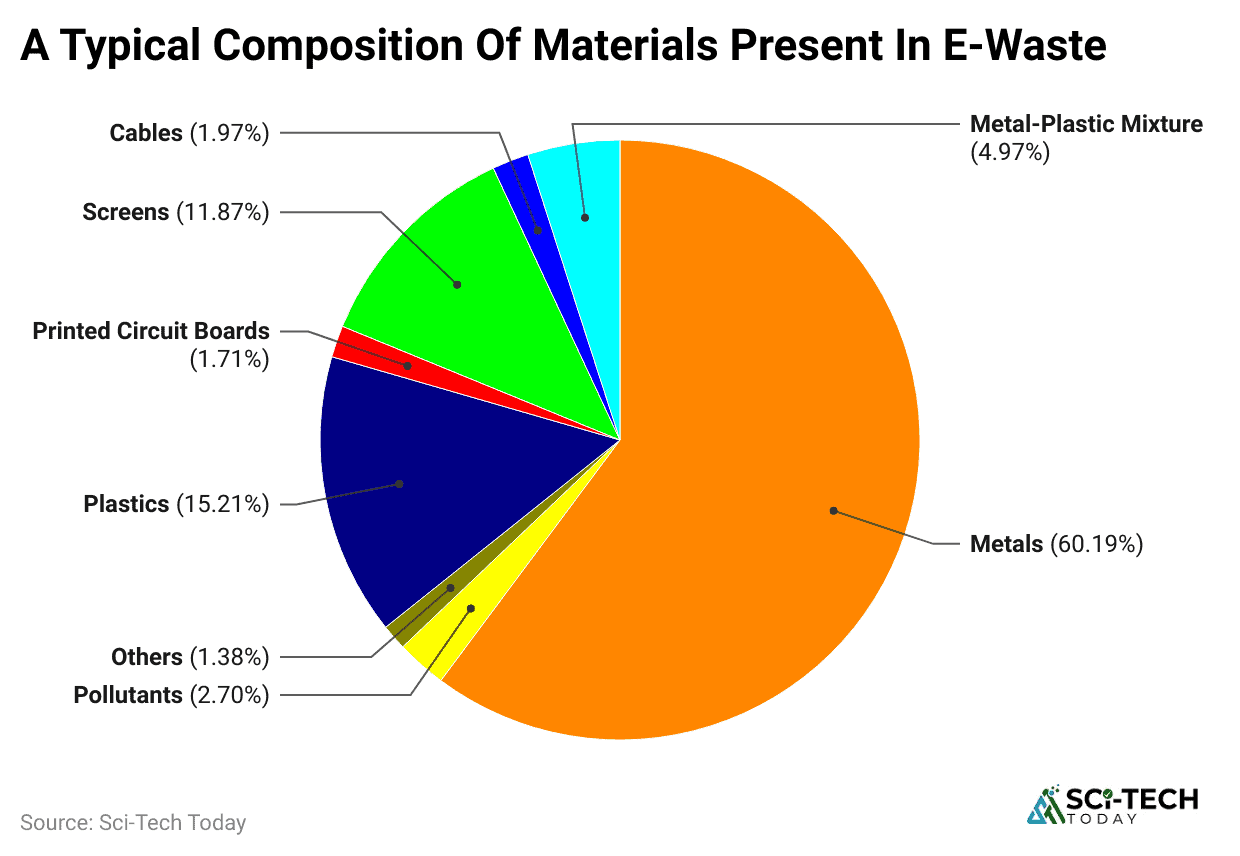
- The vast material composition of e-waste includes an estimated 31 million tonnes of metals, 17 million tonnes of plastics, and 14 million tonnes of other materials like glass and composites, all ripe for recovery.
- Focusing solely on gold, some data suggests that one tonne of circuit board scrap can contain 40 to 800 times more gold than a tonne of primary gold ore.
- 99% of rare earth elements (REEs) used in electronics are not currently recycled, which is a major concern given their importance and concentrated supply chain dependence.
| Material Embedded in E-waste (2022 Estimates) | Estimated Mass (Million Tonnes) | Estimated Value (US$ Billion) |
| Metals (Ferrous & Non-ferrous, Precious) | 31 | 91 (Total Material Value) |
| Plastics | 17 | Not readily quantifiable in this context |
| Other Materials (Glass, Minerals) | 14 | Not readily quantifiable in this context |
| Gold (within Metals) | Minor Fraction | 15 |
| Copper (within Metals) | Minor Fraction | 19 |
E-Waste By Equipment Type
(Reference: dtpgroup.co.uk)
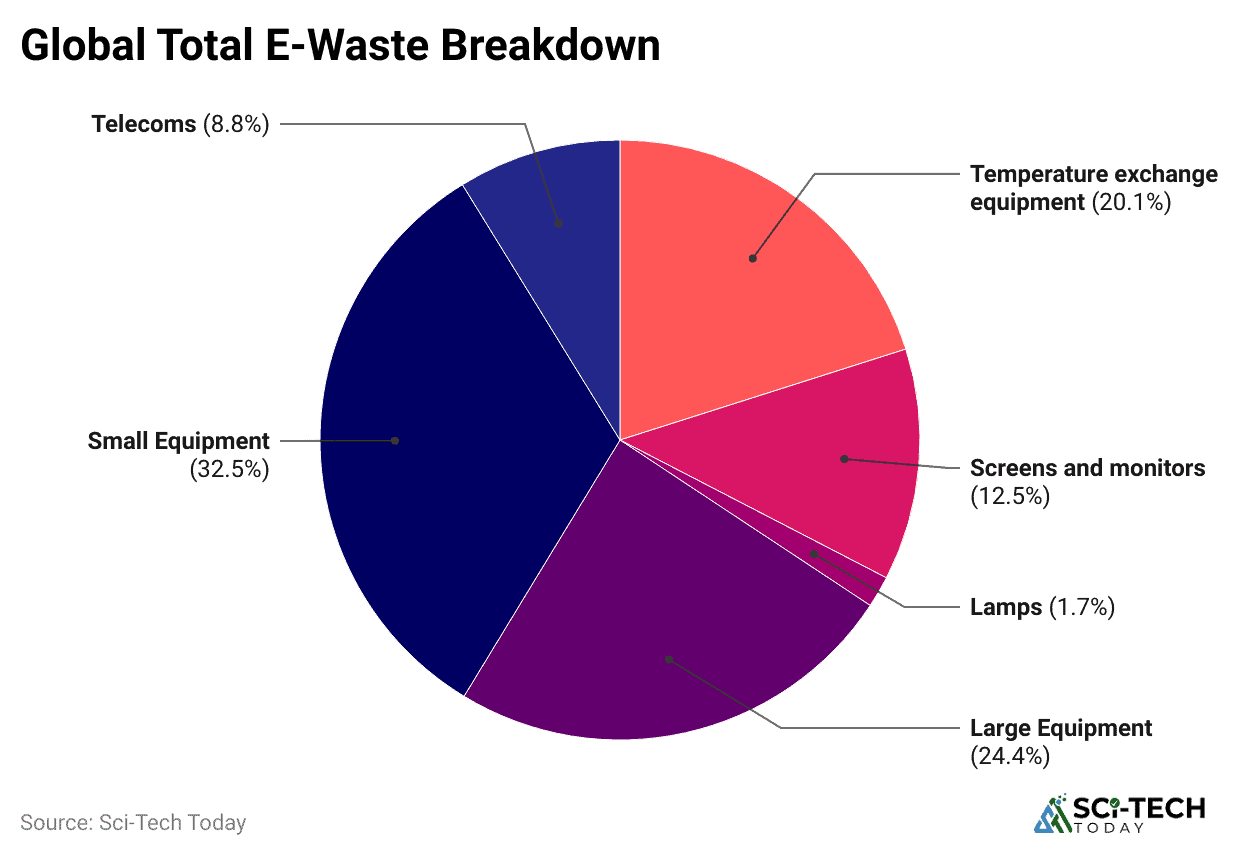
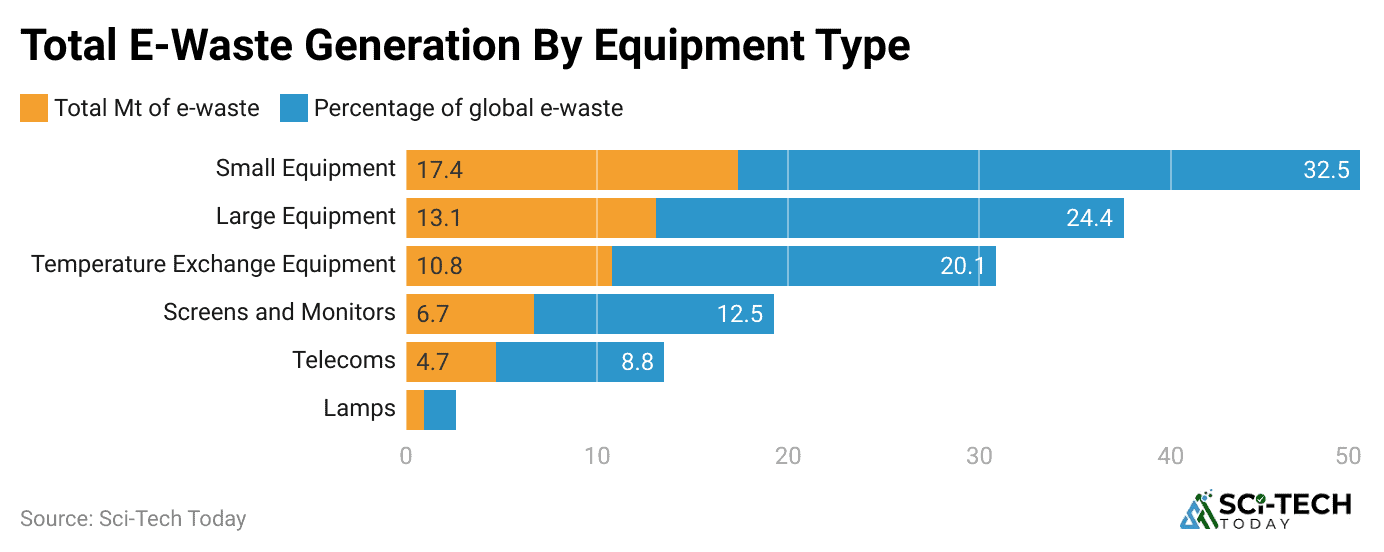
- Small equipment, a category including microwaves, vacuum cleaners, toys, and e-cigarettes, accounted for the largest share of e-waste by mass, contributing 20.4 million tonnes (33% of the total) in 2024.
- The collection rate for this massive category of small equipment is alarmingly low, with only about 12% of this e-waste being formally documented as collected and recycled.
- Large equipment, such as washing machines, large printers, and photovoltaic (solar) panels, was the second largest category, contributing 13.1 million tonnes (21.1%) to the global pile in 2025.
- Temperature exchange equipment, like refrigerators and air conditioners, made up a significant portion, generating 10.8 million tonnes (17.4%) and contributing to global warming through the release of potent refrigerants.
- Small IT and telecommunication equipment, which includes high-value items like mobile phones, laptops, and routers, contributed approximately 4.6 million tonnes and saw a documented recycling rate of only 22%.
- The volume of retired photovoltaic panels is a growing concern, projected to reach 2.4 million tonnes by 2030, a fourfold increase from the 600,000 tonnes generated in 2022.
- The smallest documented fraction came from lamps (light sources), which contributed 0.9 million tonnes (1.5%) of the total global e-waste in the measurement year.
| E-waste Category (2022) | Mass Generated (Million Tonnes) | Percentage of Total E-waste | Documented Recycling Rate |
| Small Equipment (Toys, Microwaves) | 20.4 | 33.0% | 12% |
| Large Equipment (Appliances) | 13.1 | 21.1% | Higher than average (Due to bulk) |
| Temperature Exchange (AC, Fridges) | 10.8 | 17.4% | Highest of all categories |
| Small IT & Telecom (Phones, Laptops) | 4.6 | 7.4% | 22% |
| Screens & Monitors | 6.7 | 10.8% | Higher than average |
The E-Waste Management Market
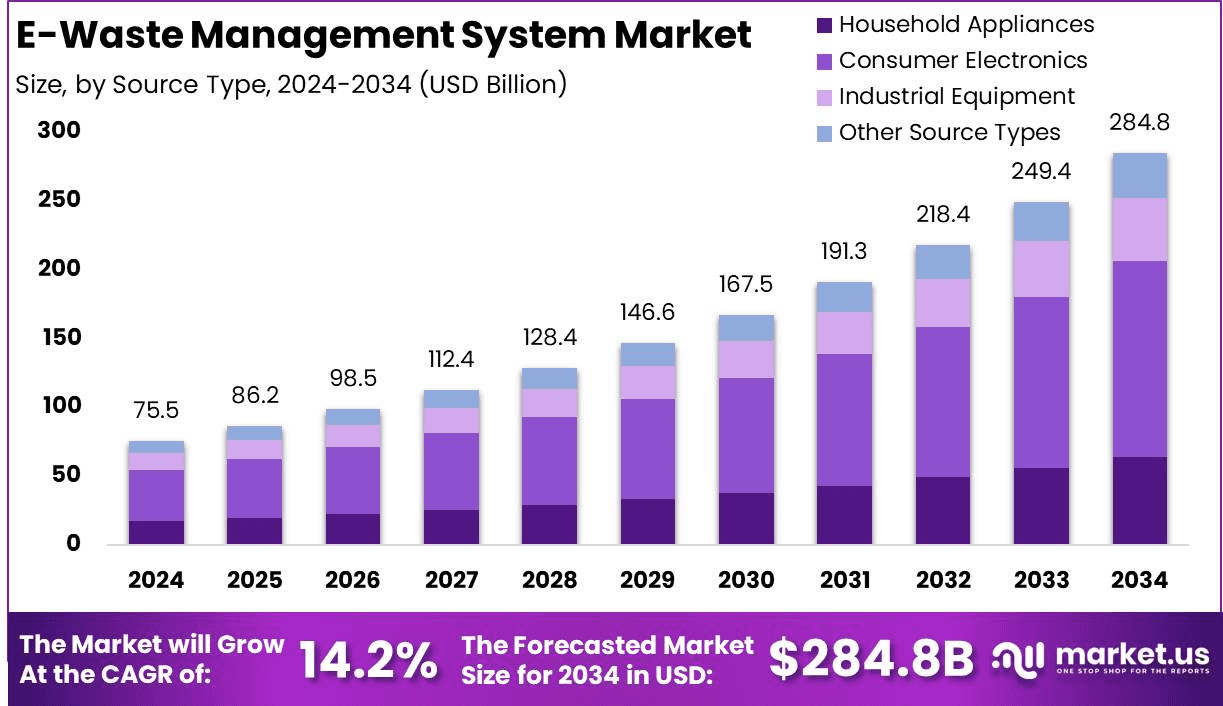
(Source: market.us)
- The global E-waste Management Systems market was valued at over USD 86.2 billion in 2025 and is projected to reach a valuation of over USD 167.5 billion by 2030.
- In the market for E-waste Management, the recovery of Metals consistently leads the material division, making up more than 65.8% of the total market share due to the high concentration and value of materials like aluminum, copper, and gold.
- Consumer Electronics, including smartphones, laptops, and peripherals, is the dominant source of e-waste feeding the management market, commanding over 49.9% of the market share.
- Regionally, the Asia Pacific area holds the largest market share in E-waste Management, accounting for over 48.1% of the total market value.
- The disposal application segment of the E-waste Management market, which includes environmentally sound final disposal of non-recoverable materials, took more than 76.0% of the total market share.
- The economic opportunity in countries like India is immense; one study suggests the country’s e-waste management market could reach a valuation of USD 5,198.52 million by 2032.
| Market Segment | Leading Market Share (Approximate) |
| Material (Recovery Focus) | Metals (65.8%) |
| Source (Equipment Type) | Consumer Electronics (49.9%) |
| Application (Process Type) | Disposal (76.0%) |
| Region (Market Size) | Asia Pacific (48.1%) |
| Market Value Projection (By 2030) | USD 167.5 billion |
Regional Disparities In E-waste Management
(Reference: scoop.market.us)
- Europe holds the top spot for per capita e-waste generation globally, producing 17.6 kg per person in 2024, slightly ahead of Oceania at 16.1 kg per person.
- Despite being the highest per capita generator, Europe also boasts the highest documented collection and recycling rate globally, reaching 42.8% in 2024, thanks to robust legislation and well-developed recycling infrastructure.
- Asia remains the largest generator of e-waste by total mass, producing approximately 30 million tonnes in 2024, accounting for nearly 50% of the global total, driven by its massive population and rapid economic expansion.
- The Americas generated 14.1 kg per person of e-waste in 2024, but their documented collection and recycling rate lagged significantly behind Europe, hovering around 30%.
- In stark contrast, African countries formally recycle less than 1% of their total e-waste, highlighting a major gap in recycling infrastructure and policy enforcement across the region.
- A substantial 18 million tonnes of e-waste in low- and lower-middle-income countries are managed primarily by the informal sector, raising serious concerns about environmental safety and worker health.
- Transboundary shipment of e-waste remains a persistent global issue, with an estimated 5.1 million tonnes (8.2% of the global total) crossing borders in 2024, of which 65% moved uncontrolled from high-income to lower-income nations.
| Region | Per Capita E-waste (kg/person, 2024) | Documented Recycling Rate (%, 2024) | Total E-waste (Million Tonnes, 2024) |
| Europe | 17.6 kg | 42.8% | Significant (Approx. 12.3 Mt) |
| Oceania | 16.1 kg | 41.7% | Relatively Low |
| The Americas | 14.1 kg | 30% (Approx.) | Significant (Approx. 13.1 Mt) |
| Asia | Lower than others | Low (Approx. 12%) | 30 (Approx. 50% of global total) |
| Africa | Lowest per capita | 1% (Formerly) | Relatively Low |
Hazardous Materials In E-waste
(Reference: springer.com)
- E-waste contains numerous hazardous substances, including an estimated 45 tonnes of mercury and 79 kilotonnes of plastics with Brominated Flame Retardants (BFRs) in the undocumented waste flow in 2025.
- Mercury, often found in switches, sensors, and fluorescent lamps, is a potent neurotoxin that can cause chronic damage to the human brain and coordination system.
- Lead, historically used in CRT glass, solders, and batteries, accounts for up to 60% of the heavy metals found in some e-waste and is linked to severe damage to the central nervous system and kidney function.
- The informal recycling of e-waste, particularly through uncontrolled open burning of plastics and circuit boards, releases highly toxic dioxins and furans, known as persistent organic pollutants (POPs), that are carcinogenic.
- Improperly discarded temperature exchange equipment, like refrigerators and air conditioners, leaked an estimated 0.19 million tonnes of CO2-equivalent emissions in 2025 due to the release of ozone-depleting and potent greenhouse refrigerants.
- Cadmium, utilized in chip resistors and some batteries, accumulates in the kidneys and liver, with long-term exposure leading to toxicity.
- Recycling practices like acid leaching, used to recover precious metals, often result in the discharge of highly corrosive acid wastewater laden with heavy metals directly into nearby rivers and groundwater systems.
| Hazardous Substance | Example E-waste Source |
| Mercury | Switches, Relays, Flat-panel displays |
| Lead | CRT Glass, Solder, Batteries |
| Cadmium | Chip Resistors, Batteries, Plastics |
| Brominated Flame Retardants (BFRs) | Plastic Housings, Circuit Boards |
| Dioxins and Furans | Open Burning of PVC Plastics |
Policy and Legislative Frameworks
- The number of countries that have adopted a national e-waste policy, legislation, or regulation has steadily increased to 81 nations as of early 2024.
- As a result of this legislative growth, an estimated 71% of the world’s population is now covered by some form of national e-waste policy or regulation, up from just 44% in 2014.
- Out of the nations with e-waste legislation, 67 countries have specifically introduced legal provisions based on the Extended Producer Responsibility (EPR) principle.
- Furthermore, 46 countries have established clear legal provisions and targets for e-waste collection rates, and 36 countries have set specific targets for e-waste recycling rates.
- Despite these efforts, the average documented collection rate for e-waste is only 22.3%, lagging far behind the policy coverage rate.
- It is estimated that if countries could successfully ramp up their e-waste collection and recycling rates to 60% by 2030, the net benefits would surpass the costs by an estimated USD 38 billion.
- The documented formal management of e-waste in 2024, which includes recycling, is also estimated to have avoided the release of 93 million tonnes of CO2 corresponding emissions, equivalent to removing approximately 19.8 million gasoline-powered cars from the road for a year.
| Policy Metric (2024 Data) | Count/Percentage |
| Countries with E-waste Policy | 81 nations |
| Global Population Coverage | 71% |
| Countries with EPR Provisions | 67 nations |
| Projected Benefit of 60% Recycling Rate | Over US$38 billion |
| C02 Emissions Avoided (2024) | 93 million tonnes |
E-Waste By Recycling Rates
- 42.8% of all e-waste is collected and recycled in Europe.
- The share of formally recycled e-waste in Africa is less than 1%.
- Approximately 50%, that is, 30 million tonnes of global e-waste are produced in Asia, but only a few countries in the continent have defined e-waste collection targets or adopted e-waste-related legislation.
- Europe generates on average 17.6 kg of e-waste per capita, while 14.1 kg of it is generated in the Americasand 16.1 kg in Oceania. These regions also account for the largest per capita collection and recycling rates, which are 6.7 kg in Oceania, 7.5 kg in Europe and 4.2 kg in the Americas.
- 16 million tonnes of e-waste are collected and recycled informally in high- and upper-middle-income countries with developed infrastructure for managing e-waste.
- Informal handling of e-waste accounts for 18 million tonnes of e-waste in low- and lower-middle-income countries. In such countries, there is no formally managed infrastructure to handle the waste, but the gains from material recovery are counterbalanced by the health and environmental costs.
Closing Thoughts
Overall, e-waste makes it abundantly clear that we are at a critical juncture. The world is generating 62 million tonnes of e-waste annually, a volume increasing five times faster than our documented recycling capacity.
This is not just an environmental headache; it is an economic folly, resulting in the annual squandering of US$62 billion worth of recoverable materials. The low documented recycling rate of 22.3% means that billions of kilograms of toxic lead, mercury, and BFR-laden plastics are either carelessly dumped or dangerously handled by informal sectors, creating profound health and ecological risks.
However, the rapid growth in the e-waste Management Systems market, which is projected to more than double in value by 2027, highlights the massive potential of urban mining. The increasing adoption of EPR legislation by 81 nations is a step in the right direction, but the current gap between policy and performance, with collection rates lagging far behind, requires urgent, targeted action.
To truly set a new benchmark, global efforts must focus on integrating the informal sector, scaling up advanced recycling technologies to recover more than the mere 1% of rare earth elements currently captured, and enforcing the existing policies with greater rigor.
So, this is what we have collected. I hope you find this article to be useful and helps you to figure out how you can seek an advantage in this e-waste management, so if you have any questions, kindly let us know, we will try to answer them ASAP thanks for staying up till the end.
FAQ
E-waste, short for electronic waste, refers to any discarded electrical or electronic device. It includes broken, unwanted, or obsolete items ranging from smartphones and laptops to large home appliances that are nearing or at the end of their useful life.
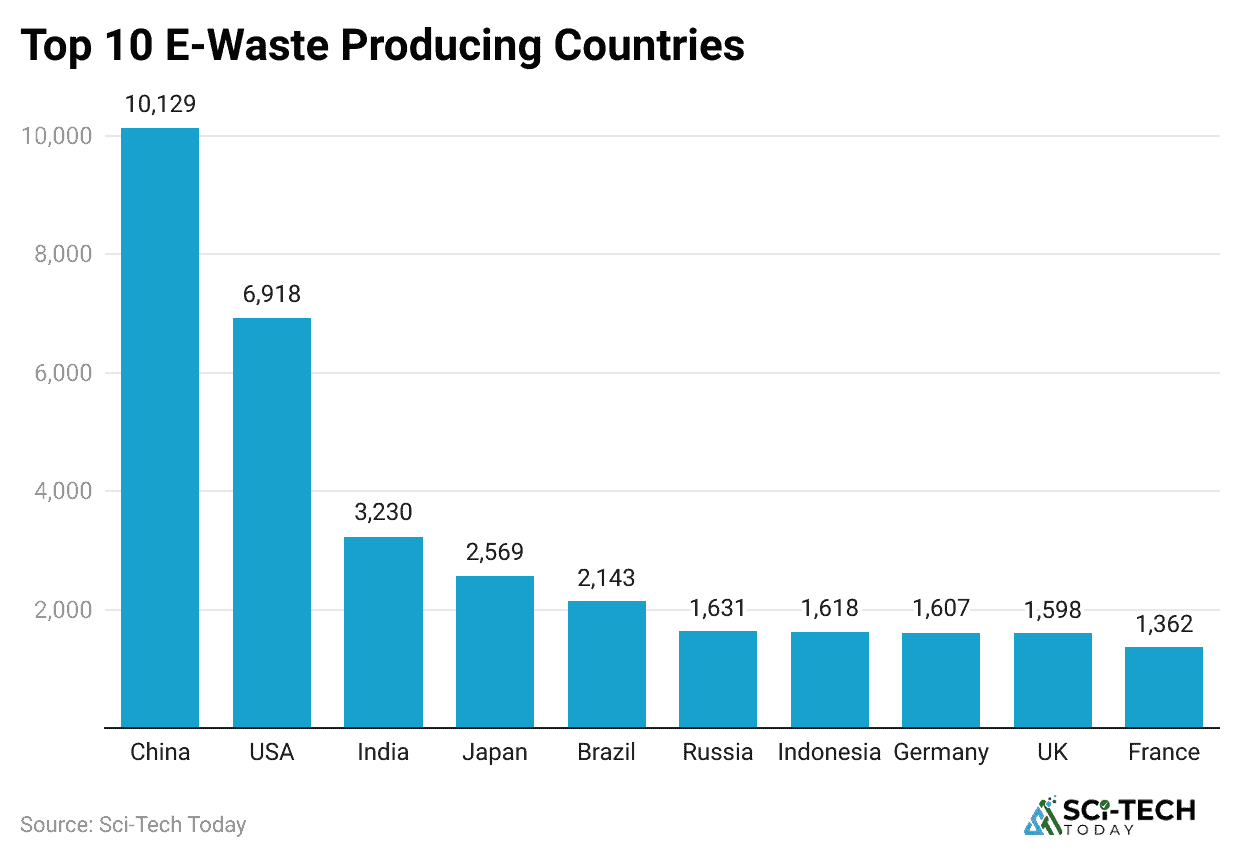
China generates the highest total volume of electronic waste (e-waste), producing over 12 million metric tons annually and accounting for roughly 19% of the world’s total. The United States follows as the second-largest absolute producer, generating about 7 million metric tons per year.
Waste generation is primarily driven by rapid population growth, accelerating urbanization, and rising global consumption levels. Modern disposable culture and industrial manufacturing processes result in massive volumes of municipal, commercial, and hazardous waste.

Sources