Introduction
Polar Ice Melt Statistics: Do you know that one of the most powerful and visible signs of climate change is the rapid melting of the Earth’s polar ice? The poles, both the Arctic in the north and the Antarctic in the south, are basically our planet’s air conditioning system.
For a long time, the ice there was stable, but with rising global temperatures, the data from satellites and research stations show an alarming story of ice melting. Sadly, this isn’t just about a few ice cubes in the ocean; it is a global issue with real and measurable consequences for all of us.
This article is going to dive deep into the data behind the polar ice melt, giving you a detailed look at the data that scientists use to understand this phenomenon. We’re going to break down the key figures from the Arctic and the Antarctic, look at what’s causing these changes, and explore the global impacts, especially on sea level rise.
We’ll be focusing on all of the hard data, so you can see for yourself why this is such a critical topic. The information here is drawn from the latest reports and scientific studies, making it one of the most comprehensive resources that you can find online. Without ado, let’s get into it.
Editor’s Choice
- The Arctic has lost an average of about 12.2% of its summer sea ice extent per decade since satellite records began in 1979.
- The record low for Arctic sea ice minimum was set in September 2012, at 3.41 million square kilometers. All 18 of the lowest summer minimums have occurred since 2007.
- The Antarctic Ice Sheet is currently losing ice at a rate of 100 to 200 billion tons per year, and this has multiplied sixfold over the last 30 years.
- In 2023, the Antarctic winter sea ice maximum hit a record low of 96 million square kilometers, and the 2024 maximum was the second lowest on record at 17.15 million square kilometers.
- The Greenland Ice Sheet lost an average of 280 gigatons of ice per year between 2002 and 2021, a loss that caused global sea level to rise by 0.8 millimeters per year.
- The Thwaites Glacier in West Antarctica, often called the “Doomsday Glacier,” alone is responsible for about 4% of current global sea level rise.
- Since 1880, the global mean sea level has risen by 8 to 9 inches, with the rate more than doubling in recent decades, from 4 millimeters per year to 3.6 millimeters per year from 2006 to 2015.
Arctic Ice
 (Source: statista.com)
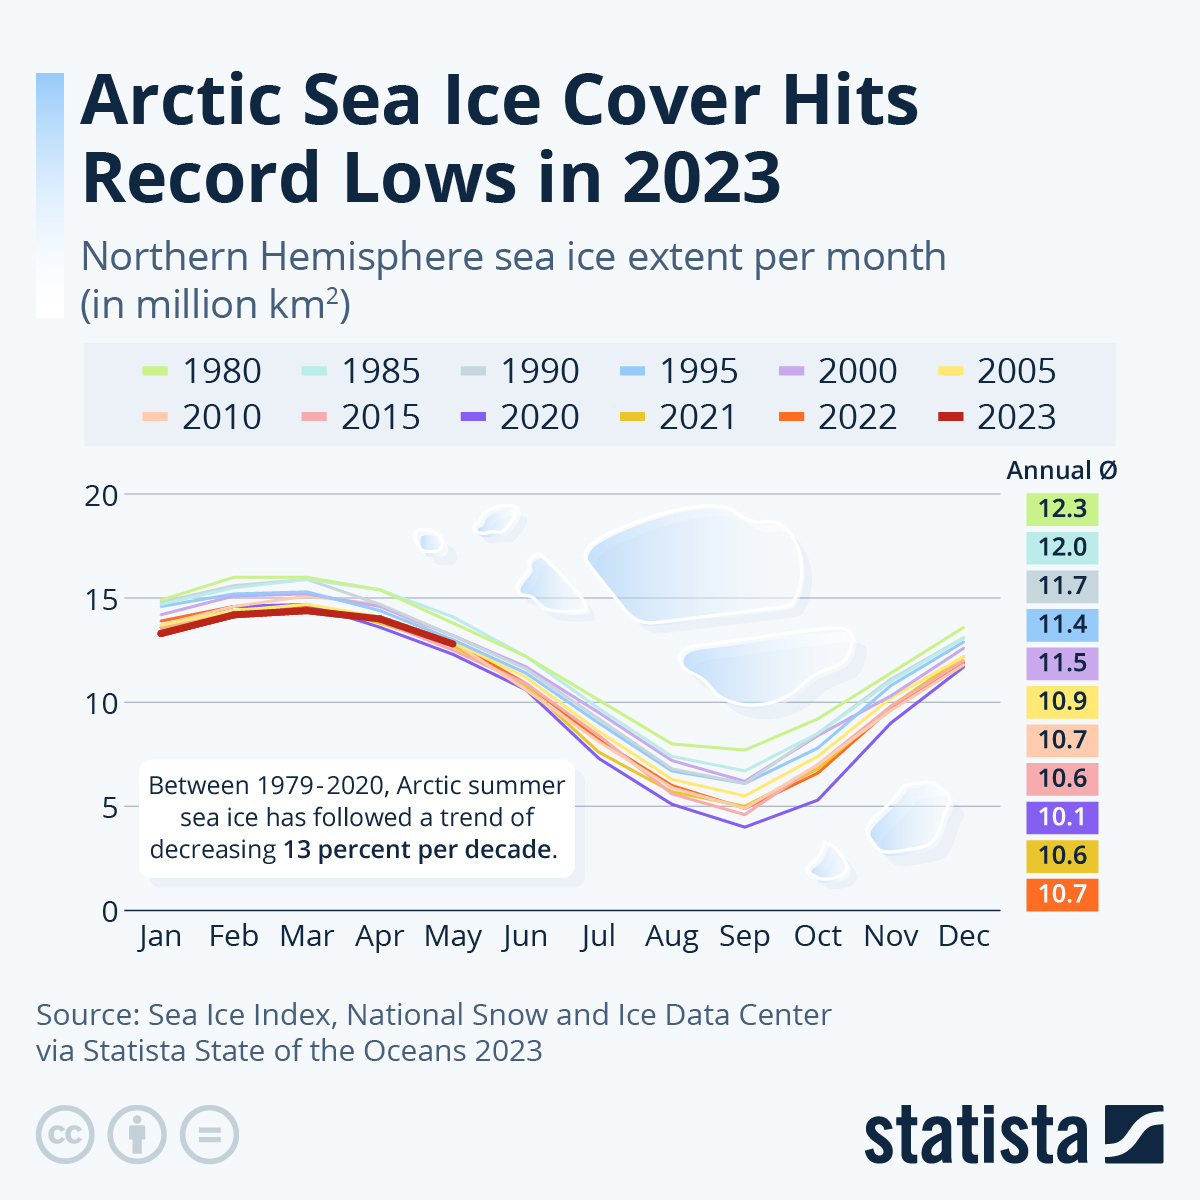
- The Arctic sea ice minimum extent, which occurs in September, has been consistently shrinking.
- Since the late 1970s, the Arctic has lost an astonishing 2.20 million square kilometers of sea ice cover, an area almost six times the size of Germany.
- Back in the mid-1980s, thick, multi-year ice made up about one-third of the Arctic’s total ice area. Today, that number has plummeted to less than 5%.
- From 1979 to 2024, the Arctic sea ice area has been decreasing at a rate of 73,000 square kilometers per year in summer, which is a decline of about 12.7% per decade.
- The rate is unprecedented in at least the last 1,500 years
- The fifteen lowest minimum Arctic sea ice extents on record have all happened since 2007. The all-time low was in 2012, at 3.41 million square kilometers.
- Even the winter maximum, which occurs in March, was a record low at 14.33 million square kilometers, a full 1.31 million square kilometers below the 1981 to 2010 average.
| Arctic Sea Ice Extent Loss | 12.2% per decade |
| 2012 Record Low |
3.41 million square kilometers |
|
Multi-Year Ice Share |
Less than 5% |
| 2025 Winter Maximum |
14.33 million square kilometers |
|
Annual Summer Loss Rate |
73,000 square kilometers per year |
Antarctic Ice
 (Source: vox.com)
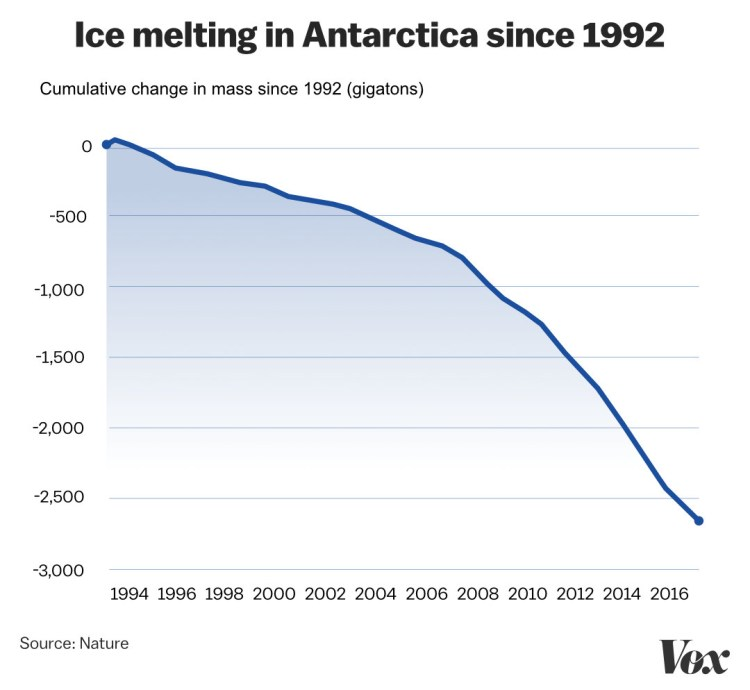
- The Antarctic Ice Sheet is a powerhouse of ice, holding about 90% of the world’s freshwater.
- Between 2002 and 2023, Antarctica shed an average of 150 gigatons of ice per year. The loss is not uniform, with West Antarctica and the Antarctic Peninsula bearing the brunt of the melting.
- The speed of ice loss from the continent has increased sixfold over the last three decades, which is a very troubling trend.
- While some parts of East Antarctica have seen a slight mass gain from increased snowfall, it’s not nearly enough to offset the massive loss elsewhere.
- The Thwaites Glacier, which is the size of Florida, has seen its calving rate jump from 11 billion tons per year by 2020.
- The Pine Island Glacier, which drains about 10% of the West Antarctica Ice Sheet, has seen its ice discharge rates increase from 80 gigatonnes per year between 1979 and 1989 to 133 gigatonnes per year in 2009 to 2017.
- For a long time, Antarctic sea ice showed a slight increase, but that changed dramatically in the last few years.
- The continent has now set back-to-back record lows for its sea ice minimum. The all-time low of 1.79 million square kilometers was set in February 2023.
- In 2024, a minimum of 1.99 million square kilometers was the second lowest on record, tying with 2022.
- The winter of 2023 was particularly stunning for scientists, as the sea ice maximum was the lowest ever recorded at 19.96 million square kilometers, less than the typical mid-September average.
| Annual Ice Sheet Loss | 100 to 200 billion tons |
| Thwaites Glacier Loss | 88 billion tons per year |
| 2023 Sea Ice Low | 1.79 million square kilometers |
| 2023 Winter Maximum | 16.96 million square kilometers |
| Thwaites Glacier Contribution | 4% of global sea level rise |
Greenland Ice Sheet
 (Source: arctic.noaa.gov)
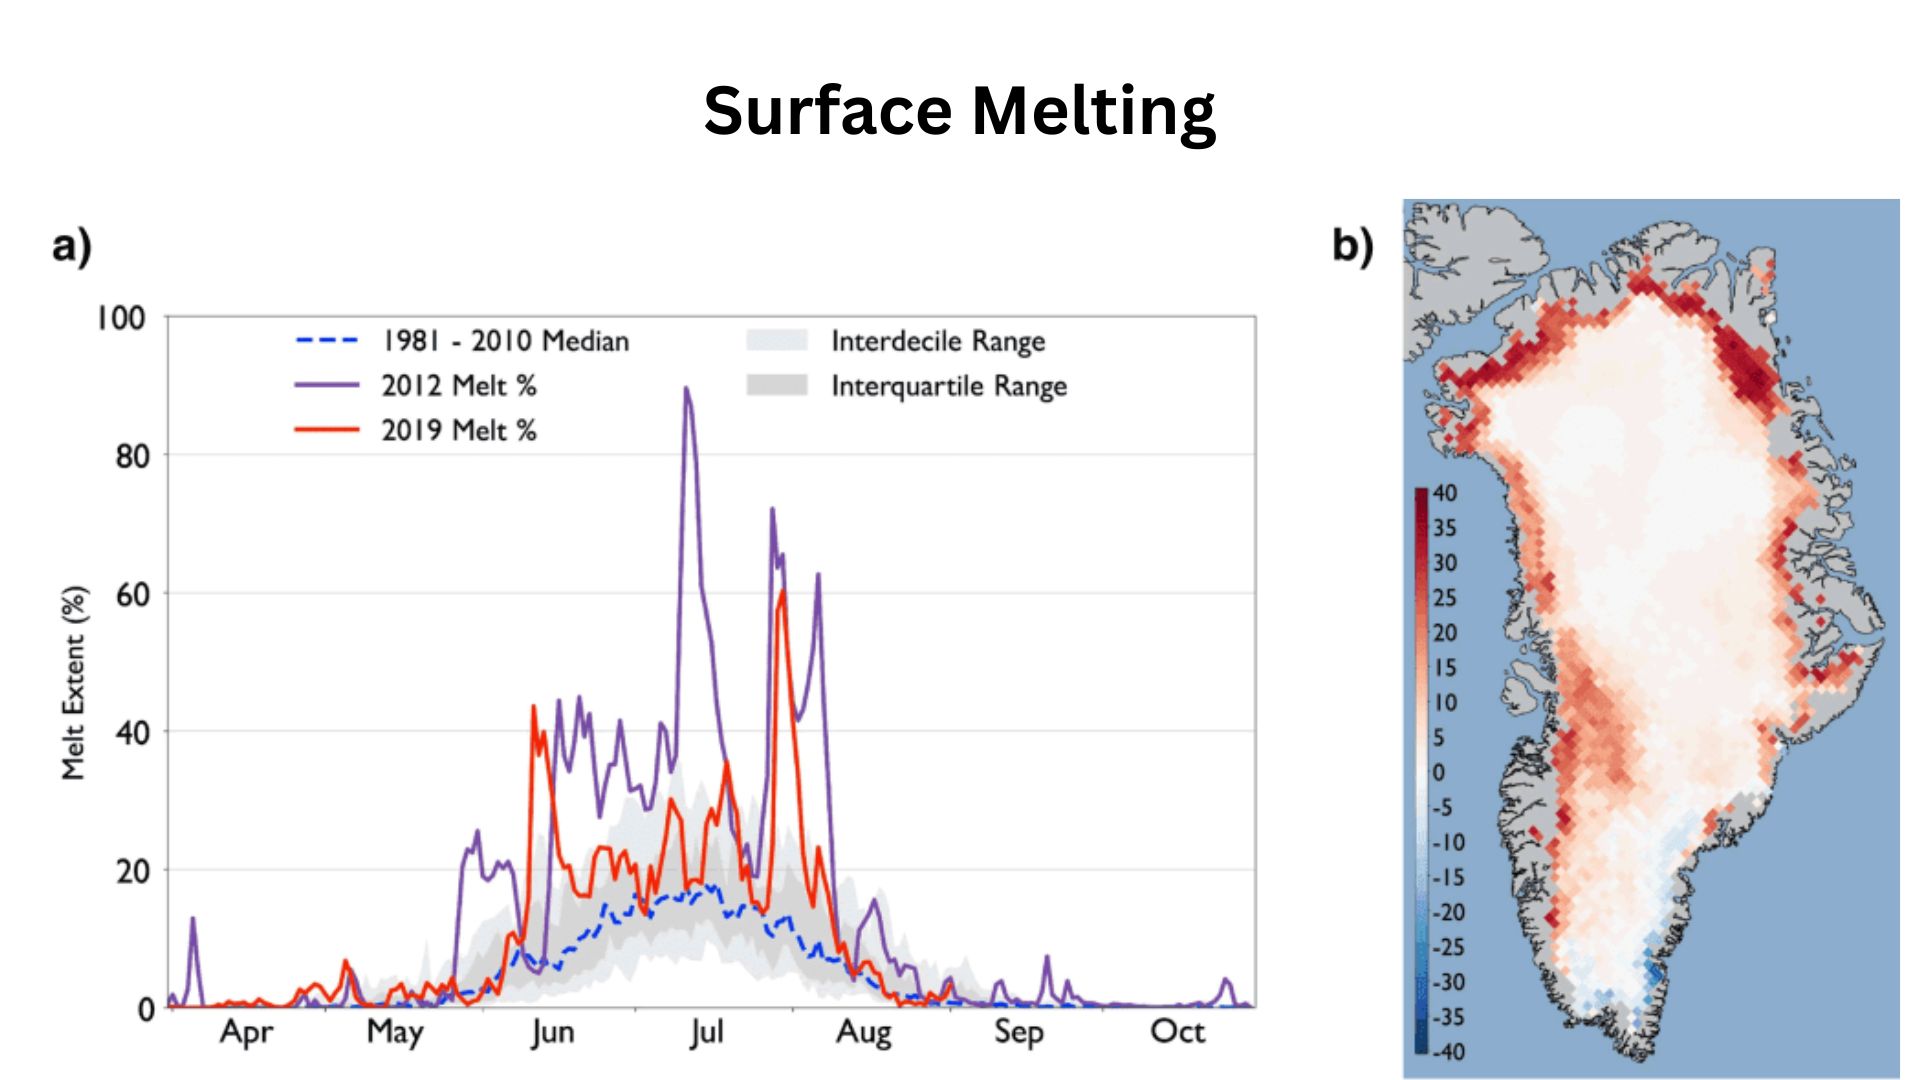
- Since 1992, the Greenland Ice Sheet has lost more than 6,200 gigatons of ice. The rate of loss has accelerated from 60 gigatons per year.
- From over 246 gigatons per year in the 1980s to over 246 gigatons per year in the 2010s. This is a huge jump and shows just how fast things are changing.
- Between 2002 and 2021, Greenland’s ice loss increased sevenfold from 34 billion tons per year between 1992 and 2001 to 247 billion tons per year between 2012 and 2016.
- Surface melt from the Greenland Ice Sheet is a huge factor. In the record-setting year of 2019, the ice sheet lost a staggering 532 billion tons of ice, a large portion of which was from surface melting and runoff.
- This single year’s melt was enough to raise global sea level by 1.5 millimeters on its own.
- For instance, the Jakobshavn Glacier, one of Greenland’s fastest-flowing glaciers, has been retreating about 20 meters per year for the past two decades.
| Total Ice Loss Since 1992 | More than 6,200 Gt |
| 2019 Record Melt | 532 billion tons |
| Recent Loss Rate | 246 Gt/year in the 2010s |
| Contribution to Sea Level Rise | 0.8 mm per year |
Global Sea Level Rise
 (Source: scitechdaily.com)
- Global mean sea level has risen about 8 to 9 inches (21 to 24 centimeters) since 1880.
- For most of the 20th century, sea level was rising at a rate of 1.4 millimeters per year.
- From 2006 to 2015, that rate more than doubled to 3.6 millimeters per year. This acceleration is largely due to the increased melting of ice sheets and glaciers.
- The melting of ice sheets in Greenland and Antarctica is now the single largest contributor to sea level rise.
- In the period from 2005 to 2013, the amount of sea level rise from melting ice was nearly twice the amount caused by the thermal expansion of warming ocean water.
- According to a 2022 report by NASA and NOAA, global sea levels are projected to rise by one foot (0.3 meters) by 2050.
- Under a worst-case scenario, some projections suggest sea level could rise by over 6 feet by the end of this century, a change that would be catastrophic for coastal cities around the world.
| Total Sea Level Rise | 8-9 inches (21 to 24 cm) |
| Current Rate | 3.6 mm per year |
| Major Cause of Rise | Melting Ice Sheets |
| 2050 Projection | Up to 1 foot (0.3 meters) |
Conclusion
So, overall, these polar ice melt statistics can be a bit overwhelming, but the data is undeniable. They give us a glimpse of our planet’s melting ice at an unprecedented rate. The Arctic is losing its perennial ice, the Antarctic is seeing rapid and accelerating glacier retreat, and Greenland is hemorrhaging ice at a pace that is directly contributing to a faster rise in sea levels than we have seen in centuries.
The statistics presented here should make it very clear that the problem is real, it is happening now, and the speed of the changes is what is most alarming. The loss of our polar ice caps and ice sheets is one of the most significant indicators of the climate crisis, and it shows us exactly what is at stake. I hope you like this one. Thanks for staying up till the end.
