Introduction
E-Commerce Fraud Statistics: When you shop online, you probably think about getting the best deal, fast delivery, or whether the product will match the description. But there’s a whole other side to e-commerce that most shopping people never see, the world of fraud. And trust me, these numbers will shock you, because you did to me. These e-commerce fraud statistics aren’t just random figures in a report; they show the real damage that scammers are causing to businesses and even regular customers like us.
Over the years, fraud in online shopping has gone from the stolen credit card to a multi-billion-dollar global problem. We’re talking billions lost every single year, and it’s only getting worse. These statistics tell a story about how criminals work, where they strike the most, and which types of fraud cost businesses the most money. If you’ve ever wondered just how big the problem is, or what kinds of tricks fraudsters are using, let’s get started.
Editor’s Choice
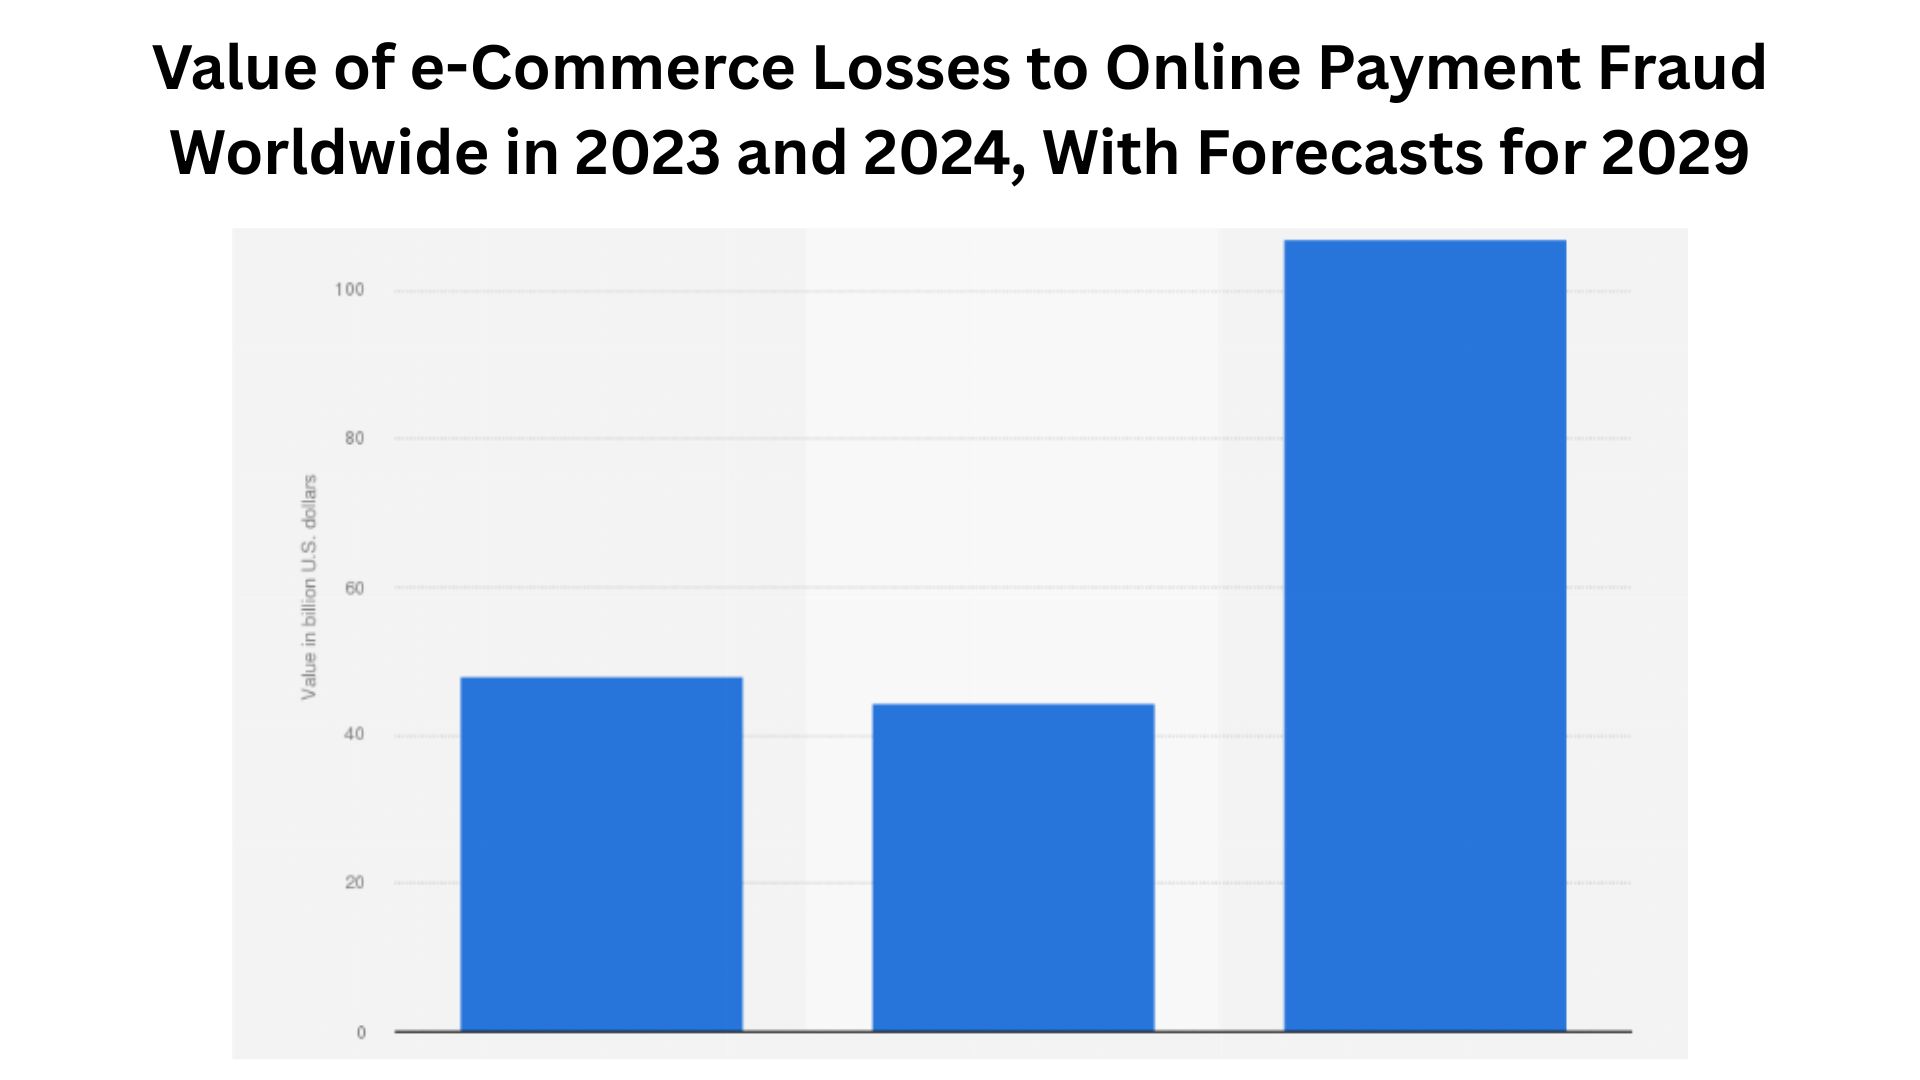
- Global losses from e-commerce fraud hit about $41 to $48 billion in 2023 and could rise to $107 billion by 2029.
- Card-not-present fraud makes up roughly 70 to 75% of total card fraud losses.
- Return and refund abuse costs U.S. retailers around $101 billion annually.
- Friendly fraud / first-party fraud is growing fast, accounting for up to 36% of fraud cases in 2024.
- Merchants lose about $4.61 for every $1 of fraud after operational costs are counted.
- Chargebacks reached around 238 million cases globally in 2023, with 72% of merchants seeing a rise in friendly fraud disputes.
- False declines cost businesses an estimated $308 billion globally in 2023 in lost sales.
- Bot-driven credential stuffing attacks are in the billions of attempts monthly, making automation a huge fraud enabler.
- High-risk categories include electronics, luxury goods, and gift cards, with grocery also targeted for policy abuse.
- New payment methods like BNPL and digital wallets are attracting synthetic ID and first-party abuse at scale.
| Metric | Latest Figure | Notes |
| Global e-commerce fraud losses (2023) | $41 to $48B |
Forecast to hit $107B by 2029 |
|
Share of card-not-present fraud |
70 to 75% | Largest single fraud category |
| Return/refund abuse losses (U.S.) | $101B |
Includes empty box & wardrobing scams |
|
Friendly fraud share (2024) |
36% | Fastest-growing fraud type |
| Merchant cost per $1 of fraud | $4.61 |
Includes chargebacks & ops costs |
|
Global chargebacks (2023) |
238M cases | 72% of merchants saw increases |
| False declines cost (2023) | $308B |
Lost sales due to overblocking |
|
Bot credential stuffing volume |
Billions/month | Enables account takeovers |
| High-risk product categories | Electronics, luxury, gift cards |
Grocery targeted for policy abuse |
|
BNPL & wallet fraud risk |
High |
Synthetic ID & first-party abuse |
Origin and Evolution- How Did e-Commerce Fraud Get This Big?
 (Reference: wisernotify.com)
- The shift to online shopping started decades ago but accelerated deeply during the pandemic. More digital volume gave fraudsters more targets and more ways to hide in normal traffic. This created a structural opportunity for theft at scale.
- Criminals moved from simple card cloning to distributed digital attacks like credential stuffing, account takeovers, and synthetic identity schemes. The result is higher-value theft and longer attack chains.
- Organized fraud rings industrialized the trade: they assemble stolen data, use automation and reshippers, and turn fraud into a business model across borders. That changed fraud from opportunistic to professional.
| Year / Era | Key change |
| Pre-2015 | Card cloning and physical theft dominated |
| 2015 to 2019 | Rise of card-not-present attacks and credential misuse |
| 2020 to 2024 | Pandemic volume surge, organized fraud rings, and bot automation |
Global Scale and Financial Impact, Real Dollar Numbers
 (Source: statista.com)
- Analysts put online retail fraud losses at tens of billions yearly. Juniper estimated about $48 billion in 2023 and projects growth to $107 billion by 2029. Those are big-picture market estimates showing rapid growth.
- Card payment fraud losses across all channels were reported by Nilson as about $33.8 billion in 2023, showing card fraud remains a huge slice of the picture.
- Return/return-abuse costs alone were estimated at roughly $101 billion in the U.S. (NRF-related figures), which is not the same as payment fraud but a major e-commerce loss driver.
- The true operational cost is larger: LexisNexis and similar studies show merchants incur roughly $4 to $4.6 in costs for every $1 lost to fraud, once chargebacks, manual review, loss handling, and customer impact are counted.
| Metric | Latest figure (example) |
| E-commerce fraud (2023 est) | $41 to $48 billion. |
| Card payment fraud (2023) | $33.8 billion (Nilson). |
| Return fraud (US) | $101 billion. |
| Merchant cost per $1 fraud | $4.61 (NA). |
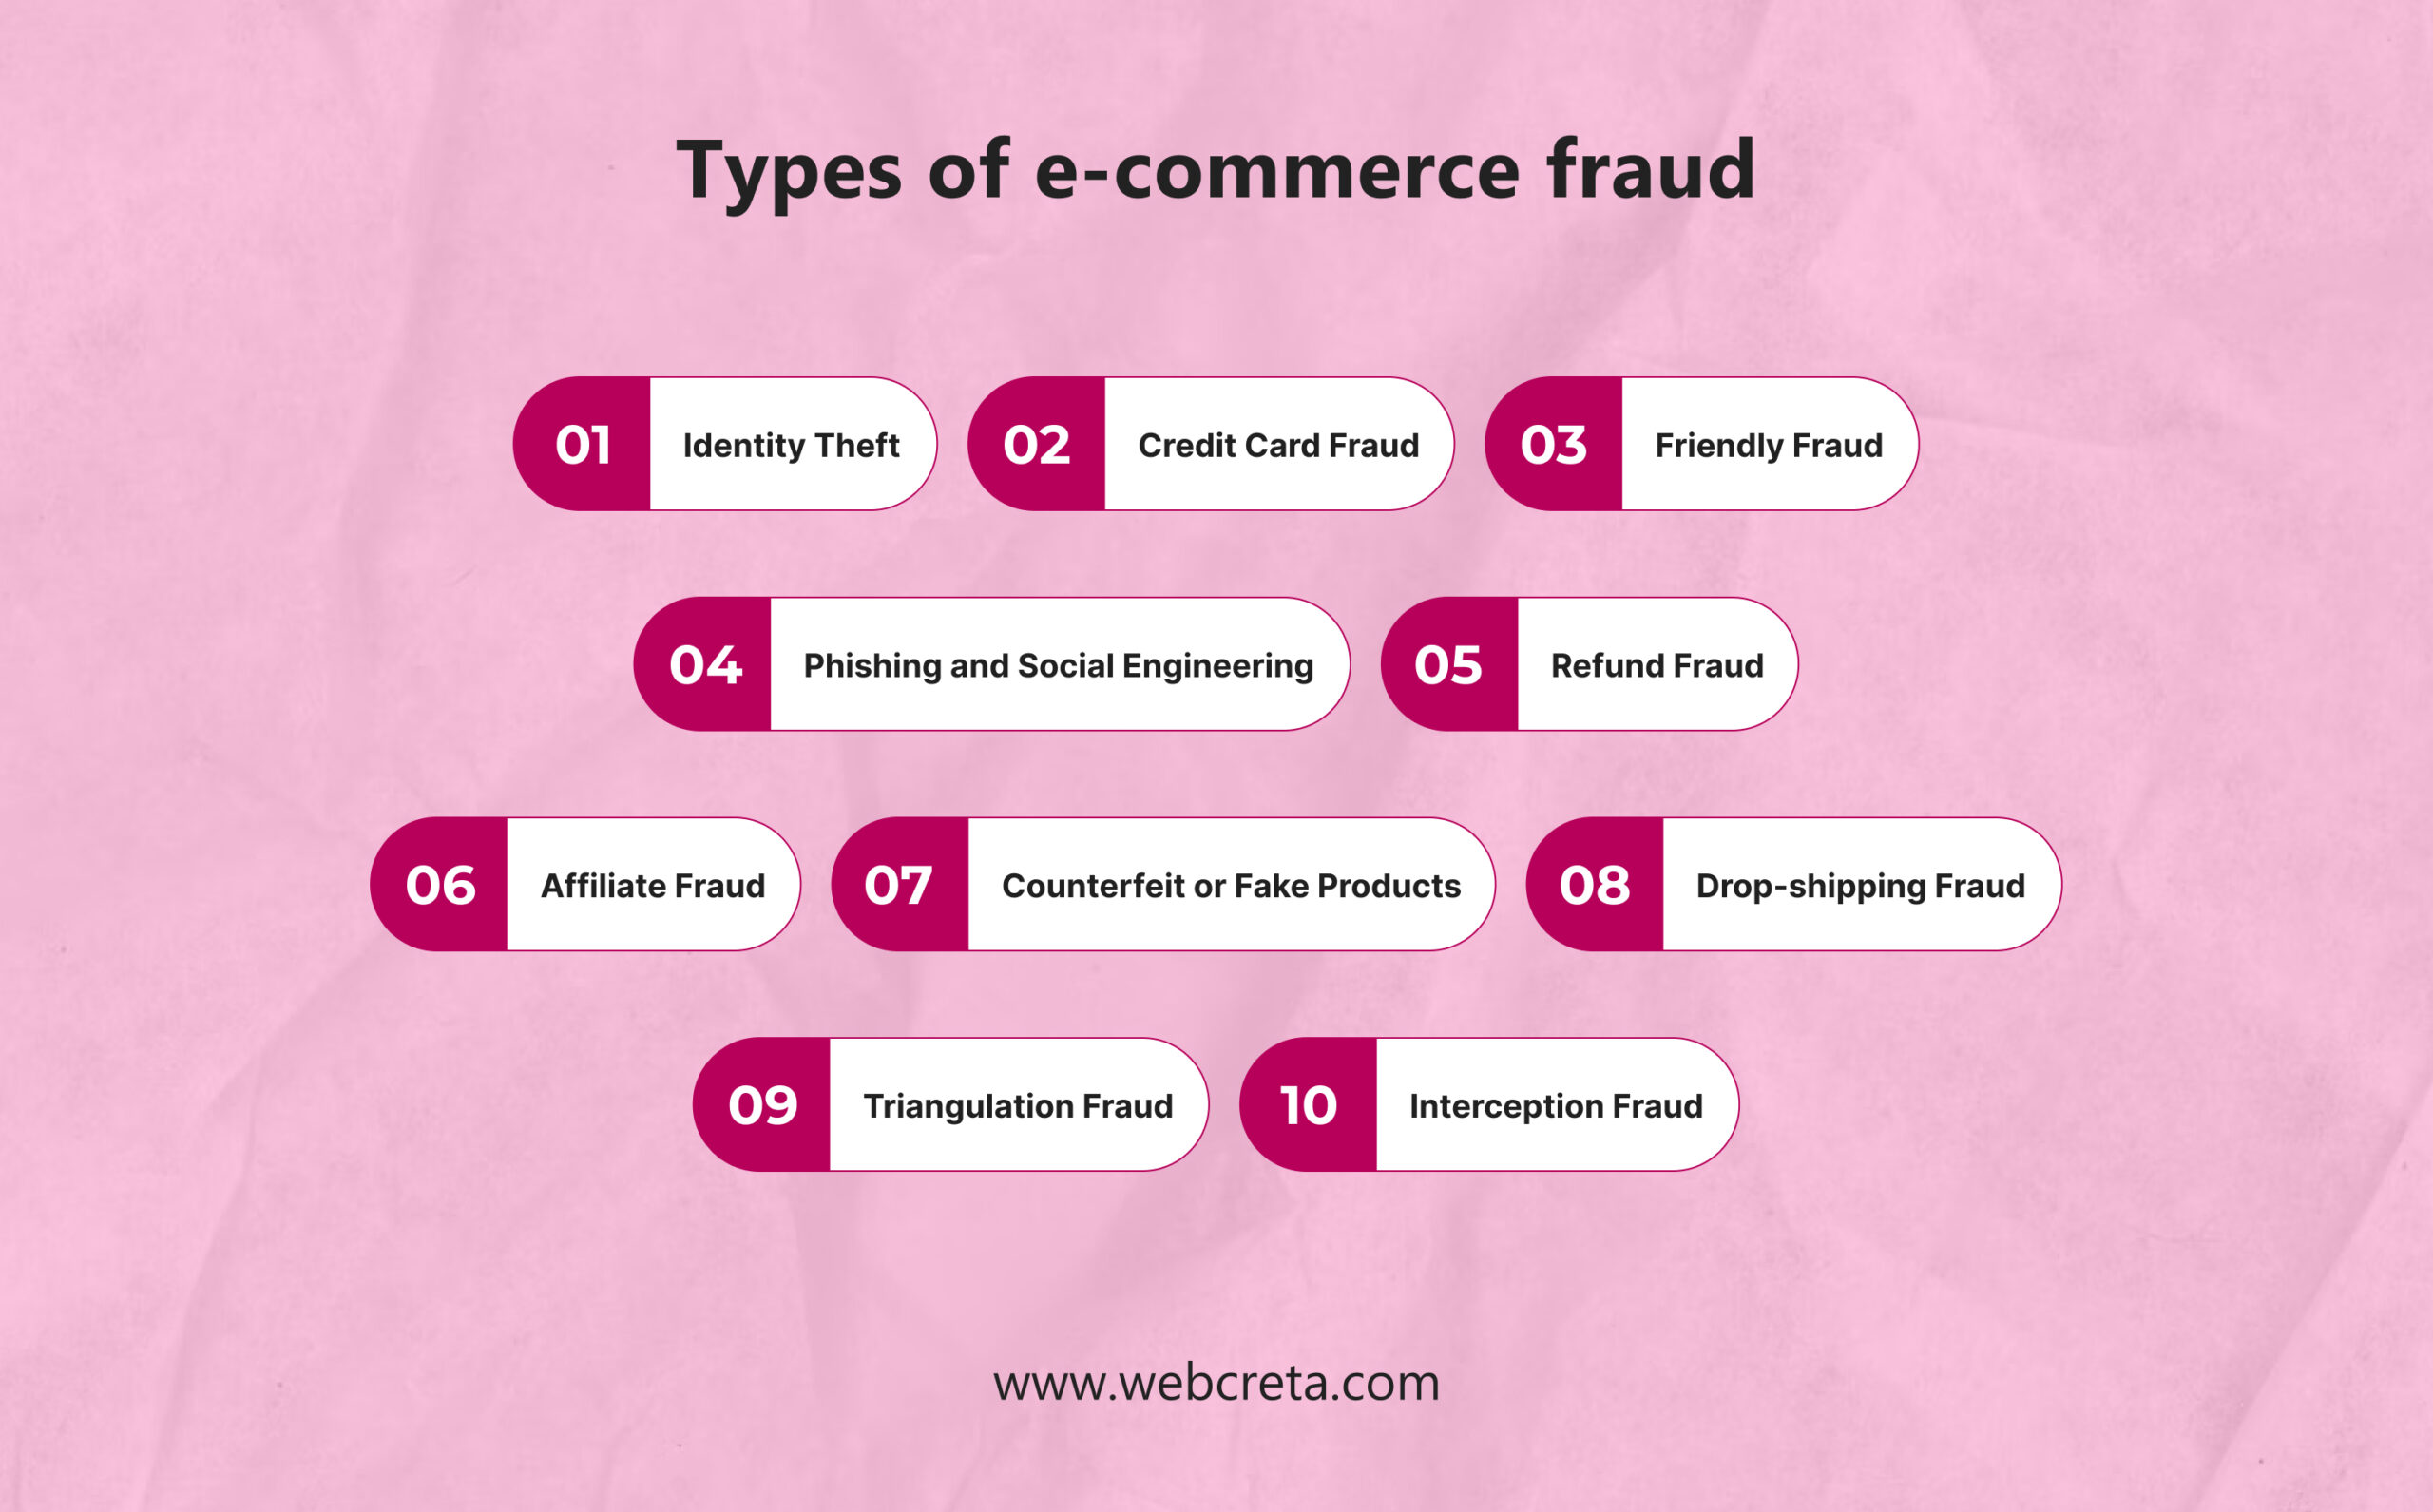
Main Fraud Types and How Common They Are
 (Source: webcreta.com)
- Card-not-present (CNP) fraud. This is the single major category for online merchants and often makes up about 70 to 75 percent of card fraud losses in many markets. That is why checkout security matters more than ever.
- Friendly/first-party fraud. Customers claim refunds or file chargebacks for legitimate purchases; merchant surveys report wide increases, and studies show friendly fraud accounts for a big share of chargebacks. For 2024, some reports flagged first-party fraud as a top growth category.
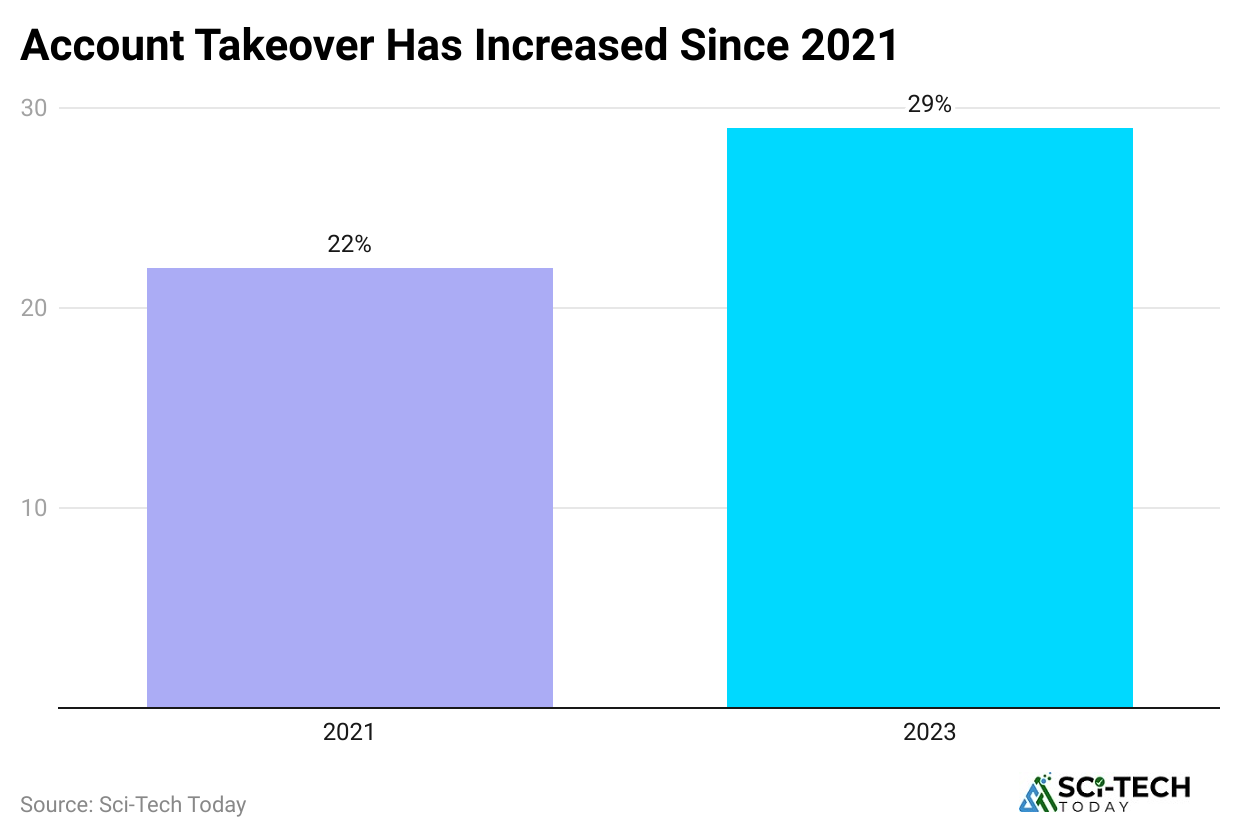
- Account takeover (ATO). Credential stuffing and leaked passwords let attackers take real accounts to buy goods, steal points, or resell items. Consumer surveys and fraud indexes reported a sharp rise in ATO incidents in 2024.
- Synthetic identity fraud. Fraudsters blend real and fake data to create new identities and open credit lines; Experian and TransUnion flagged big increases in synthetic identity cases from 2023 to 2024.
- Return/refund fraud and reshipper schemes. Organized rings and “reshipping” networks exploit lenient return policies. Attempts to place fraudulent orders and reship goods spiked in 2024.
| Type | Short description | Relative size/notes |
| CNP fraud | Online card transactions without the card | 70 to 75% of card fraud. |
| Friendly/first-party | Legit buyer files bogus chargeback | Rising fast; big share of chargebacks. |
| ATO | Stolen credentials used to access the account | Large spike in 2024; severe downstream impact. |
| Synthetic ID | Fabricated identities used to open accounts | Growing and hard to detect. |
| Return/refund abuse | Wardrobing, empty box scams, reshippers | $100B type scale in returns losses. |
Attack Methods and Automation, How Fraudsters Scale
 (Source: spd.tech)
- Bots and credential stuffing. Bad bots now make up a huge share of non-human traffic and are used to test stolen credentials and scrape sites. Reports show bot traffic jumped to nearly half of web traffic, with a significant bad-bot share.
- Credential stuffing volumes were measured in billions of attempts per month in some industry reports, showing how automated attacks try huge lists of leaked credentials to break into accounts.
- E-skimming / Magecart and fake merchant sites. Attackers inject skimmers into checkout pages or spin up scam storefronts to harvest payment data. The number of infected e-commerce domains rose notably in 2024.
- Reshipper/drop shipping fraud networks. Organized rings use third parties to receive and move goods, making recovery and tracking harder for merchants. Attempts rose in 2024.
| Tool | Purpose |
| Bots/scrapers | Scale credential tests, checkout attacks |
| Credential lists | Source for ATO and account abuse |
| E-skimmers | Steal card details from checkout pages |
| Reshipper networks | Mask origin and move stolen goods |
Regional and Vertical Differences
 (Reference: demandsage.com)
- North America often shows the highest fraud value per transaction and a large share of global e-commerce fraud. Europe and Asia have significant volumes too, with variation by country and regulation.
- Vertical targets vary. Electronics, luxury goods, and gift cards are frequent high-value targets. Certain categories, like grocery, have lower fraud pressure by value but are still targeted for promotion abuse and returns. Signifyd’s 2024 data shows fraud pressure varies by vertical, month to month.
| Region / Industry | Notes |
| North America | High dollar value of fraud losses. |
| Europe | Strong regulation; changing patterns. |
| Electronics / Luxury | High-ticket target, often resold via reshippers. |
| Grocery | Lower ticket but targeted for policy abuse. |
Chargebacks and Friendly Fraud, Scale and Merchant Pain
 (Reference: chargeflow.io)
- Chargeback volume was in the hundreds of millions annually globally; estimates range put 2023 volume at 238 million chargebacks and growth ahead. Merchants say friendly fraud now makes up a big slice of those disputes.
- Surveys show 72% of merchants reported an increase in friendly fraud chargebacks during 2024, and many merchants estimate friendly fraud represents half or more of their chargebacks. That is wrecking margins.
| Metric | Figure |
| 2023 chargebacks (global) | 238 million (reported estimates). |
| Merchant reports of friendly fraud rise | 72% reported an increase. |
False Positives and False Declines – The Hidden Cost
 (Reference: businessinsider.com)
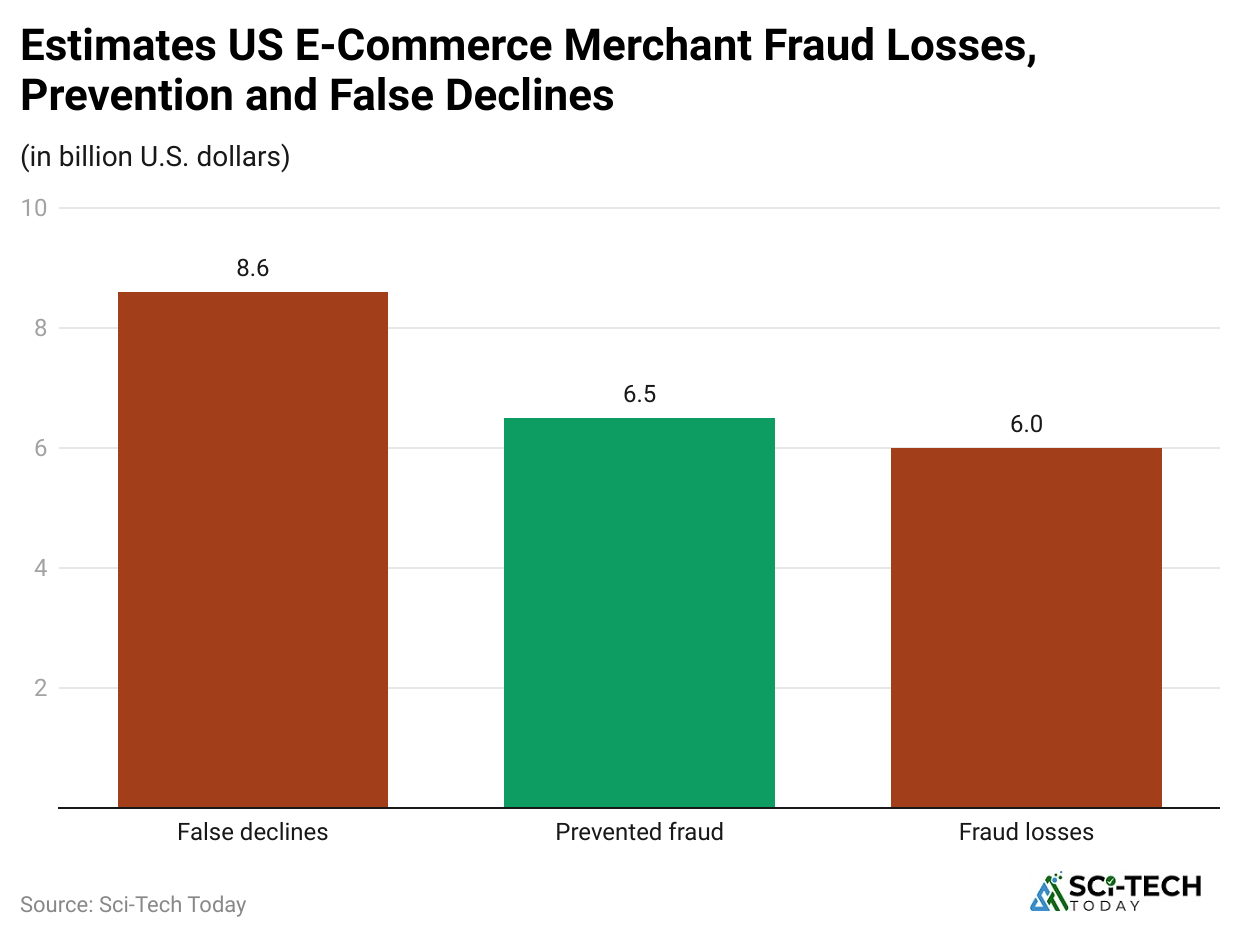
- Stopping fraud can cost you customers. The Merchant Risk Council and related surveys show false positive rates typically between 2% and 10% of orders, with 1 in 5 merchants reporting rates above 10%. False declines destroy revenue and loyalty.
- Industry estimates put the global revenue lost to false declines in the hundreds of billions; one analysis cited $308 billion lost in 2023 to false declines globally. That figure is debated, but it underscores the scale of the problem.
| Metric | Notes |
| Typical false positive rate | 2% to 10% of e-commerce orders for many merchants. |
| Potential global revenue loss | Estimates up to $308B (widely cited analysis). |
New Payment Rails and Vectors, Wallets, BNPL, and Where Fraud Goes Next
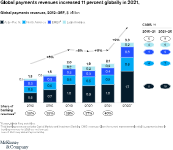 (Source: mckinsey.com)
- Buy-Now-Pay-Later and digital wallets grew fast, and fraudsters adapted. BNPL in particular is attractive because onboarding can be fast and identity checks vary, making it vulnerable to synthetic identity and first-party abuse. Analysts flagged BNPL as a rising fraud concern.
- Digital wallets are widely used, but consumer advocacy and investigators flagged gaps in monitoring and loss protections, making wallets another fraud surface to watch.
| Payment type | Fraud notes |
| BNPL | Rapid onboarding, synthetic ID, and first-party abuse risk. |
| Digital wallets | High adoption; monitoring/liability varies. |
Detection and Prevention, What Works (and what hurts you)
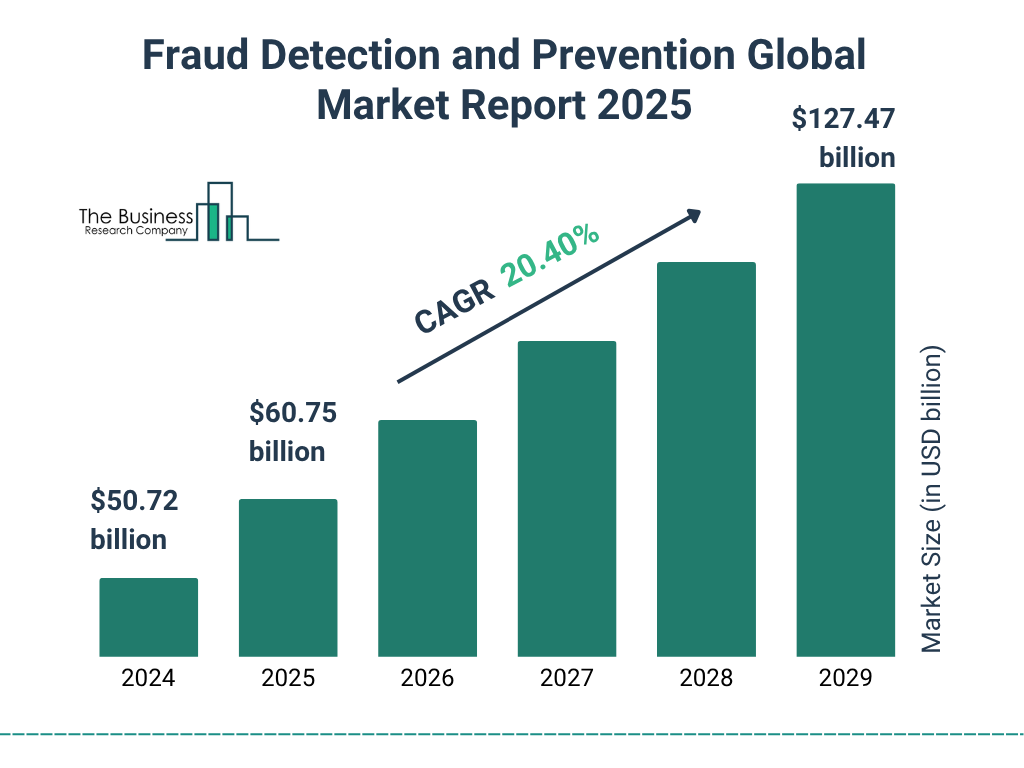 (Source: thebusinessresearchcompany.com)
- Multi-layer approach wins: tokenization, 3-D Secure step-up when needed, device fingerprinting, velocity checks, behavioral signals, and human review for edge cases. Large industry reports recommend layered controls rather than single-point fixes.
- Sharing signals and networked fraud intelligence helps greatly. Merchant networks and collaborative tools reduce fraud by spotting patterns across sites. Signifyd, Ethoca, Sift, and other vendors highlight the value of shared signals.
- Be careful about over-blocking. Overly aggressive rules cause false declines and revenue loss. The best teams tune models to reduce false positives while catching real fraud.
| Layer | Why it helps |
| Tokenization / 3DS | Reduce raw card exposure and provide additional authenticity signals. |
| Device + behavior analytics | Detect anomalies in real time. |
| Network intelligence | Spot patterns across merchants to stop rings. |
Trends and Short-Term Outlook (next 12 to 60 months)
 (Reference: sellerscommerce.com)
- Forecasts show e-commerce fraud growing rapidly; Juniper expects e-commerce fraud value to more than double from $44.3B (2024) to $107B (2029) if current trends continue.
- Fraud automation and bot sophistication will keep rising. Imperva and other bot reports show non-human traffic is a dominant force, and fraud tools are being commoditized. Expect more automated credential stuffing and API abuse.
- First-party abuse, synthetic identity misuse, and return fraud are areas where criminals are finding new revenue. Many reports mark first-party fraud as surging and likely to remain a major problem.
| Trend | Likely direction |
| Bot-driven scale attacks | Increasing. |
| First-party/return abuse | Increasing and mainstreaming. |
| Cross-border fraud rings | More organized, professional, and reshipper-savvy. |
Real Merchant Impacts, Beyond The Headline Dollars
 (Reference: datos-insights.com)
- Customer churn. Surveys show a high percentage of consumers would stop shopping at a merchant after a fraud event or chargeback dispute, directly reducing lifetime value.
- Operational load. Manual review still consumes major time for many merchants; some surveys show 40% or more of merchants still rely on manual processes for portions of fraud detection. That increases the cost per case.
- Reputation and resale pipelines. Fraud drives illicit resells, complicates brand protection, and drives up logistics and returns costs that show up in margins.
| Impact | Example |
| Revenue loss | Direct theft + chargeback + false declines. |
| Higher OPEX | Manual review and dispute handling. |
| Brand damage | Lost trust leading to customer churn. |
Practical Checklist for Merchants (quick, actionable)
 (Source: worldline-solutions.com)
- Log and share fraud signals with partners. Built-in networks and consortium data reduce ring-scale attacks.
- Tune rules continuously to reduce false positives and keep conversion high. Track real false-positive rates monthly.
- Apply step-up verification only when needed and keep friction low for trusted customers. Use adaptive step-up.
- Monitor returns and customer behavior for repeat abusers and set friction for high-risk returns.
- Invest in automated bot detection and credential-stuffing mitigation. Blocking early saves a lot of downstream loss.
| Action | Why |
| Use networked signals | Detect rings faster. |
| Track false positives | Avoid revenue loss. |
| Strengthen returns policy controls | Reduce refund abuse. |
Conclusion
Looking at all these e-commerce fraud statistics, one thing I can say, these types of fraud aren’t slowing down; it’s getting more advanced and more expensive for everyone involved. From card-not-present scams to refund abuse and bot-driven account takeovers, this data shows that no business is completely safe. The losses aren’t just in stolen products or chargebacks; they also hit customer trust and long-term revenue.
For online sellers, this means fraud prevention can’t be an afterthought. It has to be a part of the business strategy, made with the right tools, clear policies, and ongoing monitoring. For customers, it’s a reminder to be cautious about where and how we shop. The numbers are a warning, but they also show that with the right steps, businesses can reduce risks and protect both their revenue and their customers. So, that’s it, I hope you like this piece of content. If you have any questions, kindly let me know in the comments section. Thanks.
