
Introduction
Bayer Crop Science Statistics: If you’ve been following the agri-tech space, you’ve heard about Bayer Crop Science. In this article, I’m breaking down Bayer Crop Science Statistics from the ground up, covering everything from its origin, revenue, and global reach to product strategy, R&D, and future projections.
You won’t find vague numbers here, I promise. So, if you’re looking to truly understand Bayer Crop Science Statistics, you’re in the right place. Let’s break it down.
Editor’s Key Insights
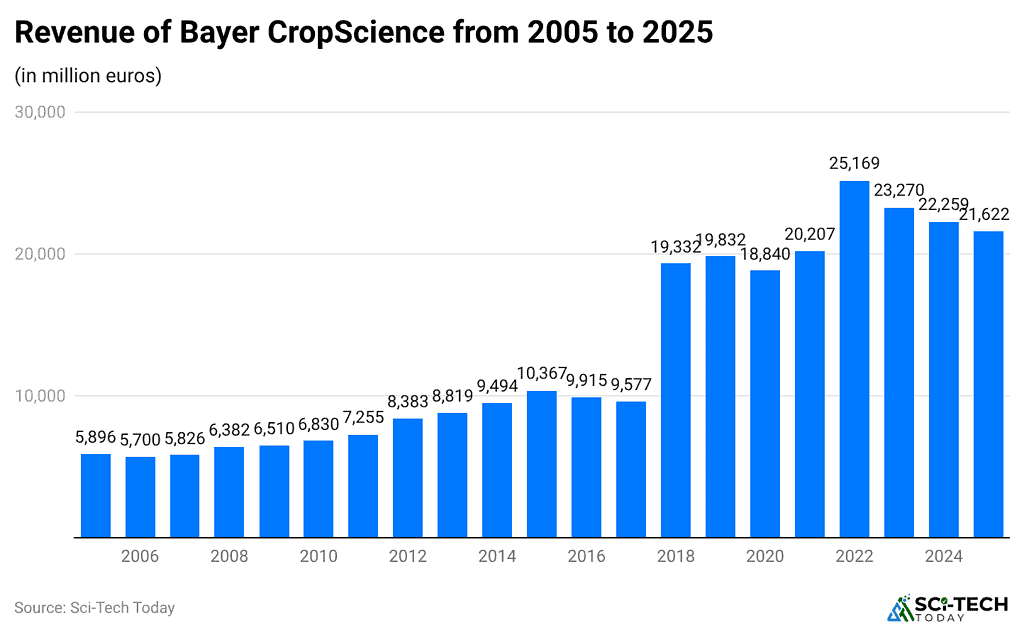
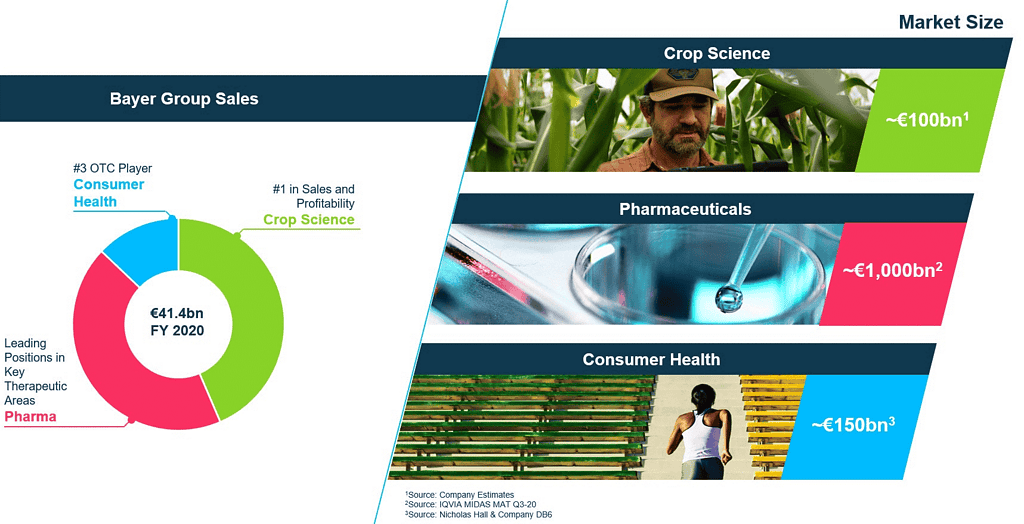
- Founded in 2002 via Bayer’s acquisition of Aventis CropScience, revenue grew from €6B early to €25.2B in 2022, then fell to €23.3B in 2023 and €22.3B in 2024; accounts for 48 to 49% of Bayer’s €46.6B total sales.
- 2024 EBITDA before special items €4.3B (margin 19.4%, down 2.3pts); net loss €2.6B; free cash flow €3.1B.
- Q1 2025 regional growth: North America to 6.1% reported ( to 8.2% fx‑adj), Latin America 11.9% ( to 0.9% fx), EMEA +0.7% (+1.7% fx), Asia‑Pacific +10% (+9.6% fx); regional mix 37% North America, 28% EMEA, 28% Asia‑Pacific, 7% LatAm/Africa.
- Seeds & traits 30 to 40% of CropScience revenue; Intacta2 Xtend soybean seeds cover 30% of Brazil soy area; pipeline 150 ag products with 30 expected by 2026.
- Crop protection volume down 4% in 2024; glyphosate prices fell 13% despite 7% volume growth; Bayer market share 9 to 10% of global crop protection ($75B by 2025); Asia‑Pacific 36 to 37%.
- R&D investment €5.4B in 2024 (10% of revenue); CropScience R&D down 1.4% in Q1 2025; 150 projects in pipeline, 30 launching by 2026; focus on seeds, digital tools, sustainability.
- Acquired Monsanto ($63B) in 2018, inheriting Roundup liabilities; 2024 impairments €3.8B; legal reserves €10 to 16B; 67,000 lawsuits pending; share price down 60% since acquisition.
- 2024 peer comparison: Bayer revenue €22.3B, EBITDA €4.3B(19.4% margin); Syngenta €17B rev, €2.3B EBITDA; Corteva $17B rev, €3.4B EBITDA.
- Strategic changes: exiting U.S. seed‑treatment business in 2025; closing German herbicide plants by 2028 (700 jobs); 7,000 global layoffs since mid‑2023; focus shifting to digital farming and innovation.
- 2025 outlook: sales guidance to 1% to 3% (fx‑adjusted), EBITDA margin 18 to 20%; recovery from 2026; mid‑20s % margin target by 2029; aim to lower net debt/EBITDA to 2.5×; litigation resolution critical.
Bayer’s Company Overview
| Category | Details |
| Company | Bayer AG |
| Founded | 1 August 1863 (over 160 years ago) |
| Headquarters | Leverkusen, North Rhine-Westphalia, Germany |
| Type | Public company |
| Stock Listings | Frankfurt Stock Exchange (FWB: BAYN), DAX index component, Euro Stoxx 50 component |
| Founder | Friedrich Bayer |
| Area Served | Worldwide |
| Key People | Bill Anderson (CEO) and Norbert Winkeljohann (Chairman of the Supervisory Board) |
| Industry Sectors | Pharmaceuticals, Chemicals, Biotechnology, and Healthcare |
| Main Products | Prescription medicines, diagnostics, imaging systems, therapeutics, over-the-counter drugs, pesticides, seeds, and plant biotechnology |
| Website | bayer.com |
(Source: global-agriculture.com)
- Sales came in at EUR 13,405 million in Q1 2026, down 2.4% year-over-year on a reported basis from EUR 13,738 million in Q1 2025.
- EBITDA before special items improved meaningfully, rising from EUR 4,085 million in Q1 2025 to EUR 4,453 million in Q1 2026 with an increase of 9.0% year-over-year. The corresponding EBITDA margin before special items expanded from 29.7% to 33.2%.
- Earnings Before Interest and Taxes rose sharply by 51.8%, growing from EUR 2,324 million in Q1 2025 to EUR 3,528 million in Q1 2026.
- This significant jump was largely driven by a swing in special items, which moved from a negative EUR 587 million in Q1 2025 to a positive EUR 324 million in Q1 2026.
- EBIT before special items, a more normalized profitability measure, grew at a more moderate but still healthy pace of 10.1%, rising from EUR 2,911 million to EUR 3,204 million over the same period.
- Net income surged by 112.7% from EUR 1,299 million in Q1 2025 to EUR 2,763 million in Q1 2026. In line with this, earnings per share also grew by 112.9%, rising from EUR 1.32 to EUR 2.81 per share.
- Core earnings per share increased by a more measured 12.9%, from EUR 2.40 in Q1 2025 to EUR 2.71 in Q1 2026.
- Free cash flow turned more negative in Q1 2026, widening from negative EUR 1,528 million to negative EUR 2,320 million.
- Headcount declined modestly, with employees dropping by 3.4% from 90,885 in Q1 2025 to 87,757 in Q1 2026.
Bayer CropScience Revenue Statistics
(Reference: statista.com)
- Bayer CropScience reported revenue of EUR 22,259 million in 2024.
- In 2025, revenue declined to EUR 21,622 million.
- This represents a year-over-year decrease of EUR 637 million.
Bayer Crop Science Delivers Strong Profit Growth and Margin Expansion
- Bayer’s Crop Science division reported Q1 2026 sales of EUR 7,558 million, compared with EUR 7,580 million in Q1 2025.
- Reported sales declined 0.3%, while sales increased 6.8% on a currency- and portfolio-adjusted basis.
- Sales performance was supported by 6.0% volume growth and 0.8% price growth in Q1 2026.
- Currency movements had a negative impact of 7.1%.
- EBITDA increased significantly to EUR 3,065 million from EUR 2,157 million, representing a growth of 42.1%.
- Special items improved from negative EUR 401 million in Q1 2025 to positive EUR 51 million in Q1 2026.
- EBITDA before special items rose 17.9% to EUR 3,014 million, up from EUR 2,557 million.
- The EBITDA margin before special items expanded to 39.9%, compared with 33.7% in the prior-year period.
- EBIT increased 64.3% to EUR 2,277 million, compared with EUR 1,386 million in Q1 2025. EBIT before special items grew 24.9% to EUR 2,231 million, up from EUR 1,786 million.
- Net cash used in operating activities improved slightly to negative EUR 2,354 million, compared with negative EUR 2,406 million a year earlier.
- Cash flow-relevant capital expenditures increased 19.5% to EUR 196 million from EUR 164 million.
- Research and development expenses declined 13.5% to EUR 533 million, compared with EUR 616 million in Q1 2025.
By Regional Sales Performance
- Bayer’s North America business delivered the strongest regional performance in Q1 2026, with sales increasing to EUR 4,087 million from EUR 3,869 million in Q1 2025.
- Meanwhile, the reported growth was 5.6%, while currency- and portfolio-adjusted growth reached 16.6%.
- Sales in Europe, the Middle East & Africa (EMEA) declined around EUR 1,998 million from EUR 2,094 million in the prior-year quarter. Reported sales decreased 4.6%, while currency- and portfolio-adjusted sales were down 2.2%.
- In Asia/Pacific, sales fell to EUR 511 million from EUR 571 million in Q1 2025.
- Besides, sales declined by 10.5%, while currency- and portfolio-adjusted sales decreased by 1.2%.
- Latin America reported sales of EUR 962 million, compared with EUR 1,046 million a year earlier. Reported sales declined 8.0%, while currency- and portfolio-adjusted sales were down 7.3%.
Strong Seed and Traits Growth Supports Bayer Crop Science
- Bayer’s Crop Science division reported Q1 2026 sales of EUR 7.558 billion, representing 6.8% growth on a currency- and portfolio-adjusted basis.
- Growth was primarily driven by the resolution of a licensing agreement with Corteva in North America, which contributed EUR 448 million to divisional revenue.
- Corn Seed & Traits sales increased 7.1% on a currency- and portfolio-adjusted basis.
- EBITDA margin before special items expanded by 6.2 percentage points to 39.9%.
- A negative currency impact of EUR 277 million in Q1 2026, compared with a positive impact of EUR 26 million in Q1 2025.
Crop Protection Business Remains Under Pressure in Q1 2026
- According to iGrow News, Herbicide sales declined 10.2% on a currency- and portfolio-adjusted basis.
- Within the herbicide portfolio, glyphosate-based products experienced a steeper 15.1% decline on a currency- and portfolio-adjusted basis, driven by ongoing pricing pressure and lower market demand.
- Fungicide sales also decreased 10.7% on a currency- and portfolio-adjusted basis during the quarter.
Bayer’s Crop Science Business Sales Performance
- Bayer’s Crop Science division reported that Corn Seed & Traits sales decreased 1.2% to EUR 3,151 million in Q1 2026 from EUR 3,189 million in Q1 2025.
- Herbicide sales fell 14.2% to EUR 1,367 million, compared with EUR 1,594 million in the prior-year quarter.
- Within Herbicides, glyphosate-based products recorded a sharper decline of 19.1%, with sales falling to EUR 478 million from EUR 591 million.
- Fungicide sales declined around 13.5% to EUR 792 million in Q1 2026, down from EUR 916 million.
- Soybean Seed & Traits was the standout performer, with sales surging 86.2% to EUR 972 million, compared with EUR 522 million in Q1 2025.
- Insecticide sales decreased 13.2% to EUR 336 million from EUR 387 million.
- Vegetable Seeds sales declined 16.1% to EUR 161 million, while Cotton Seed sales fell 21.1% to EUR 183 million from EUR 232 million.
- The Other category delivered 8.8% growth, with sales increasing to EUR 596 million from EUR 548 million.
Bayer Crop Science Reports Positive Special Items
- In Q1 2026, restructuring charges reduced EBIT by EUR 54 million and EBITDA by EUR 49 million.
- Litigation and legal-risk-related gains contributed EUR 100 million to both EBIT and EBITDA.
- As a result, total special items were EUR 46 million for EBIT and EUR 51 million for EBITDA.
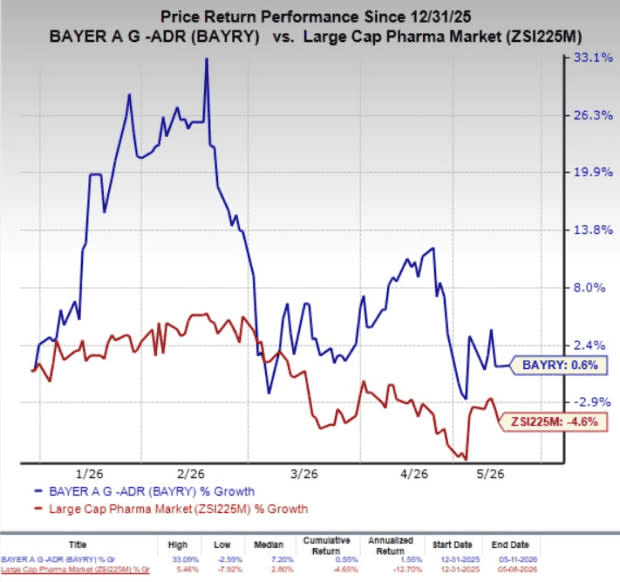
Bayer CropScience Shares Trade Statistics
- As of 10 June 2026 (Wednesday close), Bayer CropScience shares closed at USD 45.10, up from the previous close of USD 44.81.
- The stock traded within a 52-week range of USD 44.25 to USD 76.03.
- The company had a market capitalization of USD 2.03 billion with 44.9 million shares outstanding.
- Average daily trading volume stood at 1.64K shares, while earnings per share were USD 1.73.
Bayer CropScience Reports Higher Profit Despite Weather-Related Revenue Pressure in Q2 FY 2025-26
(Source: s.yimg.com)
- Bayer CropScience Limited reported Q2 FY 2025-26 Revenue from Operations of ₹15,534 million (approximately USD 186.0 million), compared with ₹17,382 million ( USD 208.1 million) in the prior year, reflecting a 10.6% decline.
- Profit Before Tax (PBT) rose to ₹2,003 million (USD 24.0 million) from ₹1,901 million (approx. USD 22.8 million), representing a 5.4% increase.
- For H1 FY 2025-26, Revenue from Operations increased to ₹34,680 million (USD 415.0 million) versus ₹33,696 million (USD 403.2 million), up 2.9%.
- H1 PBT improved to ₹5,355 million (USD 64.1 million) compared with ₹5,059 million (USD 60.6 million), reflecting a 5.9% rise.
R&D Investment and Pipeline
(Source: bayer.com)
- Total R&D spend in the CropScience segment in 2024 was approximately €2.4-2.6 billion.
- Bayer invested about 10% of group revenue (€5.4 billion) across its divisions.
- CropScience R&D spend down 1.4% in Q1 2025 versus the prior year.
- There are 150 agricultural projects in development overall.
- Roughly 30 of those are expected to reach the market by 2026.
- R&D focus includes next‑gen seeds, digital tools, and herbicide tolerance.
- Bayer integrates ESG sustainability targets into the R&D pipeline.
- Digital farming tools are being rolled out to farmers globally.
- Seed and trait innovation in the pipeline is key to revenue recovery.
- R&D efforts are aligned to bolster margins beyond 2025.
Strategic Moves and Operational Shifts
- In 2025, Bayer announced plans to refocus its existing U.S. seed treatment equipment business.
- German herbicide manufacturing sites in Frankfurt and Dormagen will close by 2028.
- These closures affect 700 employees across both sites.
- Resources reallocated toward digital farming and high‑value innovation.
- CropScience restructuring includes 7,000 job cuts globally from mid‑2023.
- The CEO plans to rationalize costs and accelerate decision‑making across units.
- Bayer is repositioning toward strategic tech instead of generic volume manufacturing.
- Restructuring is designed to safeguard profitability in regulated markets.
- Focus narrowed to seed traits and flagship crop protection innovations.
- Operational pivot expected to boost margins beyond 2026.
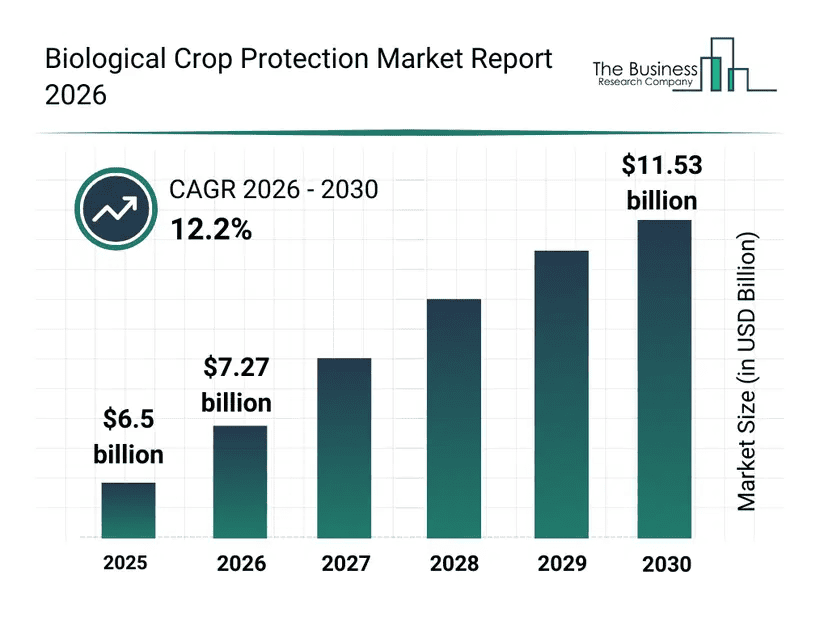
Biological Crop Protection Market Statistics
(Source: thebusinessresearchcompany.com)
- The global Biological Crop Protection market accounted for USD 6.5 billion in 2025.
- The market is projected to grow to USD 7.27 billion in 2026.
- Looking ahead, the market is expected to reach USD 11.53 billion by 2030.
- This growth represents a compound annual growth rate of 12.2% between 2026 and 2030.
Conclusion
So, that’s the complete picture, Bayer Crop Science Statistics, broken down from every possible angle. Tracking Bayer from its historical foundation to its modern positioning reveals an operation optimized for volatile global markets, long-term sustainability, and digital integration.
Bayer’s data shows a company that’s deeply invested in long-term growth, sustainability, and digital transformation. Whether you’re a student, investor, or just someone curious about the agri-business world, I hope this breakdown gives you a clear and data-driven understanding of Bayer Crop Science Statistics without drowning you in some random numbers. If you have any questions, kindly let me know in the comments. Thanks.
