





Getting Started
Greenhouse Gas Emissions Statistics: One of the most important things to understand when we stress the word climate change is greenhouse gas emissions. These are gases released into the atmosphere by human activities and natural processes that trap heat and warm our planet. Scientists track these emissions carefully, and all the numbers, percentages, and comparisons are what we call greenhouse gas emissions statistics.
Why should you care about these statistics? Because they tell the story of how our energy use, farming, transportation, and industries are affecting the environment badly. For example, when we burn coal for electricity or drive cars, we release carbon dioxide (C02). When cows digest food or rice paddies grow, methane (CH4) escapes into the air. Even tiny amounts of man-made gases, like those used in air conditioners, can trap a lot of heat.
By looking at these greenhouse gas emissions statistics, we can understand which countries, sectors, and activities contribute the most to climate change. These numbers help governments, scientists, and even you make decisions about reducing emissions and protecting our planet.
The purpose of this paper is to analyze and describe the latest greenhouse gas emission statistics. In the following paragraphs, we will cover such aspects as the global emission levels, country contributions, greenhouse gas types, and sectors with the highest shares in emissions. After reading this article, one will have a good understanding of how greenhouse gas emissions pollute our Earth, why their levels are rising, and what measures can help decrease the levels of these emissions.
The Elite Selection
- Global GHG emissions reached 53.2 GtCO2e in 2024 (excluding land use, land-use change and forestry), a record in the EDGAR dataset.
- Emissions rose 1.3% in 2024 versus 2023, equivalent to approximately 665 MtCO2e.
- Energy-related CO2 emissions reached 37.8 GtCO2 in 2024, a new record and 0.8% higher than in 2023.
- CO2 is the biggest GHG by share. It is about 74% of global GHG emissions.
- Nearly 92% of CO2 emissions are contributed by fossil fuels. This makes power and industry the main culprits.
- Sector-wise, Electricity and Heat is the biggest contributor, responsible for 34% of global GHG emissions (base year 2019).
- Industry contributes 24% of emissions, owing to the consumption of heavy materials and on-site fuel use.
- Agriculture, Forestry and Other Land Use constitutes 22% share. Food production and deforestation are important in this sector.
- Transport constitutes 15%, being mainly fuel-based (approximately 95%).
- Buildings account for 6% (direct emissions). Including electricity use can lift buildings to 16% in some accounting views.
- China is about 35% of global CO2 emissions. Coal and industry are the big levers.
- China’s emissions remained higher than those of advanced economies combined in 2024, reinforcing the shift in clean-tech and decarbonisation demand toward Asia
- Per-capita tells a different story for responsibility and market pressure.
- India is around 2 tonnes of CO2 per person (still below the global average).
- The U.S. per-capita carbon footprint was 17.61 tCO2e per person in 2023; the global average was approximately 6.6 tCO2e per person.
- Big-emitter concentration remains high: China, the U.S., India, the EU27, Russia and Indonesia accounted for 61.8% of global GHG emissions in 2024 under EDGAR’s non-LULUCF methodology.
- Mitigation momentum is clear, but the scale is not. To get on a 1.5°C path, global emissions cuts of about 42% by 2030 are needed.
- A 1.5°C-consistent 2030 level is about 33 GtCO2e (median). That implies a very fast change this decade.
- UNEP-linked analysis also points to about 7.5% emissions cuts per year (until 2035) to stay near a 1.5°C path.
Global Greenhouse Gas Emissions Overview
(Source: epa.gov)
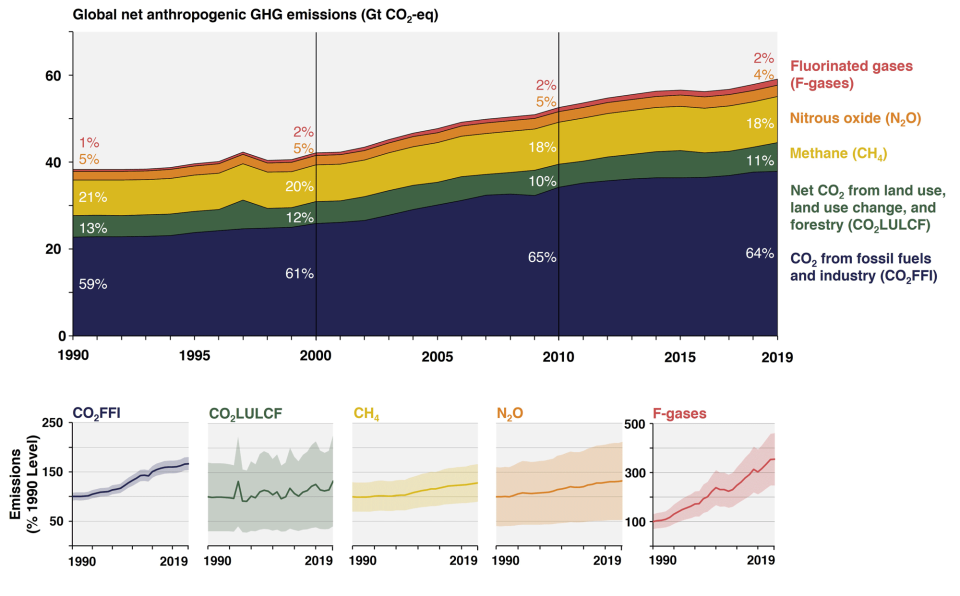
- Global greenhouse gas emissions are increasing each year steadily.
- Global GHG emissions reached 53.2 GtCO2e in 2024 (excluding land use, land-use change and forestry), a record in the EDGAR dataset, and an increase of 1.3% (665 MtCO2e) from 2023.
- These emissions come mostly from humans burning fossil fuels, clearing forests, and running industries and vehicles.
Breakdown by Gas Type
- Carbon dioxide (C02): The main culprit, responsible for 79% of emissions, mainly from burning coal, oil, and gas.
- Methane (CH4): About 11%, produced mostly by livestock digestion, landfills, and gas leaks.
- Nitrous oxide (N20): Around 6%, mostly from fertilizers and certain industrial processes.
- Fluorinated gases: 3%, man-made, used in air conditioning and refrigeration.
Breakdown by Sector
- Electricity and heat: 34%, from coal and gas-fired plants.
- Industry: 24%, from factories and industrial chemical processes.
- Agriculture & land use: 22%, from farming, livestock, and deforestation.
- Transport: 15%, from cars, planes, and ships.
- Buildings: 6%, from heating, cooling, and energy use.
| Category | Percentage / Value | Explanation |
| Total Global Emissions | 53.2 Gt CO2 | Total emissions released worldwide in 2024. |
| C02 | 79% | Mainly from burning fossil fuels and deforestation. |
| CH4 | 11% | From livestock, landfills, and gas leaks. |
| N20 | 6% | From fertilizers, agriculture, and industry. |
| Fluorinated Gases | 3% | Man-made, from cooling systems and electronics. |
| Electricity & Heat | 34% | The largest sector is due to coal, gas, and oil plants. |
| Industry | 24% | Factories, chemical processes, and energy use in manufacturing. |
| Agriculture & Land Use | 22% | Farming practices, livestock, and deforestation. |
| Transport | 15% | Cars, trucks, planes, ships: emissions from moving people and goods. |
| Buildings | 6% | Heating, cooling, and electricity usage in homes and offices. |
Emissions by Country
(Source: wikipedia.org)
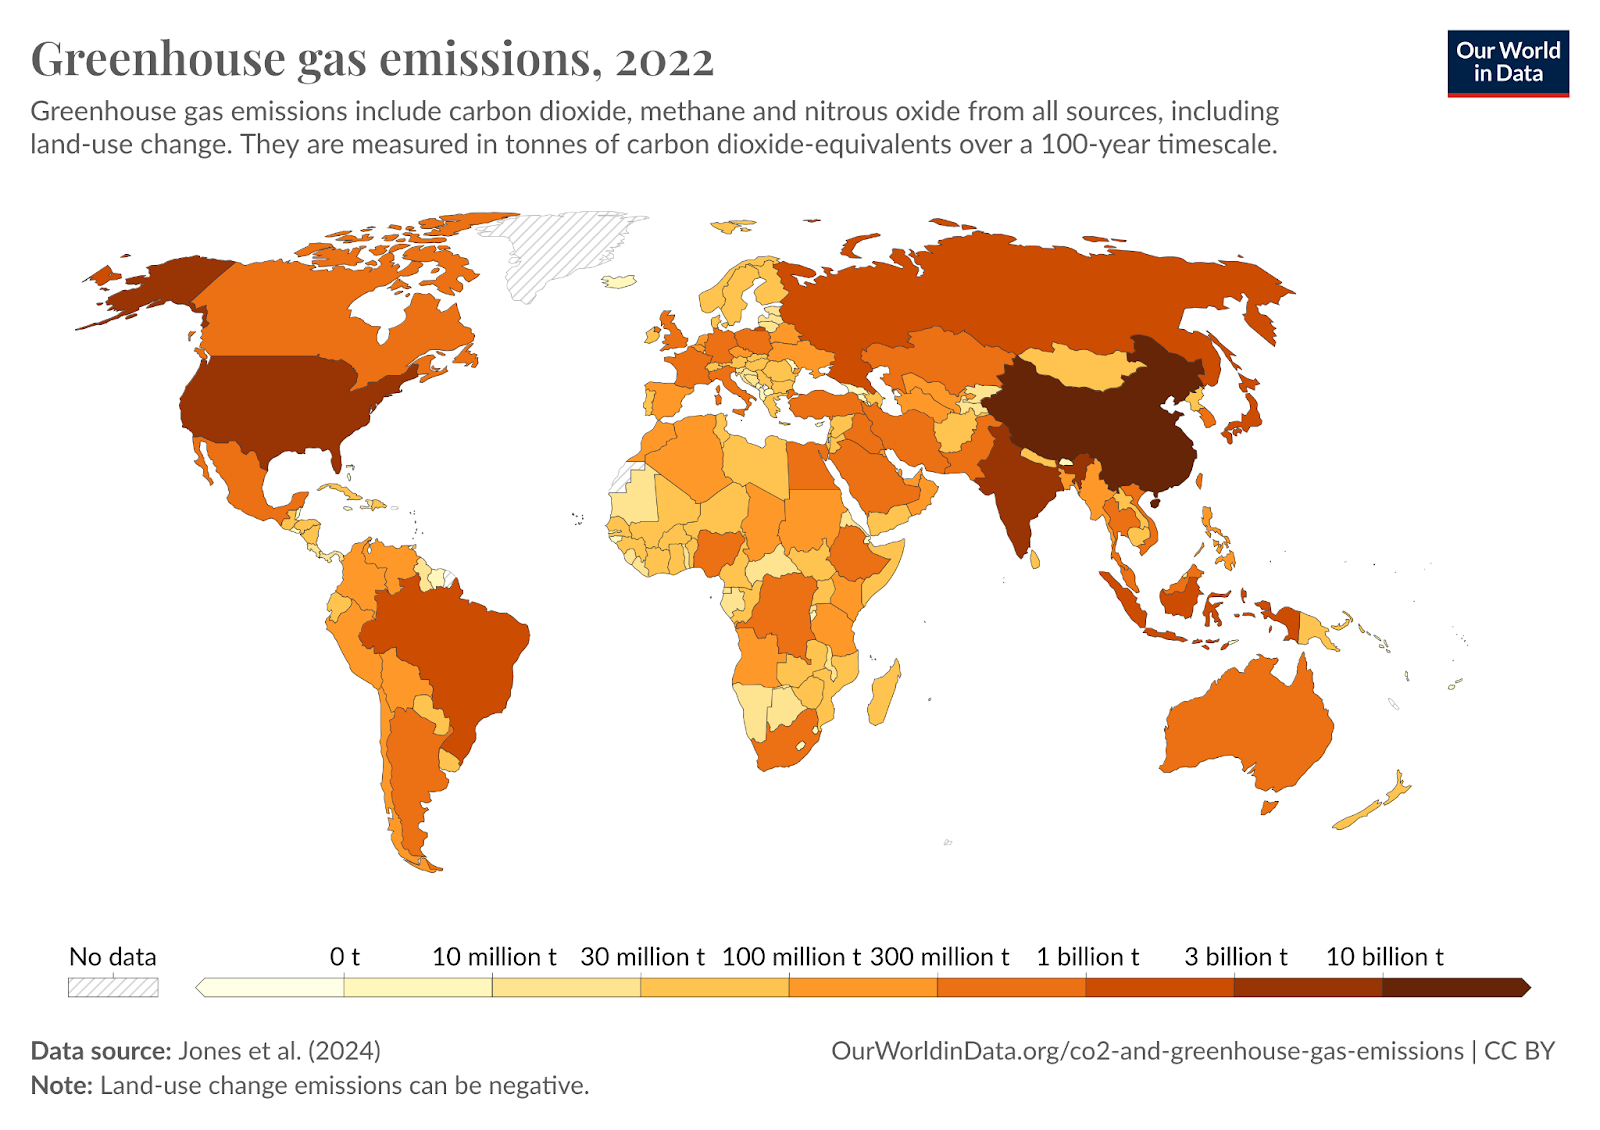
Different countries contribute differently to greenhouse gas emissions. Some countries produce a lot because of heavy industrial activity or large populations.
- China: The largest emitter, about 35% of global C02 emissions, mainly due to coal-heavy power and industry.
- USA: Second, around 15%, mostly from transport and industry.
- India: Third, 7%, growing fast due to industrialization and population growth.
- European Union: 7% collectively, slowly reducing due to renewable energy adoption.
- Russia & Brazil: 5% each; Russia mainly fossil fuels, Brazil from deforestation.
Per Capita Emissions:
- China: Higher than the global average, meaning each person emits more than the average person worldwide.
- India: Only 2 tonnes per person, less than half the world average, showing lower per-person emissions.
| Country / Region | Global Share (%) | Per Capita Emissions (t CO2) | Explanation |
| China | 35 | 10 | The coal-heavy industry and large population drive high emissions. |
| USA | 15 | 16 | High energy use per person, especially in transport and industry. |
| India | 7 | 2 | Growing emissions, but low per person due to population spread. |
| EU | 7 | 7 | Emissions are reducing due to renewables and efficiency measures. |
| Russia | 5 | 12 | Fossil fuel production is a major source. |
| Brazil | 5 | 3 | Deforestation and agriculture contribute the most. |
Emissions by Gas Type
(Source: researchgate.net)
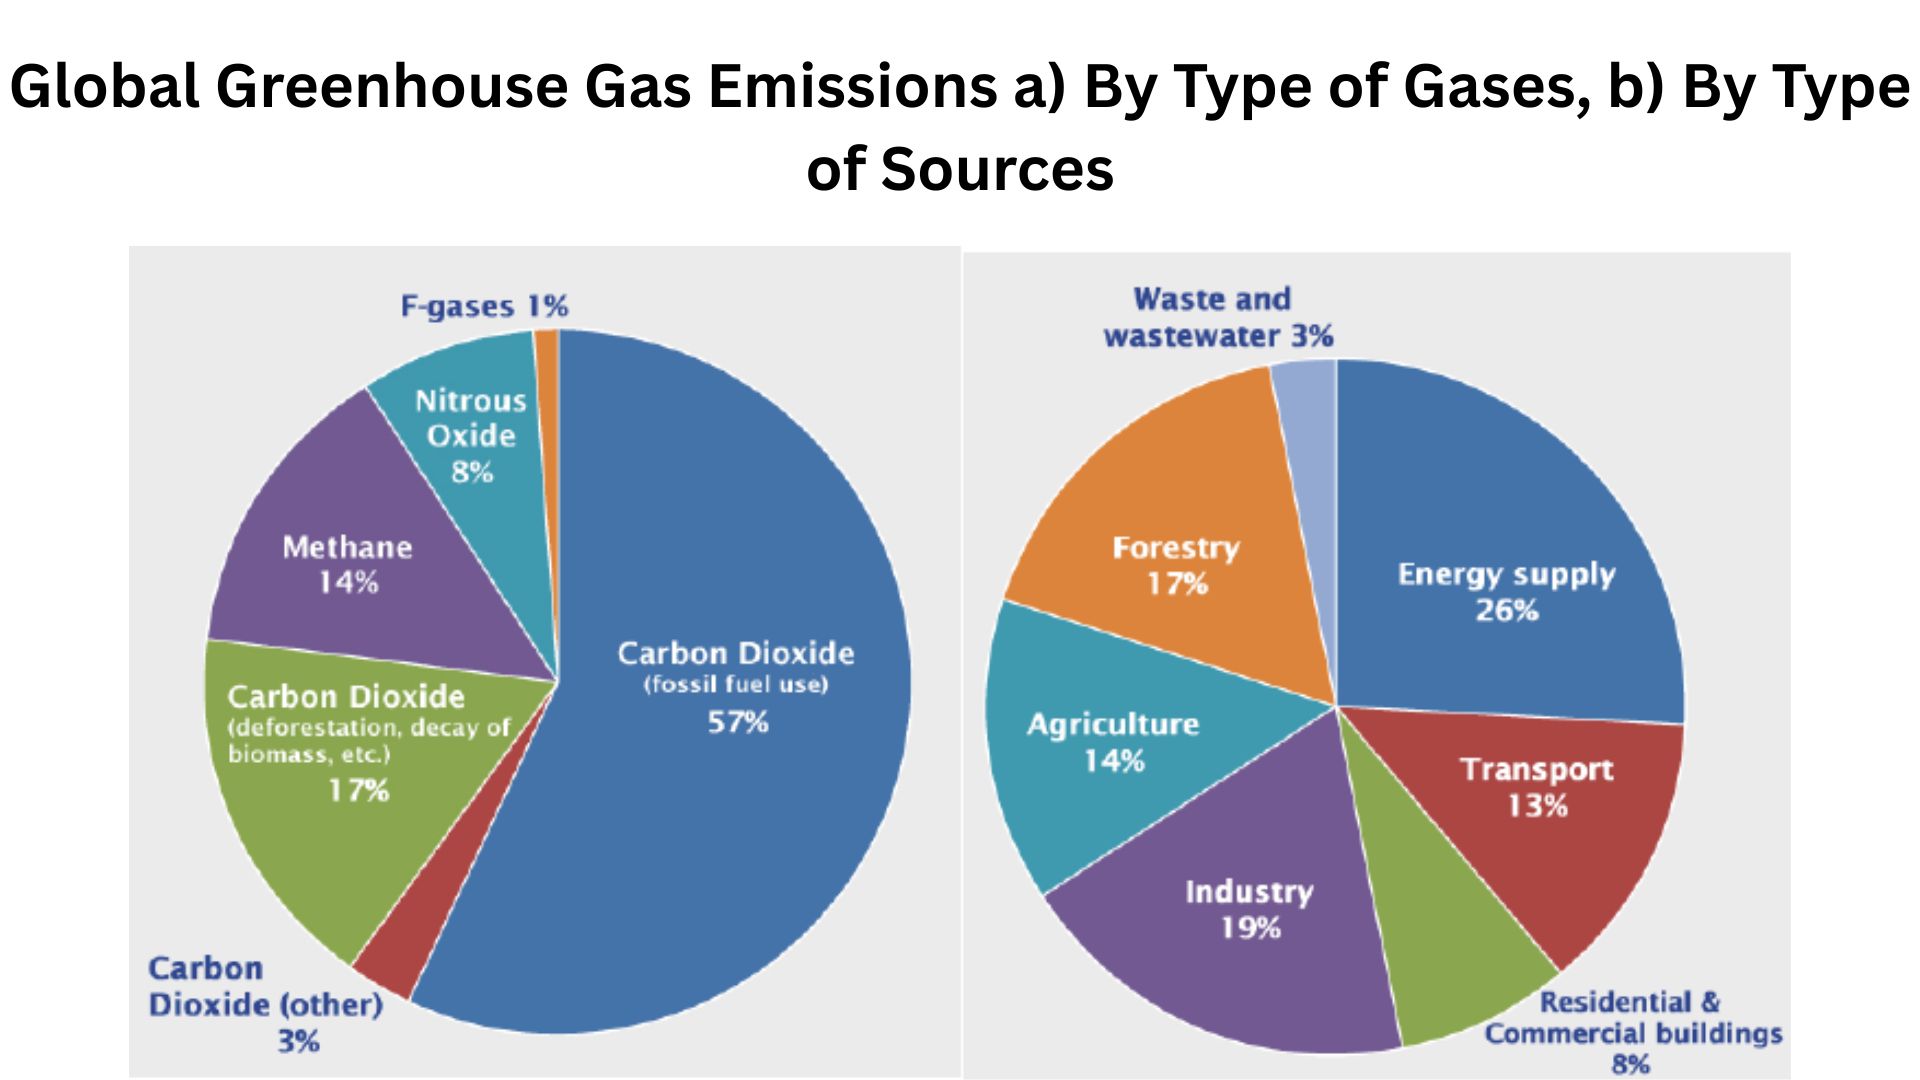
Each greenhouse gas has a different effect on warming and comes from different sources.
- C02: Most significant greenhouse gas, produced through the burning of coal, oil, and gas. Remains in the atmosphere for decades.
- Methane (CH4): More potent than CO2 in retaining heat, but less persistent. Found in cow guts, garbage dumps, and gas leaks in pipelines.
- Nitrous oxide (N20): Highly effective as a greenhouse gas, found mostly in farms using fertilizers and in some industries.
- Fluorinated gases: Human-made gases that remain in the atmosphere for years. Used in cooling and electronic systems.
| Gas Type | Share of Total Emissions (%) | Main Sources | Explanation |
| Carbon Dioxide (C02) | 79 | Fossil fuels, deforestation | Most common GHG, long-lasting, main driver of warming. |
| Methane (CH4) | 11 | Livestock, landfills, and gas leaks | Stronger heat-trapper than C02 but shorter-lived. |
| Nitrous Oxide (N20) | 6 | Fertilizers, agriculture | Potent gas contributes to long-term warming. |
| Fluorinated Gases | 3 | Refrigeration, electronics | Man-made, very powerful, lasts long in the atmosphere. |
Sector-wise Emissions Breakdown
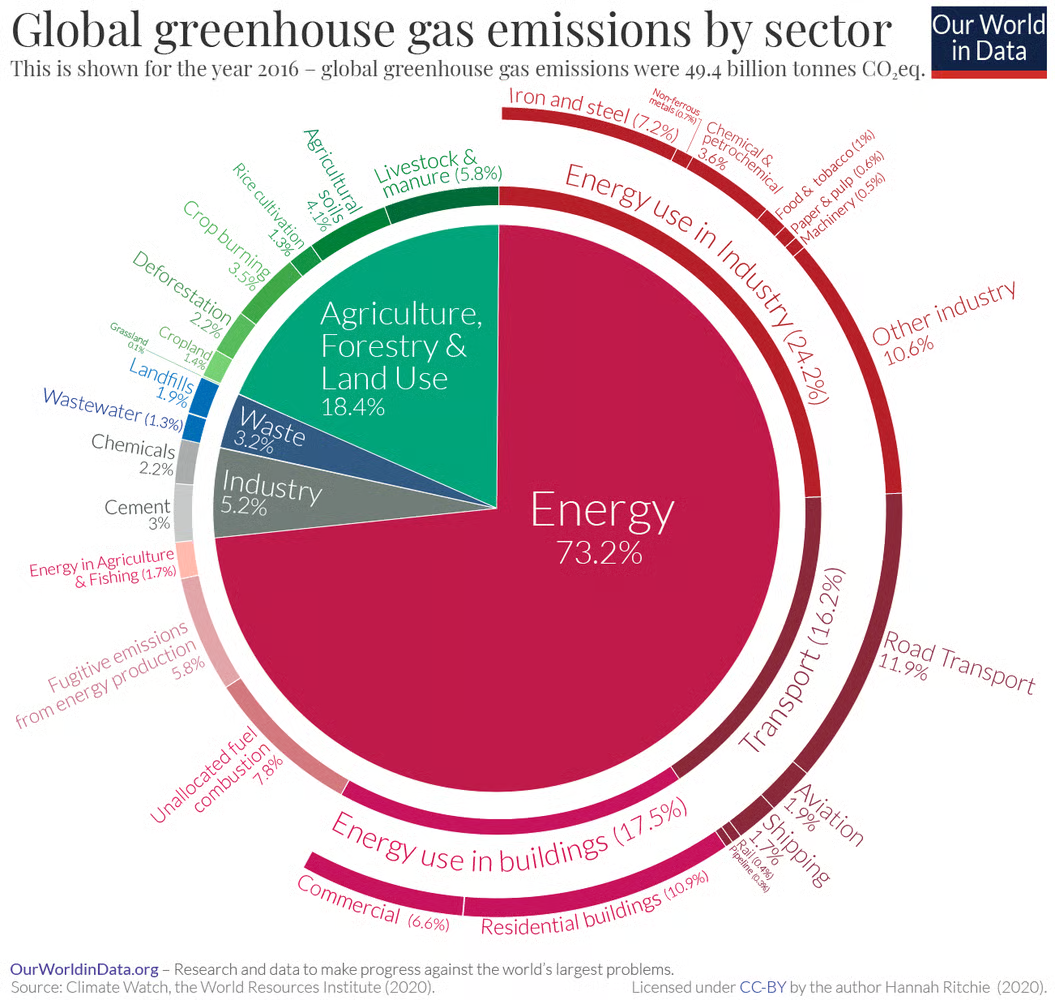
(Source: ourworldindata.org)
Global greenhouse gas emissions come from different sectors, and each contributes differently depending on human activity and energy use.
- Electricity and Heat Production: The largest contributor at 34%. Coal, oil, and natural gas power plants release huge amounts of C02. Even countries moving to renewables still rely on fossil fuels in many areas.
- Industry: Accounts for 24%. Factories, cement production, steelmaking, and chemical plants burn fuels and produce emissions as part of the production process.
- Agriculture, Forestry, and Other Land Use (AFOLU): 22%. Livestock like cows release methane, rice paddies produce CH4, and deforestation adds C02.
- Transportation: 15%. Cars, trucks, planes, and ships burn fossil fuels and release C02. Air travel has rebounded post-pandemic, increasing emissions.
- Buildings: 6%. Heating, cooling, and electricity use in homes and offices contribute steadily, especially in colder or hotter regions.
| Sector | Global Share (%) | Main Sources | Explanation |
| Electricity & Heat | 34 | Coal, oil, and gas plants | Largest contributor: fossil fuel dependence is key. |
| Industry | 24 | Factories, cement, steel, chemical plants | Emissions come from production processes and on-site energy use. |
| Agriculture & Land Use | 22 | Livestock, rice paddies, and deforestation | Methane from cows, C02 from forest clearing, N20 from fertilizers. |
| Transportation | 15 | Cars, trucks, planes, ships | Fossil fuels for moving people and goods; air travel is growing fast. |
| Buildings | 6 | Heating, cooling, and electricity | Homes and offices consume energy, adding to emissions. |
Trends and Observations
(Source: nature.com)
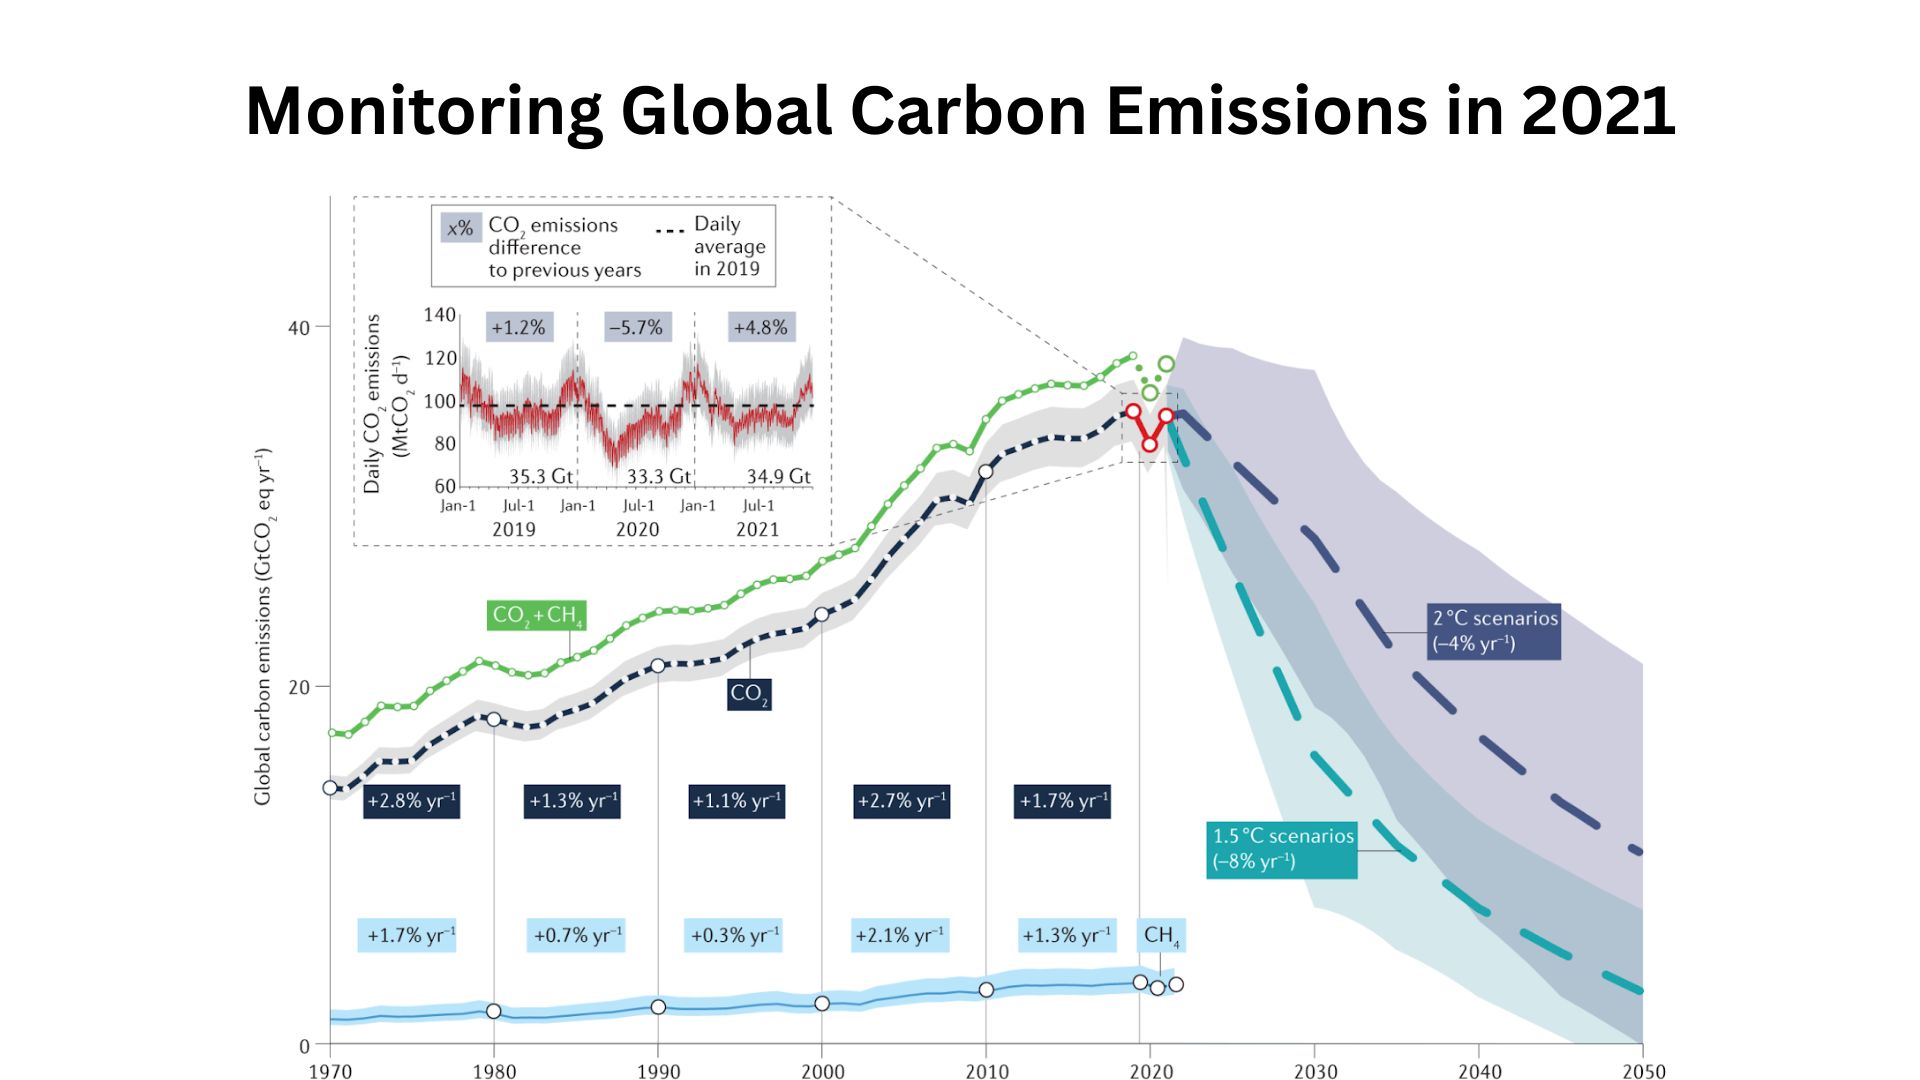
Understanding trends helps to know whether greenhouse gas emissions are increasing or decreasing and which areas need urgent action.
- Rising Emissions Globally: Despite climate agreements, global emissions continue to rise. Fossil CO2 emissions reached a record 38.1 GtCO2 in 2025, up approximately 1.1% from 2024.
- Sector Shifts: Transport emissions are increasing as people travel more post-pandemic, while some countries reduce industry emissions with cleaner energy.
- Regional Variations: Asia’s emissions are growing due to industrialization and energy demand. Europe and North America have slowed growth thanks to renewables and energy efficiency.
| Observation | Trend / Notes |
| Overall Trend | Increasing globally, 1.1% rise from 2024 |
| Sector Shifts | Transport emissions are rising; some industrial decline |
| Regional Differences | Asia rising; Europe & North America slowing growth |
Mitigation Efforts
(Source: sciencedirect.com)
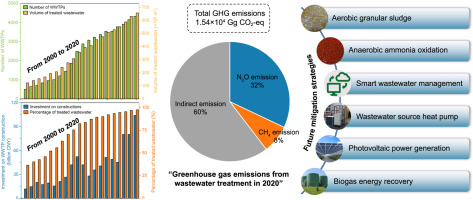
Many countries and organizations are working to reduce greenhouse gas emissions through policies, technologies, and renewable energy.
- Renewable Energy: Solar, wind, and hydro power replace coal and gas. Some regions already get 50%+ of electricity from renewables.
- Energy Efficiency: There is an increased effort being made to become more energy efficient by using less energy to produce the same product.
- Carbon Capture: This technology involves capturing CO2 from power plants or from the atmosphere. It is still at its early stages of development.
| Strategy | Description / Notes |
| Renewable Energy | Solar, wind, and hydro reduce reliance on fossil fuels |
| Energy Efficiency | Better insulation, efficient appliances, and industrial upgrades |
| Carbon Capture | Captures C02 before it reaches the atmosphere; still early |
Recent Greenhouse Gas Emissions Developments
- In March 2025, the International Energy Agency (IEA) reported that energy-related CO2 emissions rose by 1.1% in 2024, reaching 37.8 billion tonnes, driven largely by increased fossil fuel consumption in developing economies.
- In April 2025, NASA released data showing that atmospheric CO2 concentrations surpassed 425 parts per million (ppm) for the first time in recorded history, highlighting the urgent need for accelerated global climate action.
- In May 2025, the European Union reported a 9% reduction in greenhouse gas emissions in 2024 compared to 2023, largely attributed to the rapid expansion of solar and wind energy capacity across member states.
Future Projections
(Source: eia.gov)
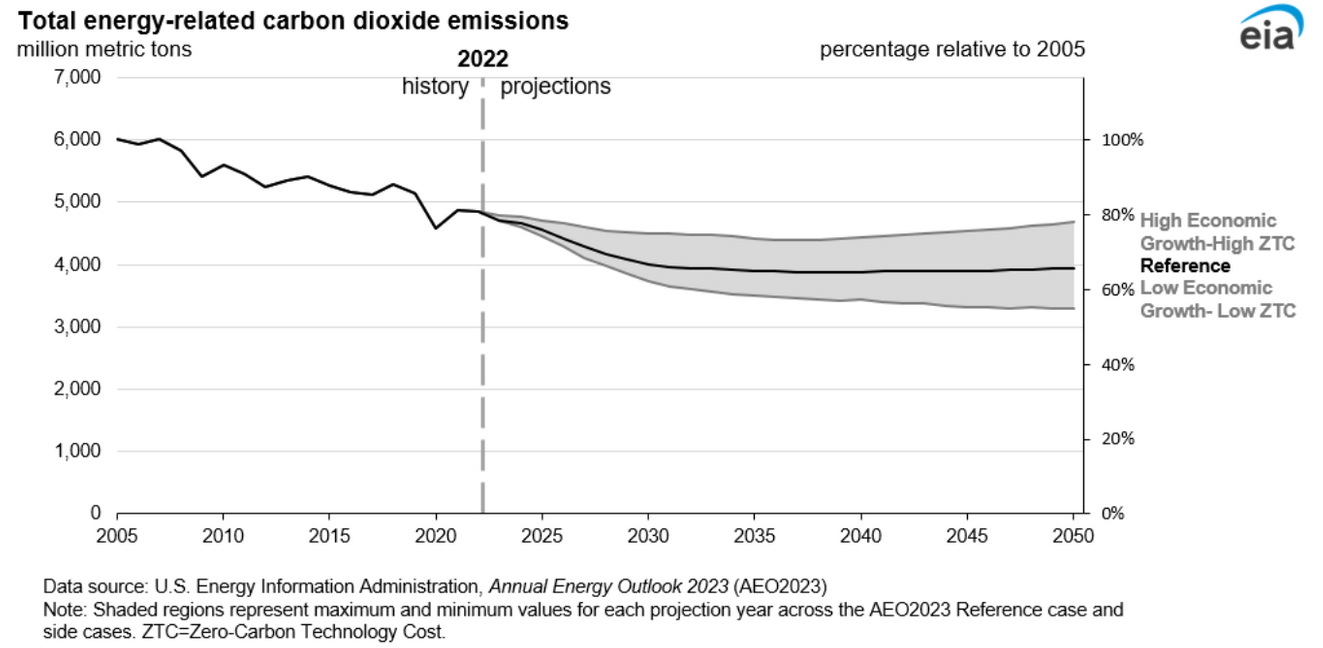
If current trends continue, greenhouse gas emissions will continue to rise, worsening climate impacts.
- Business-as-Usual: Without major changes, global emissions could exceed 55 Gt CO2 by 2030, increasing the risk of extreme heat, floods, and sea-level rise.
- Aggressive Mitigation: Combining renewable energy, energy efficiency, and carbon capture could stabilize or reduce emissions, keeping warming below 2°C.
- Partial Measures: Even small reductions in key sectors can slow the growth, but won’t be enough to avoid severe climate impacts.
| Scenario | Expected Outcome |
| Business-as-Usual | Emissions continue rising; severe climate impacts |
| Aggressive Mitigation | Stabilization or reduction; warming below 2°C possible |
| Partial Measures | Slower growth; impacts still significant |
Final Thoughts
So, overall, in simple terms, greenhouse gas emissions are formed from burning coal and gas, running industries, driving cars, farming, and deforestation; human activities are adding more and more of these gases every year. These greenhouse gas emissions statistics show us exactly where the emissions come from, which countries and sectors are contributing the most, and how fast these numbers are rising.
The statistics make it clear: we cannot ignore emissions. Electricity, industry, transport, and agriculture are the biggest contributors, while countries like China, the USA, and India lead in total emissions. But individual actions, policy changes, and renewable energy adoption can make a real difference.
I want you to learn your carbon footprint, make energy-smart choices, support renewable energy, and spread awareness. Small steps add up to a big impact, and together, we can make a real difference in reducing greenhouse gas emissions. I hope you like this article. If you have any questions, kindly let me know in the comments section.
FAQ
Greenhouse gas emissions are gases released into the atmosphere that trap heat. They act like a warm blanket around the Earth. While natural levels keep the planet warm enough for life, human activities add extra gases that cause global warming and climate change.
Yes, carbon dioxide (CO2) is a primary greenhouse gas. It absorbs infrared energy (heat) radiating from the Earth’s surface and re-radiates it back, which helps trap heat in the atmosphere and keep the planet warm enough to support life.
Carbon dioxide (CO₂) emissions come from burning fossil fuels like coal, oil, and gas, industrial processes like making cement, and cutting down forests.