





Introduction
Global Warming Statistics: Global warming– most people think it is just about the Earth getting hotter. But the truth is, it is much more than that. It is about rising temperatures, melting ice, stronger storms, changing seasons, and changing lives. Now, when we look at the global warming statistics, we are not only looking at numbers on a chart. These stats tell the real story of how our planet is changing and what it means for us.
Think of it this way. If the Earth had a health report, global warming statistics would be the test results. They show how much the temperature has gone up, how fast the seas are rising, how greenhouse gases are building up in the atmosphere, and how many species are struggling to survive.
The reason we dive into these statistics is that numbers don’t lie. When scientists say carbon dioxide has crossed 420 parts per million or that sea levels have risen by 20 centimeters since 1900, those are hard facts. And these facts help us understand the scale of the problem. Without these stats, global warming would remain a vague idea, but with them, we can see the evidence in clear and measurable ways.
In this article, I’m going to walk you through the most important global warming statistics. We’ll look at how temperatures have changed, how much ice we are losing, how seas are rising, and even how these changes affect our health, food, and economy. By the end, you’ll see the real impact of global warming. Let’s get into it.
Spotlighted by the Editor
- Earth’s average temperature has increased by 2°C since the late 19th century, with 2024 being the warmest year at 1.55°C above pre-industrial levels.
- Carbon dioxide levels have climbed from approximately 280 ppm before industrialization to an estimated 425.3 ppm global average in 2025.
- Atmospheric methane has jumped from 700 ppb to over 1,900 ppb, accelerating warming.
- Nitrous Oxide (N₂O) increased from 270 ppb to 330 ppb, further enhancing the greenhouse effect.
- Oceans have risen by 20 centimeters since 1900, with a recent rate of 3 mm per year (1993 to 2020).
- Over 90% of excess heat from global warming is absorbed by oceans; the top 700 meters have warmed 13°C since 1960.
- Arctic sea ice has dropped by 40% since 1979; glaciers are losing over 1 meter of mass per year in some regions.
- There have been more heat waves, floods, and storms; 2024 had the most occurrences of extreme heat.
- Many animals are going extinct, as are coral reefs due to ocean acidification.
- Heat sicknesses and deaths are up, as are mosquitoes carrying disease; crops are being harmed in several places.
- Climate disasters cost billions annually; insurance claims and infrastructure damages are increasing.
- Renewable energy adoption is rising; carbon capture projects are underway; the Paris Agreement aims to limit warming to 5°C.
Historical Temperature Trends
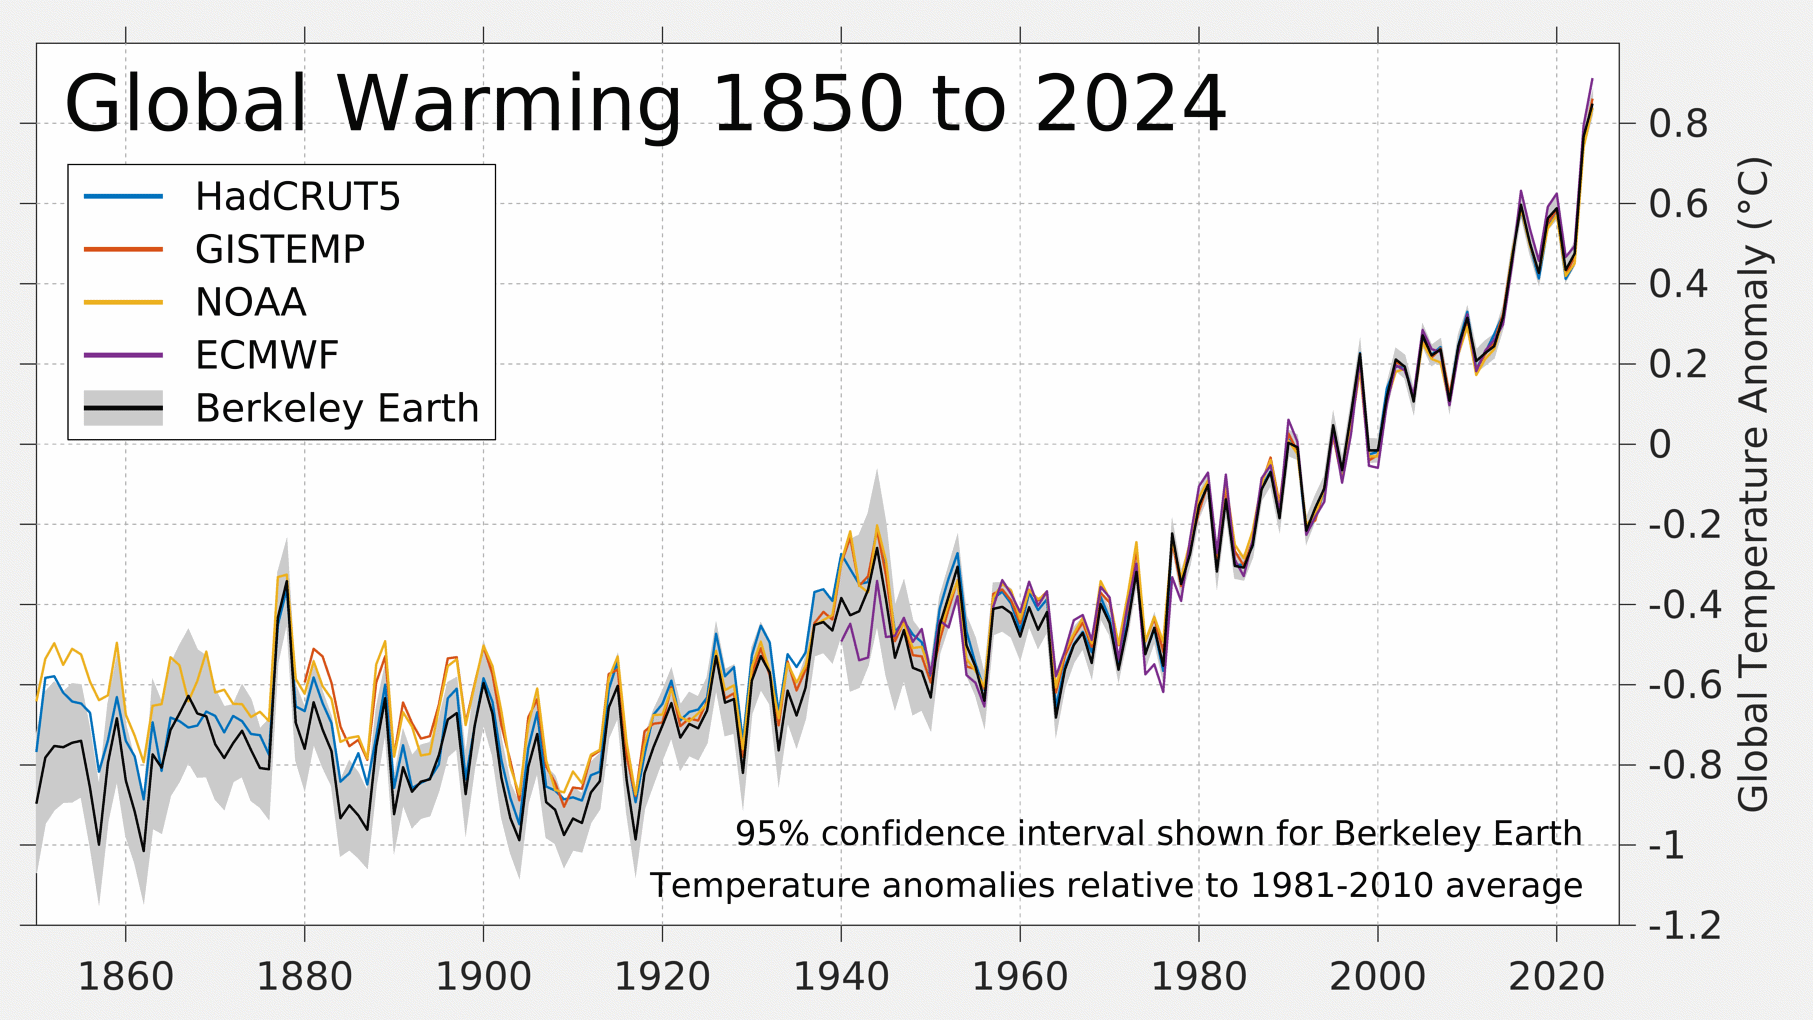
(Source: berkeleyearth.org)
- Pre-Industrial Temperature: Earth’s average surface temperature was roughly 13.7°C before industrialization.
- Recent Warming: Since the 19th century, global temperature has risen about 1.2°C, with the past decade being the warmest.
- Record-Breaking Years: 2024 recorded temperatures 1.55°C above pre-industrial levels, the highest ever measured.
- 2025 was the second or third-warmest year on record, at 1.44°C above pre-industrial levels.
| Metric | Value / Trend |
| Pre-industrial Avg Temp | 13.7°C |
| Temperature Increase since the 19th century | 1.2°C |
| Warmest Year on Record | 2024 |
| Temperature Anomaly 2025 | +1.44°C above pre-industrial levels |
Greenhouse Gas Concentrations
(Source: wmo.int)
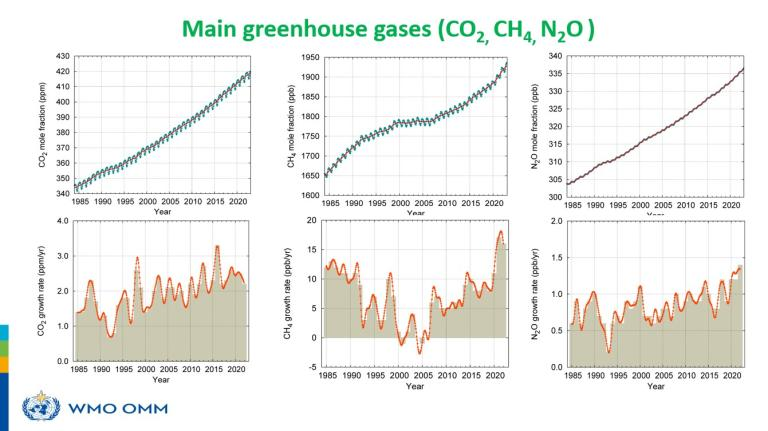
- CO₂ Levels: Rose from 280 ppm pre-industrial to over 425.3 ppm in 2025.
- Methane (CH₄): Increased from 729 ppb in 1,942 ppb in 2024, a 166% rise above pre-industrial levels.
- Nitrous Oxide (N₂O): Climbed from 270 ppb in 338.0 ppb in 2024, a 25% increase above pre-industrial levels
| Gas | Pre-Industrial Levels | Current Levels |
| CO₂ | 280 ppm | 425.3+ ppm (2025) |
| Methane CH₄ | 729 ppb | 1,942+ ppb (2024) |
| Nitrous Oxide N₂O | 270 ppb | 338+ ppb (2024) |
Sea Level Rise
(Source: climate.gov)
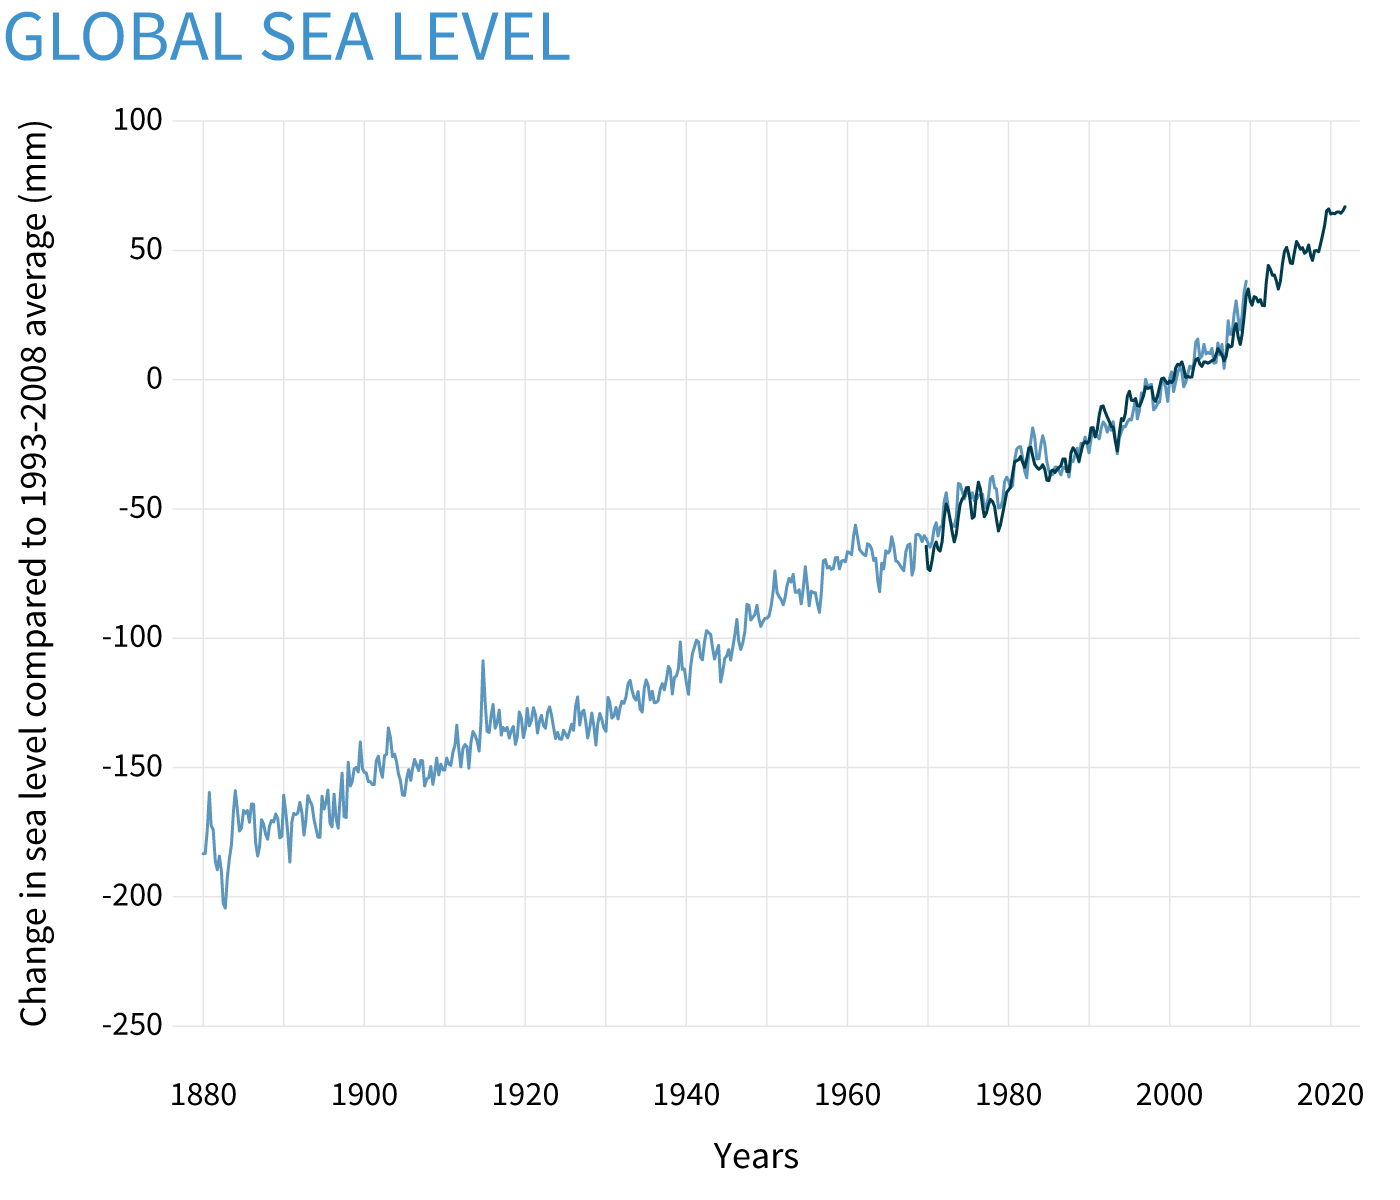
- Global Increase: Sea levels have risen by about 20 cm since 1900.
- Recent Rate: From 1993 to 2024, global mean sea level rose at an average rate of 3.4 mm per year; the pace accelerated further to 4.7 mm per year during 2014–2023.
- Impact Areas: Low-lying coastal cities face flooding and erosion.
| Aspect | Statistic / Trend |
| Sea Level Rise Since 1900 | 20 cm |
| Rate (1993 to 2024) | 3.4 mm per year |
| High-Risk Areas | Coastal cities, islands |
Ocean Warming
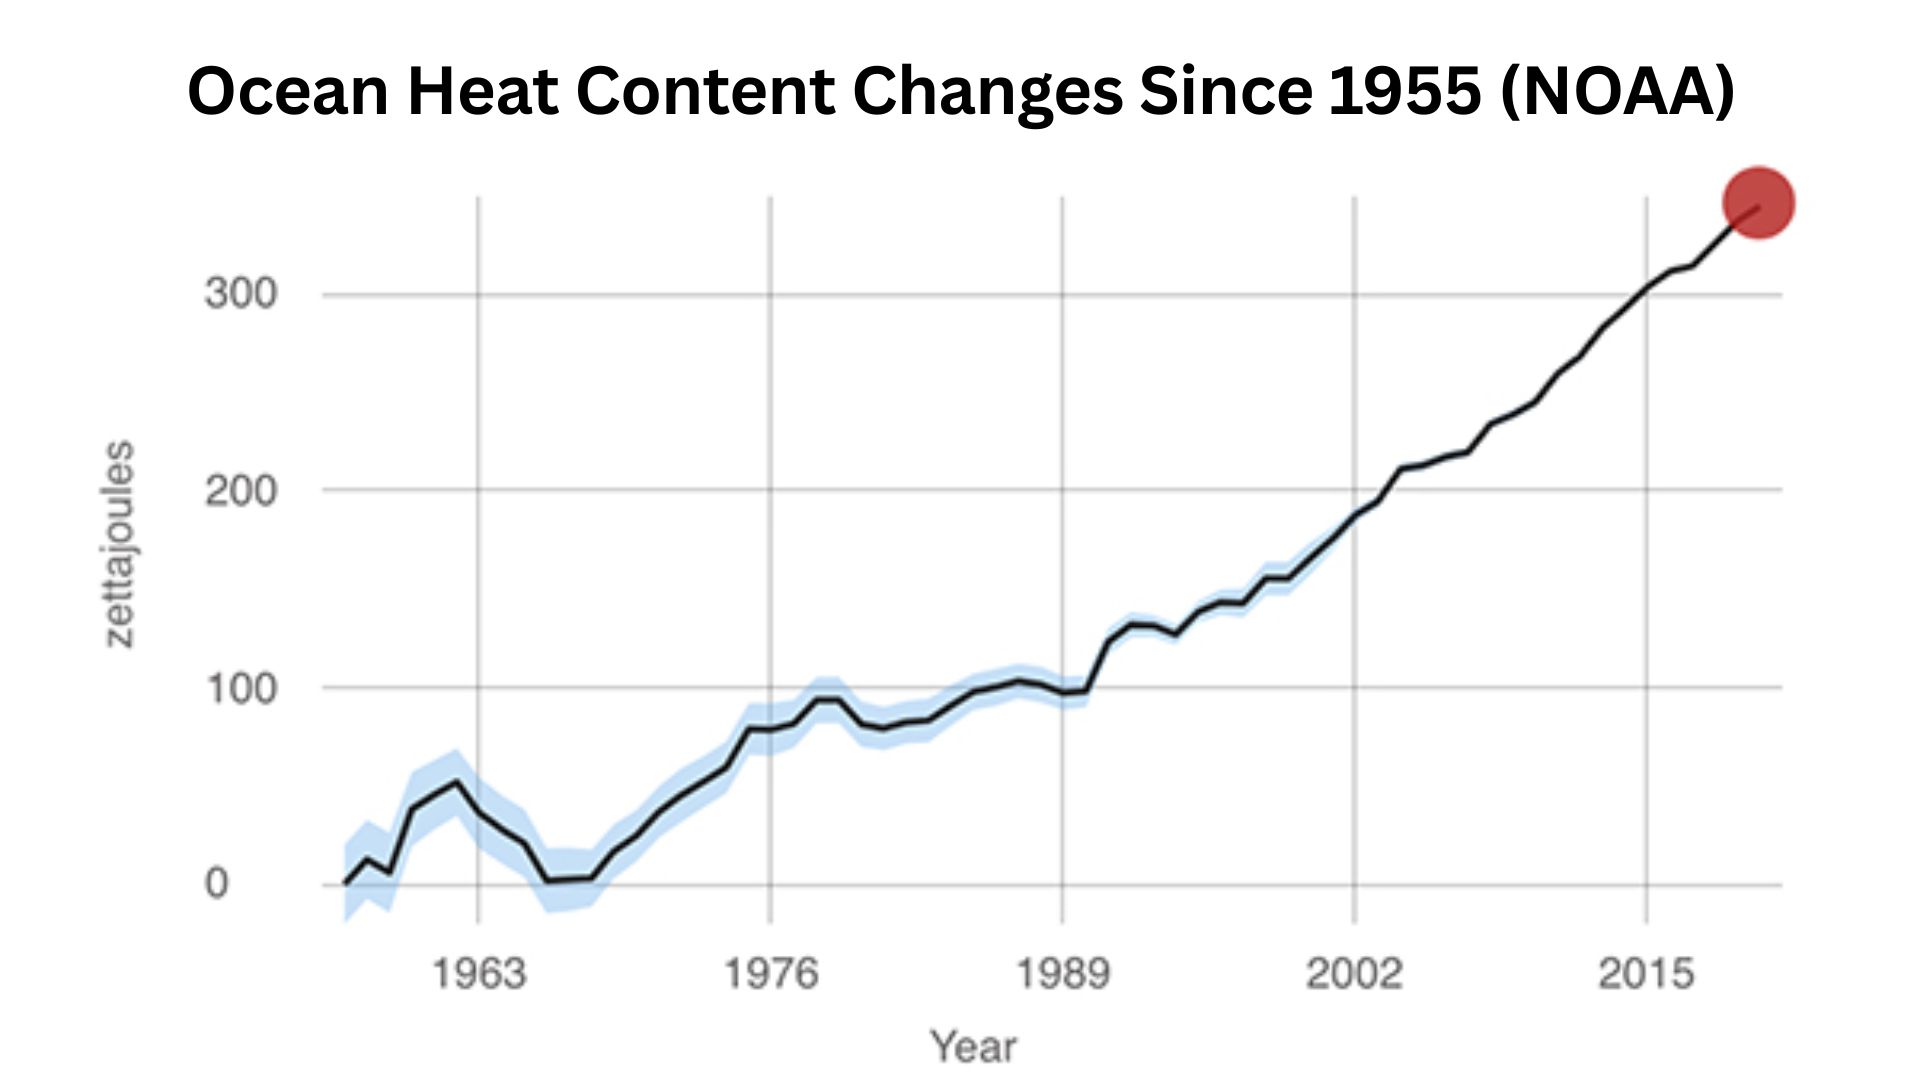
(Source: climate.nasa.gov)
- Heat Absorption: Oceans absorb over 90% of the excess heat caused by global warming.
- Temperature Increase: The Top 700 meters of the ocean have warmed by 0.13°C since 1960.
- Impact: Warmer oceans contribute to stronger storms and coral bleaching.
| Aspect | Statistic / Trend |
| Ocean Heat Absorption | 90% of the global warming heat |
| Temperature Increase (top 700m) | 0.13°C since 1960 |
| Consequences | Stronger storms, coral bleaching |
Ice Melt and Glacial Retreat
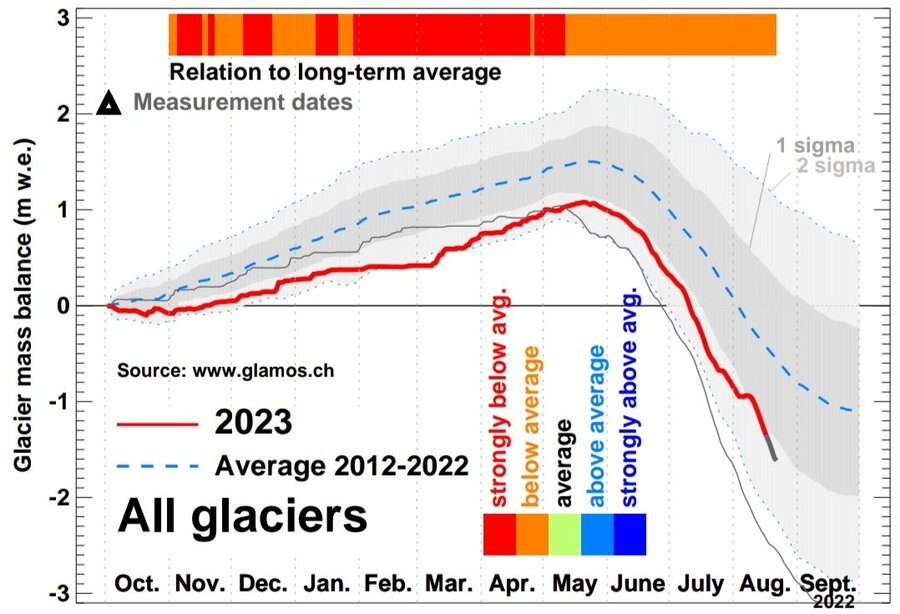
(Source: genevaenvironmentnetwork.org)
- Arctic Sea Ice: Declined by about 40% since 1979.
- Glaciers: Many glaciers worldwide are losing more than 1 meter of mass per year.
- Antarctica and Greenland: Rapid ice loss contributing to sea level rise.
| Ice Feature | Trend / Statistic |
| Arctic Sea Ice | 40% reduction since 1979 |
| Glaciers | 1 meter loss/year in many regions |
| Antarctica / Greenland | Rapid ice loss is contributing to sea level rise |
Extreme Weather Events
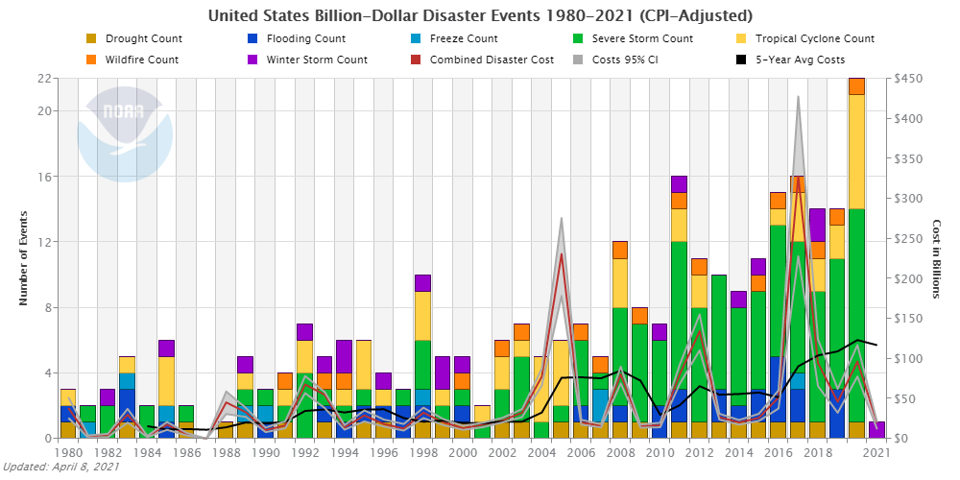
(Source: forbes.com)
- Heatwaves: Frequency and intensity have increased. 2024 had record-breaking events.
- Floods & Droughts: More severe and affecting millions globally.
- Storms & Hurricanes: Increased strength due to warmer oceans.
| Event Type | Trend / Statistic |
| Heatwaves | Record frequency in 2024 |
| Floods / Droughts | Increased severity, widespread impact |
| Hurricanes | Stronger due to ocean warming |
Impact on Biodiversity
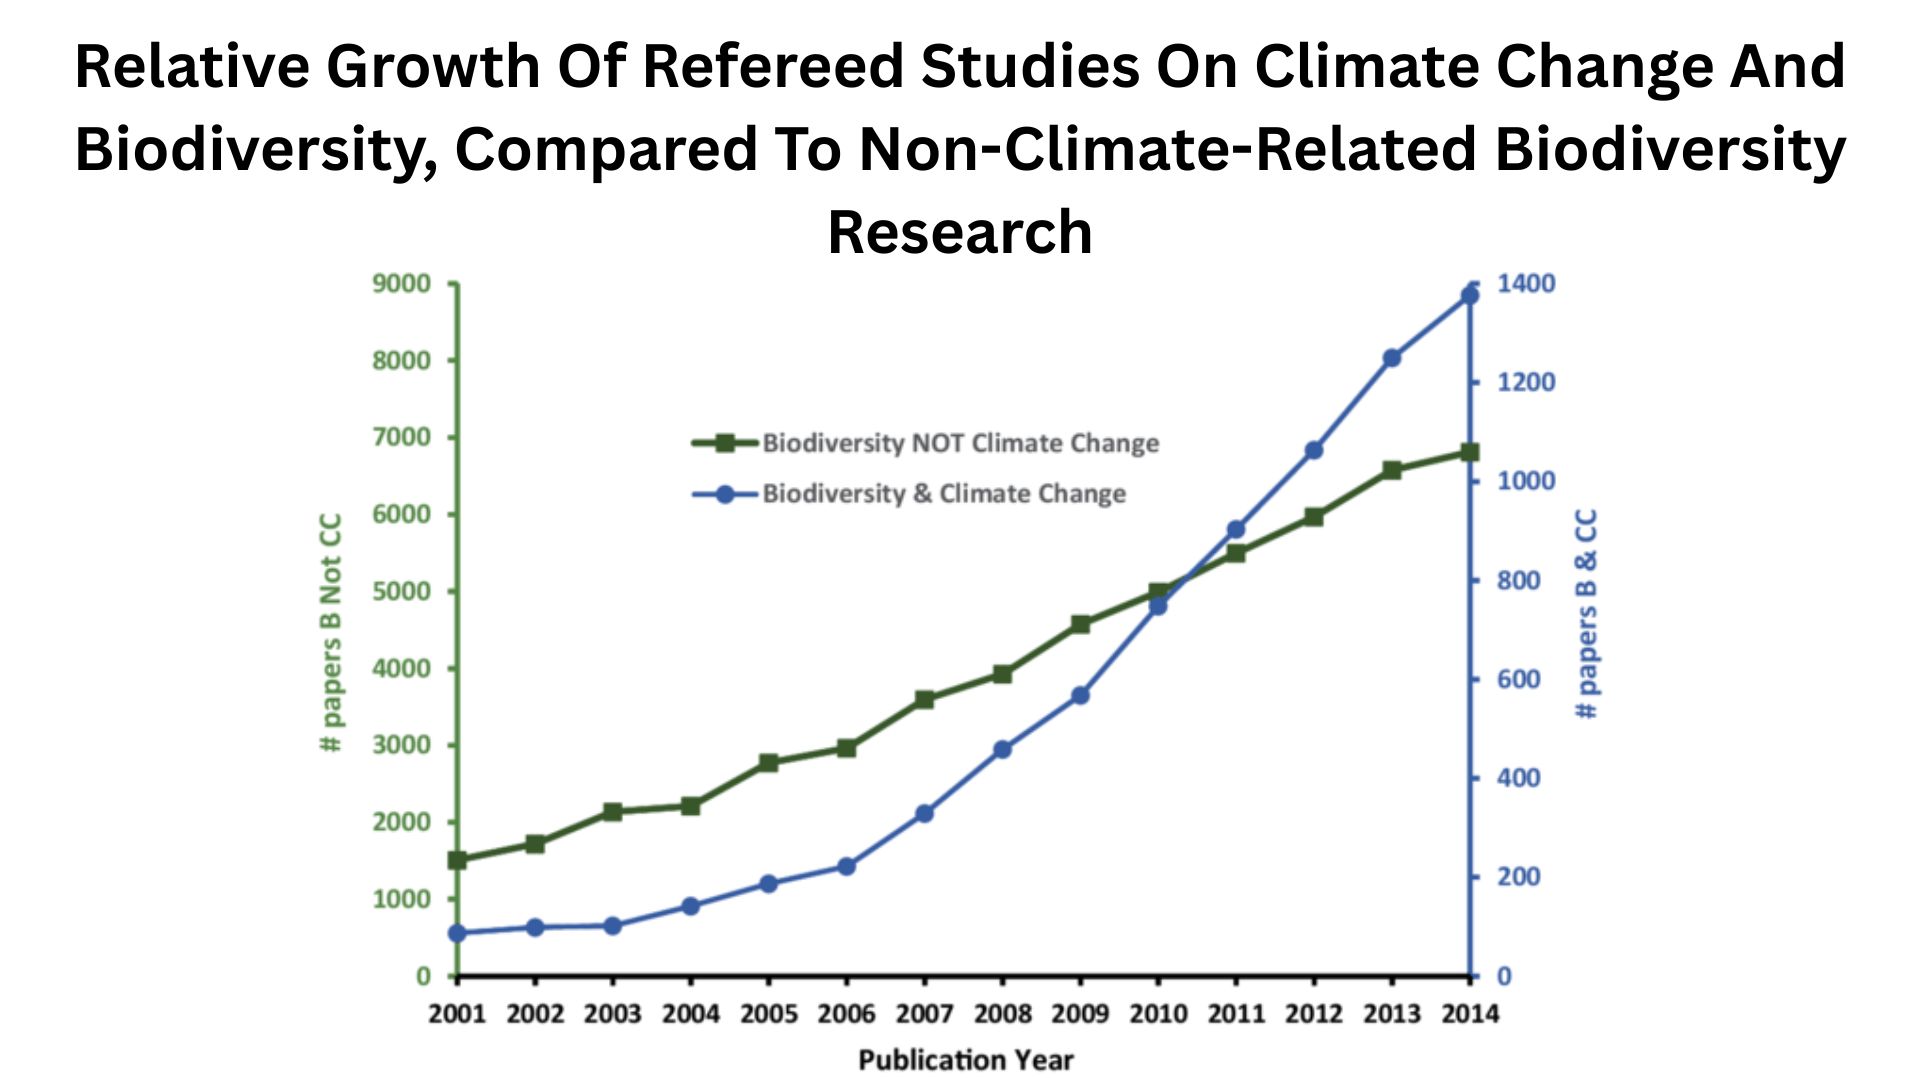
(Source: researchgate.net)
- Species Extinction: Many species face a higher risk due to habitat loss and climate change.
- Ocean Acidification: CO₂ absorption is making oceans more acidic, threatening marine life like corals.
- Ecosystem Shifts: Animals and plants are migrating or dying as climates change faster than they adapt.
| Impact Area | Statistic / Trend |
| Species at Risk | Many facing extinction |
| Ocean Acidification | Increased, damaging marine life |
| Ecosystem Changes | Migration or loss of species |
Human Health and Agriculture
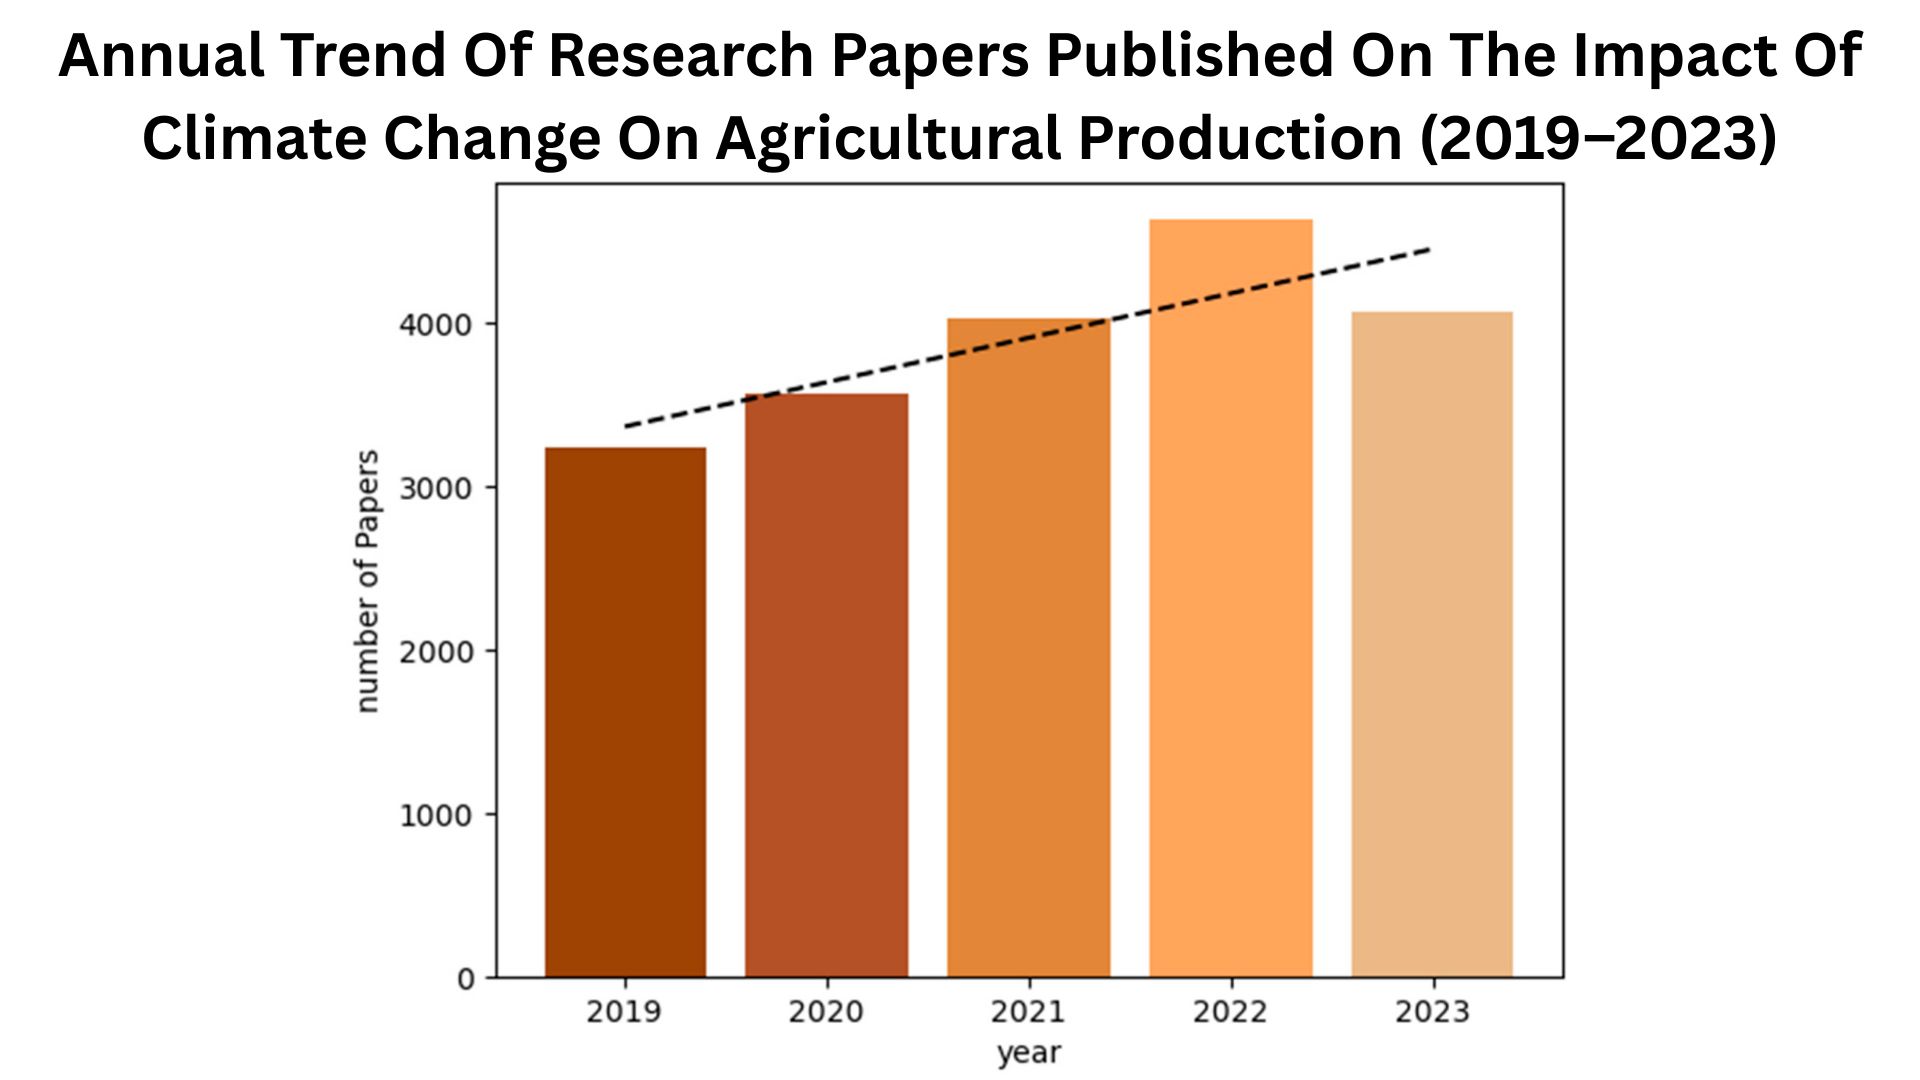
(Source: mdpi.com)
- Heat Illnesses: Increased heat leads to more health problems and deaths.
- Food Production: Climate change affects agricultural yields due to extreme weather, rainfall, and temperature.
- Disease Transmission: Warm climate increases habitat areas for disease carriers like mosquitoes.
| Aspect | Statistic / Trend |
| Heat-Related Illness | Rising globally |
| Crop Yields | Declining in many regions |
| Disease Spread | Mosquito habitats expanding |
Economic Impacts
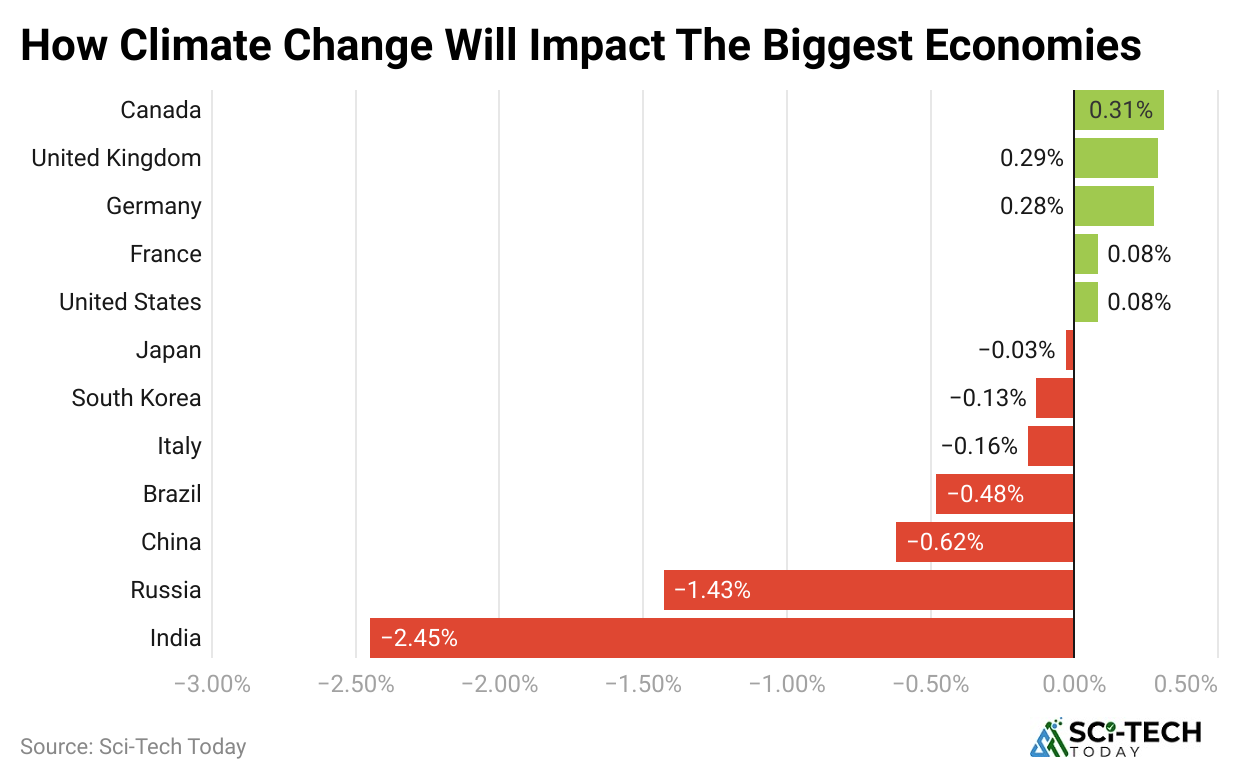
(Reference: statista.com)
- Disaster Costs: Extreme weather damages cost billions yearly.
- Insurance Losses: Increased claims as storms, floods, and heatwaves worsen.
- Infrastructure Damage: Roads, bridges, and buildings affected by climate events.
| Economic Factor | Statistic / Trend |
| Damage Costs | Billions per year |
| Insurance Losses | Rising due to extreme weather |
| Infrastructure Impact | Increasingly vulnerable |
Mitigation and Adaptation Efforts
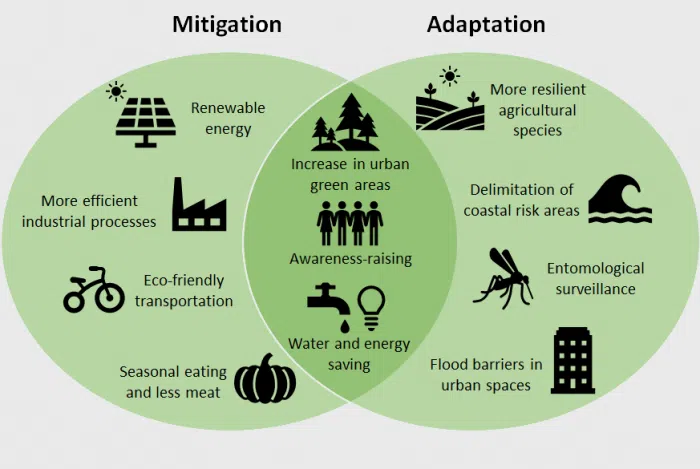
(Source: climateimpactstracker.com)
- Renewable Energy: Solar and wind adoption are rising to reduce emissions.
- Carbon Sequestration: Efforts to capture and store CO₂ are underway.
- International Agreements: Paris Agreement targets limiting warming to 1.5°C.
| Effort Type | Current Status / Trend |
| Renewable Energy | Increasing adoption |
| Carbon Sequestration | Being developed globally |
| Policy / Agreements | Paris Agreement is active, and countries are reducing emissions |
The End
Therefore, from the global warming facts above, one can see how rapidly our Earth is changing. There is global warming, melting ice caps, rising sea levels, and the occurrence of weather extremes. These facts are not mere figures but reflect their effects on the environment, people, and the future.
The good news is, we can still make a difference. By reducing emissions, switching to renewable energy, protecting forests, and supporting climate-friendly policies, we can slow down global warming and protect life on Earth. I hope you like this article. If you have any questions, kindly let me know in the comments. Thanks.
FAQ
Global warming refers to the long-term rise in Earth’s average surface temperature caused by increasing greenhouse gas emissions from human activities like burning fossil fuels and deforestation. It is a key driver of climate change worldwide.
As of 2025, Earth’s average temperature has risen by approximately 1.2°C to 1.3°C above pre-industrial levels. Scientists warn that exceeding 1.5°C could trigger severe and irreversible climate impacts globally.
Global warming is causing rising sea levels, more frequent extreme weather events, melting ice caps, and disruptions to ecosystems worldwide. These changes pose serious threats to food security, biodiversity, and human health across the planet.