
Introduction
Precision Agriculture Statistics: When you hear the word farming, you probably imagine soil, seeds, and a farmer working in the fields, right?. But farming today has gone way beyond that. It’s become smart. That’s exactly why these precision agriculture statistics are so important. They show us how technology like GPS, drones, and sensors is being used to check what each corner of a farm needs, instead of treating the whole field the same.
This industry is already worth billions, and it’s growing faster every year. Farmers using these methods are not only getting better yields but also saving water, cutting down on fertilizer, and reducing pesticides.
In this article, I’ll walk you through the journey of precision agriculture, where it started, how it’s spreading, and the latest precision agriculture statistics that prove just how much it’s changing farming today. Let’s break everything down.
Editor’s Choice
- Precision Agriculture originated in the 1980s, first with grid soil sampling in the US.
- By the 1990s, GPS-enabled tractors and sensors improved planting accuracy and cut costs.
- The global precision agriculture market is valued at USD 9 to 13 billion (2024).
- Forecasts expect it to hit USD 20 to 30 billion by 2030 to 2034, at a 12 to 15% CAGR.
- North America leads the market with a 40 to 45% share, while Asia-Pacific grows fastest (13% CAGR).
- 68% of farmers worldwide have adopted some form of precision farming.
- 75% of farmers using it report higher crop yields.
- Fertilizer use drops by 20 to 30% and pesticide use by about 15% under precision farming.
- Drone usage in agriculture grew 35% in 2022, and 65% of operations use satellite imagery.
- On livestock, about 40% of dairy farms in developed countries use precision sensors.
- Hardware dominates the market with a 55% share, but software is the fastest-growing segment.
- Yield monitoring is the biggest application; irrigation management is the fastest-expanding one.
| Category | Key Statistic (2024 to 2025) |
| Market size (2024) |
USD 9 to 13 billion |
|
Forecast market size |
USD 20 to 30 billion by 2030 to 2034 |
| Growth rate (CAGR) |
12 to 15% |
|
Leading region |
North America 43 to 45% share |
| Fastest-growing region |
Asia Pacific 13% CAGR |
|
Farmer adoption |
68% have adopted precision farming |
| Yield improvement |
75% of users report higher yields |
|
Fertilizer savings |
20 to 30% reduction |
| Pesticide savings |
15% reduction |
|
Drone adoption |
35% increase in 2022 |
| Satellite usage |
65% of operations employ satellite imagery |
|
Livestock adoption |
40% of dairy farms use sensors in developed nations |
| Hardware vs Software |
Hardware 55% share, Software fastest growing |
|
Top applications |
Yield monitoring (largest), Irrigation (fastest CAGR) |
Origins of Precision Agriculture
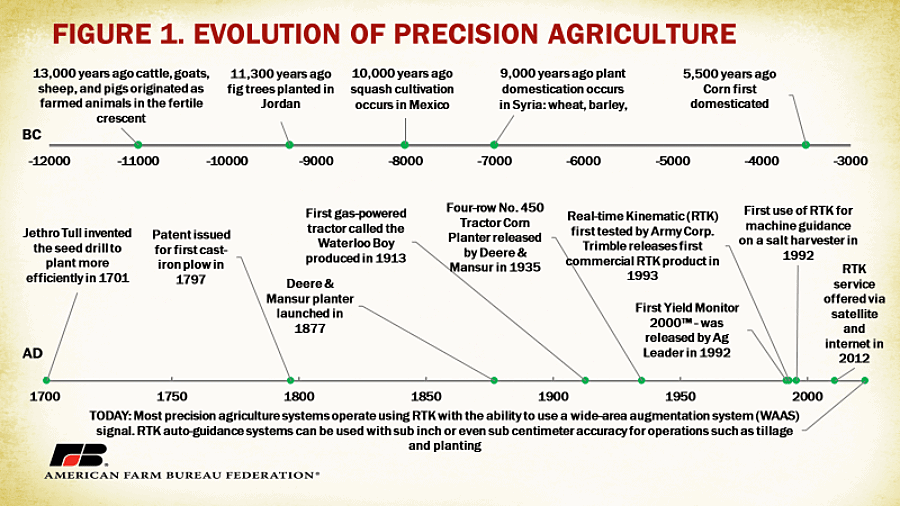 (Source: fb.org)
- The idea of what we now call precision agriculture statistics started in the early 1980s in the US. In 1985, University of Minnesota researchers tried varying lime inputs across crop fields using grid sampling, one sample per hectare.
- That was the start of mapping inputs rather than applying uniformly. Later in the late 1980s, GPS yield sensors joined in with pH/fertilizer maps, so that’s where it really began.
- In the 1990s, GPS tractors emerged, with Stanford researchers adding GPS to John Deere tractors for inch-level planting accuracy by 2000. It boosted yields, cut pesticide use, and allowed 24-hour operations, even in low visibility.
- By the mid-90s and onward, countries like Canada and Australia followed the US. In Europe, the UK was first, then France, in the late 1990s. In Latin America, Argentina led thanks to its Agricultural Technology Institute; Brazil’s Embrapa also began pushing precision tech.
| Period | Development | Impact |
| Mid-1980s | Grid sampling & lime mapping | First input-variable mapping |
| Late-1980s | GPS yield sensors + mapping | Better precision in fertilizing |
| 2000 | GPS-steered tractors | Higher yield, less waste |
| 1990s to 2000s | Spread to Canada, UK, France, LatAm | Broader adoption globally |
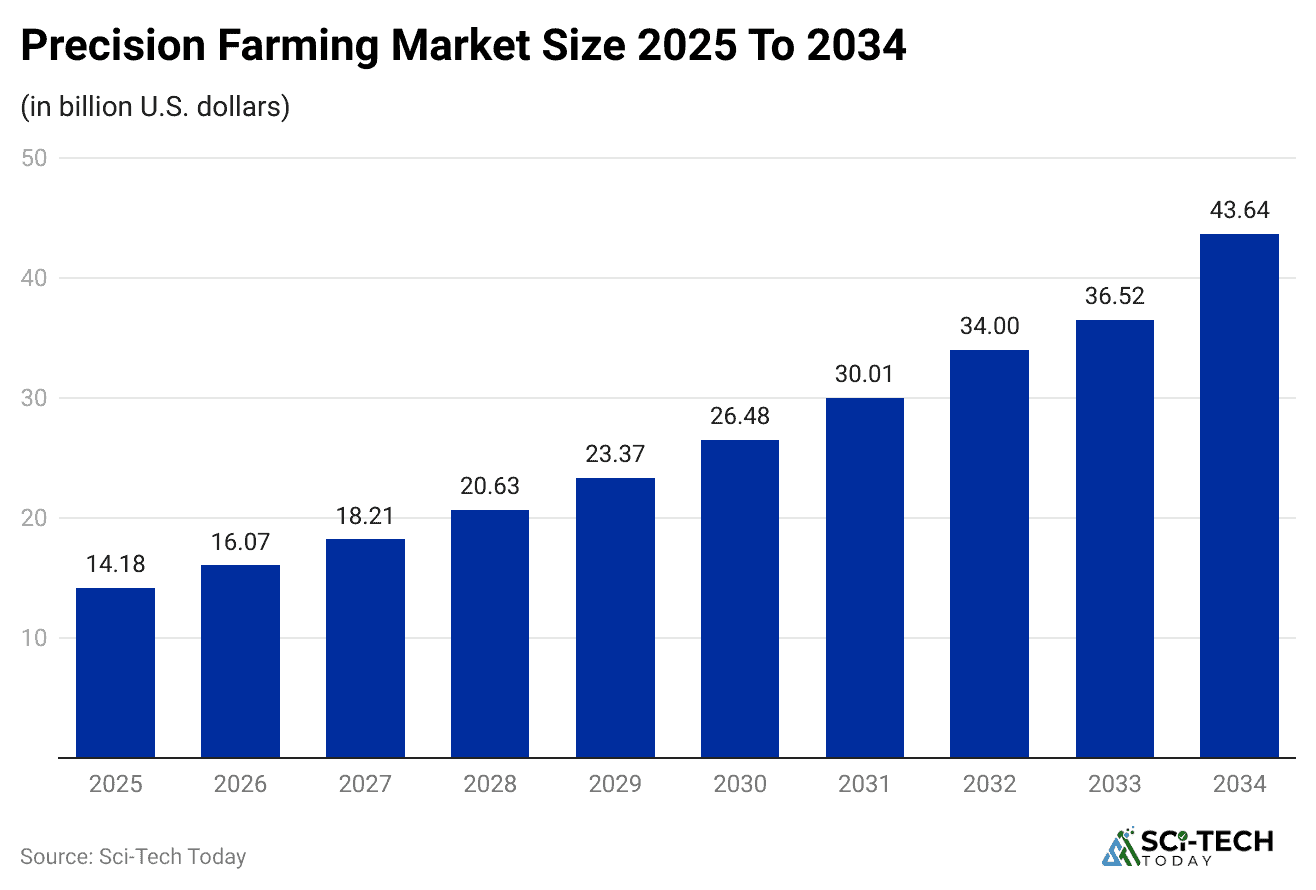
Market Size and Growth
 (Reference: precedenceresearch.com)
- The global precision agriculture market was around USD 9.86 billion in 2024 and is expected to reach USD 22.49 billion by 2034 at a CAGR of 8.59%.
- Another estimate (Grand View Research) pegs it at USD 11.67 billion in 2024, growing to USD 24.09 billion by 2030 at a CAGR of 13.1%.
- Another forecast (Business Research Company) says the market grew from USD 8.86 billion in 2024 to USD 10.24 billion in 2025 CAGR of 15.6% growth rate; expected to hit USD 17.79 billion by 2029 (CAGR 14.8%).
- Yet another (SNS Insider) valued the market at USD 10.35 billion in 2023, targeting USD 29.25 billion by 2032 with a CAGR of 12.24%.
- Precision farming (analytics segment) itself generated USD 3,089.6 million in 2024 and is expected to reach USD 7,069.1 million by 2030, at a CAGR of 15.2%.
- Sci-tech-today says projected USD 13.11 billion in 2024, rising to USD 23.84 billion by 2029, with a CAGR of 12.7%.
| Value (2023-2024) | Forecast (2030-2034) | CAGR |
| USD 9.86 B (2024) | USD 22.49 B (2034) | 8.6% |
| USD 11.67 B (2024) | USD 24.09 B (2030) | 13.1% |
| USD 8.86 B (2024) | USD 17.79 B (2029) | 14.8% |
| USD 10.35 B (2023) | USD 29.25 B (2032) | 12.2% |
| USD 3.09 B (2024) | USD 7.07 B (2030) | 15.2% |
| USD 13.11 B (2024) | USD 23.84 B (2029) | 12.7% |
Regional Adoption and Share
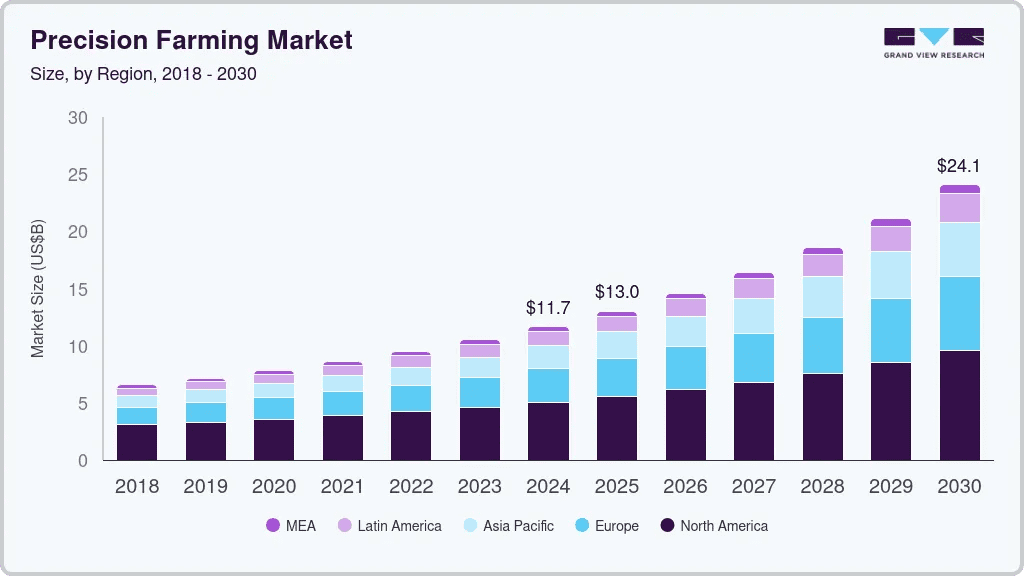 (Source: grandviewresearch.com)
- North America leads with over 43% or even 45% of global revenue from 2023 to 2024.
Sci-tech-today breaks down 2024 regional shares:
#1. North America: 40%, USD 3,940 million
#2. Europe: 30%, USD 2,955 million
#3. Asia Pacific: 23%, USD 2,265 million; highest CAGR of 13.0%
#4. Latin America: 5%, USD 492 million (CAGR 10.4%)
#5. Middle East & Africa: 2%, USD 197 million (CAGR 10.7%)
- SNS Insider notes Asia-Pacific registers the highest CAGR, while North America dominates revenue share.
| Region | Share (2024) | Value (USD million) | CAGR |
| North America | 43 to 45% | 3,900 to 5,200 | |
| Europe | 30% | 2,955 | |
| Asia Pacific | 23% | 2,265 | 13% (highest) |
| Latin America | 5% | 493 | 10.4% |
| Middle East/Africa | 2% | 197 | 10.7% |
Adoption Rates and Impacts
 (Reference: market.us)
- A survey says 68% of farmers have tried or used some form of precision farming techniques.
Worldmetrics data (uncited but from stats page) highlights:
- Projected global market valuation of USD 15 billion by 2028
- GPS adoption rose 70% in the last 5 years
- 68% of farmers adopt precision farming
- 75% of those farmers report increased crop yields
- Precision tech reduces fertilizer use by 20 to 30%
- Pesticide use down by 15%
- Satellite imagery is used in 65% of precision ops
- Drone use grew 35% in 2022
- Sensor-based monitoring is used on 40% of dairy farms in developed countries
- 52% of farms report better resource management.
| Metric | Value/Change |
| Farmer adoption | 68% have tried/used precision |
| Yield improvement among users | 75% report increased yield |
| Fertilizer reduction | 20 to 30% less |
| Pesticide reduction | 15% less |
| GPS adoption growth | +70% over 5 years |
| Drone usage increase (2022) | +35% |
| Satellite imagery usage | 65% of operations |
| Dairy farms using sensors | 40% in developed countries |
| Improved resource management | 52% report better management |
Tech Drivers and Segments
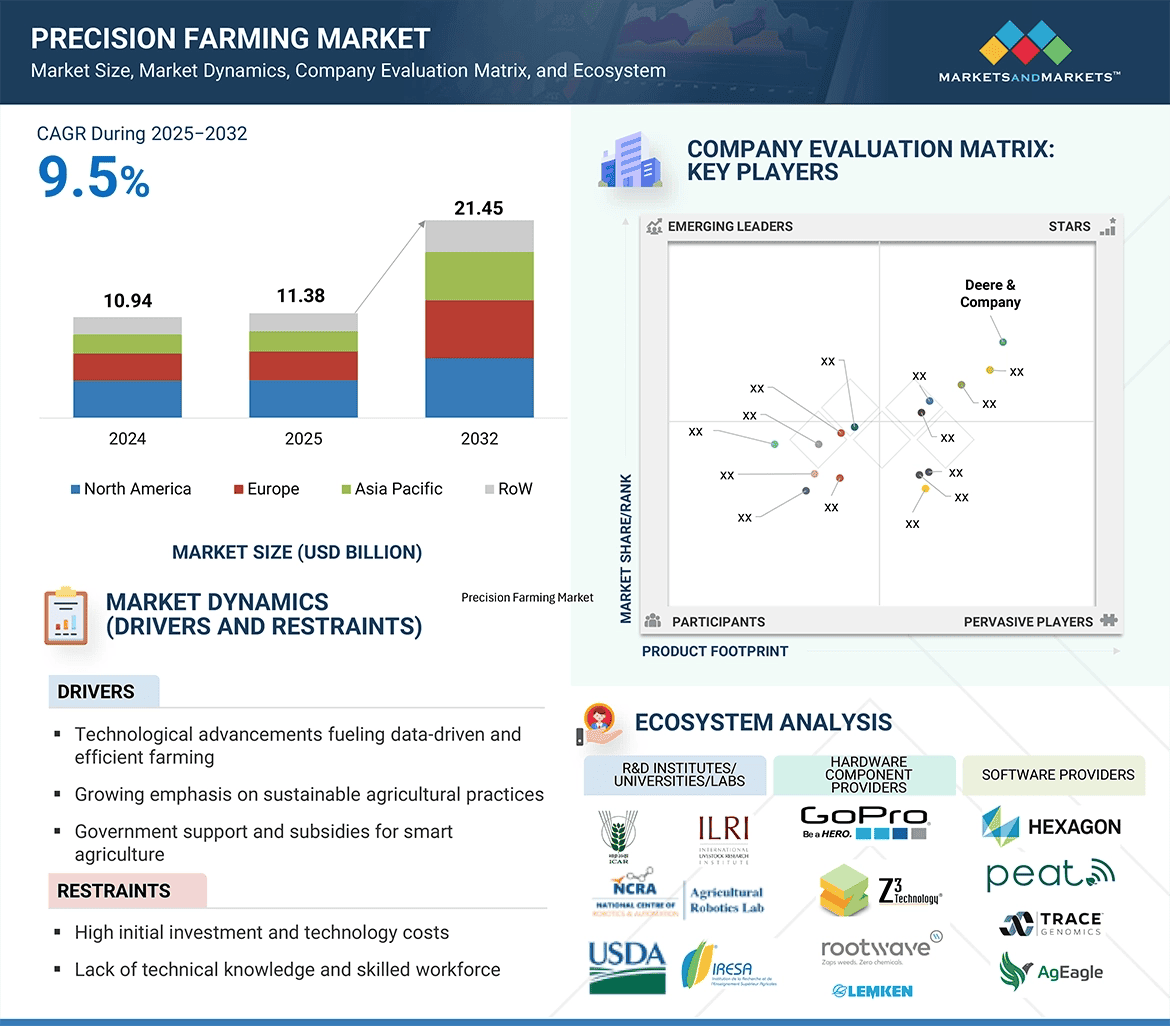 (Source: marketsandmarkets.com)
- Precision irrigation is expected to dominate the application segment, key to addressing water scarcity and sustainability.
- SNS Insider says: hardware dominated in 2023 (55% share), while software saw the fastest CAGR. Among applications, yield monitoring dominates revenue; irrigation management has the highest CAGR next.
| Segment | Role in Market |
| Hardware | 55% revenue share (2023) |
| Software | Fastest growing segment |
| Yield monitoring | Largest revenue-generating application |
| Irrigation mgmt | Fastest-growing application segment |
Conclusion
Looking at all these precision agriculture statistics, it’s clear that farming is no longer only about tradition; it’s about technology and numbers, too. From its early beginnings in the 1980s to a billion-dollar industry today, precision farming has changed the way food is grown. These data show us that farmers who adopt it are seeing better yields, saving money on inputs, and making farming more sustainable at the same time.
North America may lead the market right now, but regions like the Asia Pacific are catching up fast, proving this is not just a local trend, it’s a global shift. With more drones in the sky, sensors in the soil, and satellites tracking fields, the numbers are only going to grow bigger in the years ahead.
So, these precision agriculture statistics make it clear that the future of farming is smart, efficient, and data-driven. I hope you like this article. If you have any questions, kindly let me know in the comments section.
