






Introduction
App Revenue Statistics: Can you think of a world without mobile apps? I can’t, and it’s impossible for you to, from managing our finances and streaming our movies and TV shows to commanding virtual assistance; apps are the foundational layer of modern life.
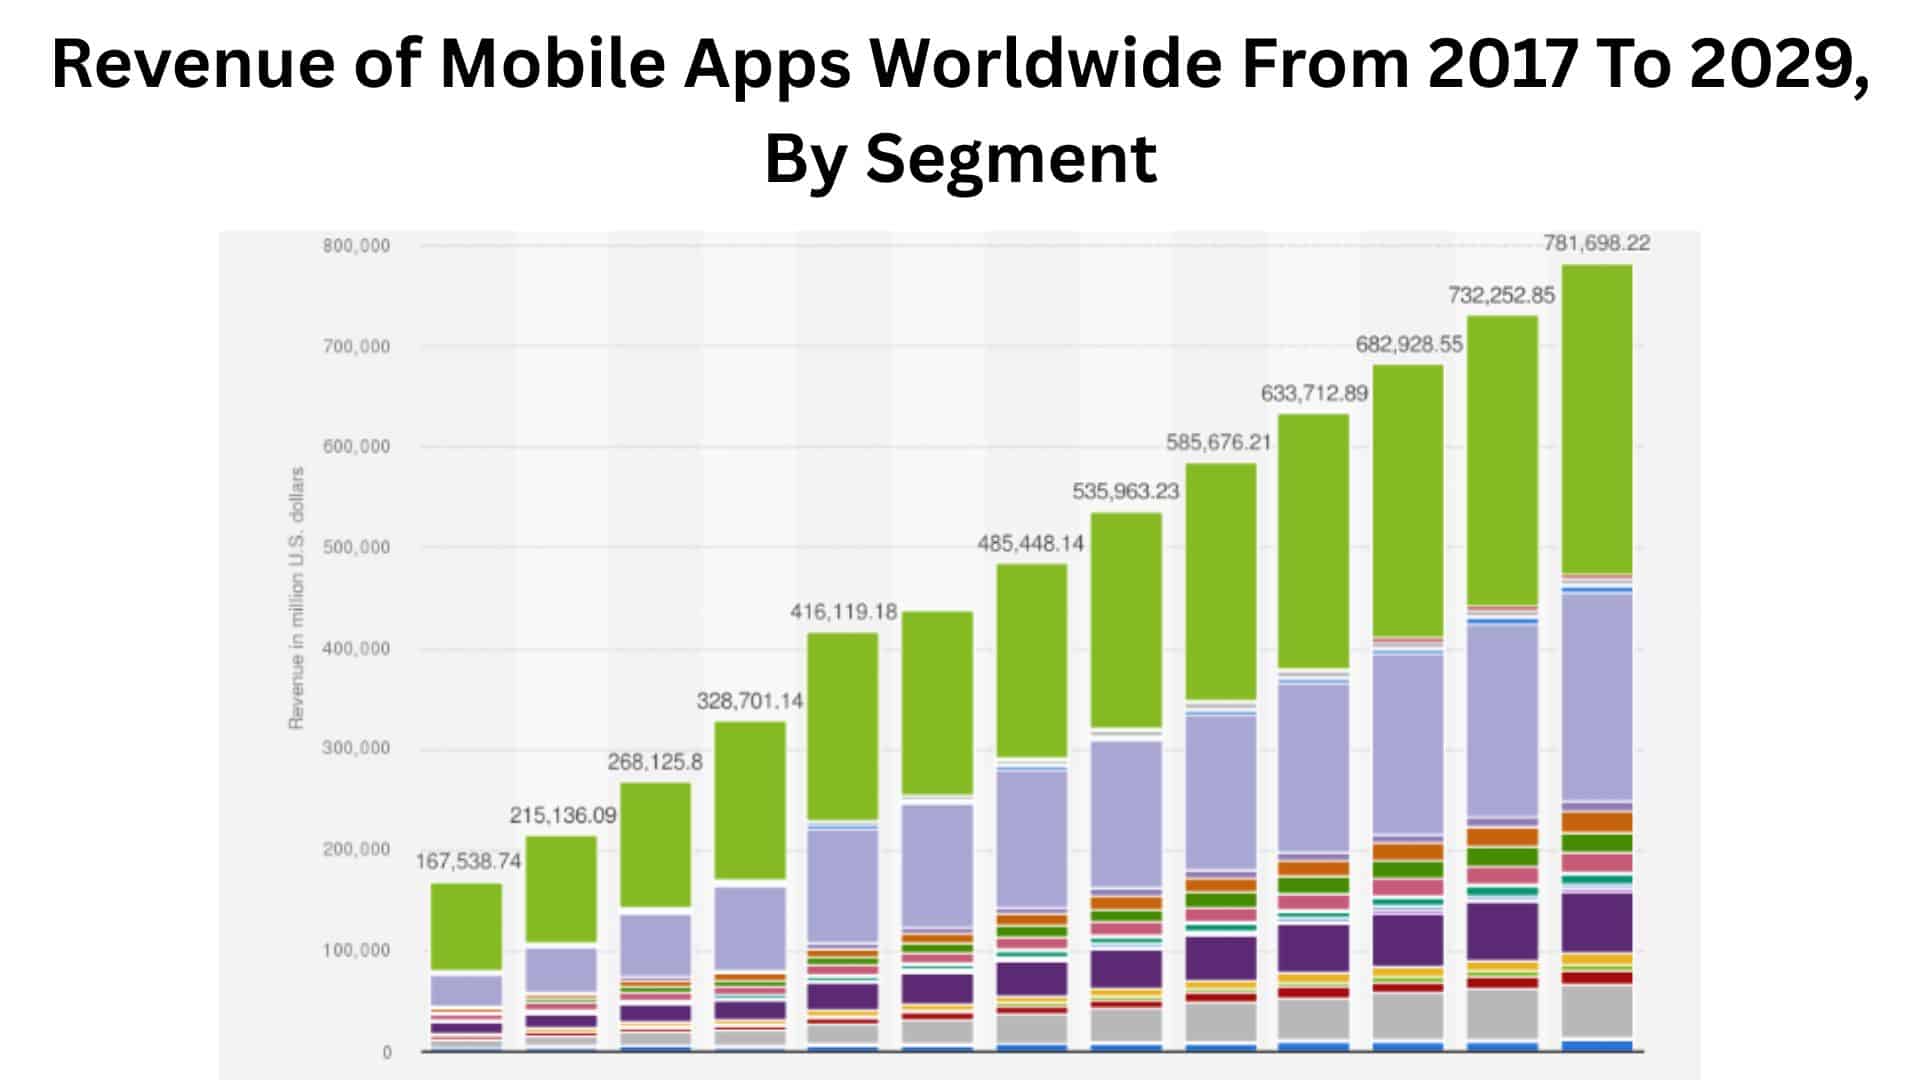
The scale of this mobile universe, and the financial power of app revenue, is the core metric for a multi-billion-dollar economy that continues its aggressive expansion. It’s about a global, complex ecosystem where consumer spending habits are evolving at an immense speed.
In the past decade, the mobile app economy has transformed from a niche market for early users into a global financial phenomenon. Driven by an increase in smartphone penetration that now exceeds 5.12 billion users worldwide, combined with increasingly sophisticated and localized monetization strategies. I would like to explain everything about app revenue statistics; it’s a non-negotiable requirement for any developer, investor, or business operating in the digital space. Let’s get into it.
Best Recommends by the Editor
- Total revenue in the App market is forecast to grow to USD 740 billion by 2026.
- Globally, the Android OS commands an overwhelming market share of between 70.8% and 72% in 2025.
- Mobile Games remain the most financially dominant category, with projected global revenue of USD 196.1 billion in 2024, which represents an astounding 38% of the world’s total App Revenue.
- The global mobile gaming market is valued at USD 81.75 billion in 2025.
- Global consumer spending on IAPs across the major app stores reached a massive milestone of USD 158 billion in 2025, with mobile games being the single largest contributor to this phenomenal total.
- Candy Crush Saga holds a revenue of USD 20 billion.
- The AI app sector is currently undergoing a massive financial transformation, with total revenue soaring to approximately USD 4.5 billion in 2024 and showing YoY growth of over 51% in the first eight months alone.
- Asia-Pacific (APAC) remains the largest single region for App Revenue, contributing over USD 110 billion in 2025, with the region’s total mobile application market size valued at an estimated 95.43 billion in 2024.
- Global App Revenue is conservatively projected to reach a colossal USD 1.10 trillion by 2031, showing no signs of slowing down its consistent double-digit growth trajectory that began over a decade ago.
Global Mobile App Revenue Growth
- Total revenue in the App market is forecast to grow to USD 740 billion by 2026.
- Total revenue is forecast to experience an annual growth rate (CAGR 2026-2031) of 8.17%, leading to the forecast market size of USD 1.10 trillion by 2031.
- Revenue from In-App Purchase (IAP) in the App market is forecast to grow to USD 475.84 billion by 2026.
- Revenue from Paid App in the App market is forecast to grow to USD 6.90 billion by 2026.
- Revenue from Advertising in the App market is forecast to grow to USD 256.87 billion by 2026.
- Number of downloads in the App market is forecast to grow to 528.48 billion by 2026.
- Average Revenue per Download currently is forecast to reach USD 1.40.
- Global Comparison indicates that the highest revenue comes from the United States (USD 317.39 billion in 2026).
App Revenue by Platform
(Source: statista.com)
- Globally, the Android OS commands an overwhelming market share of between 70.8% and 72.% in 2025.
- Despite its smaller user base of around 1.46 billion active users, the App Store for iOS devices captures a disproportionate 67% of the entire global app revenue.
- Consumer spending on the App Store is forecasted to reach a massive USD 142 billion in 2025, compared spending on the App Store is forecasted to reach a massive USD 142 billion in 2025.
- Compared to the $65 billion projected for the Google Play Store, highlighting a 2.18x revenue multiple for iOS.
- The average in-app transaction value on an iPhone is substantially higher at approximately USD 1.07, which is more than double the USD 0.43 average transaction value observed for the typical Android user.
- In the crucial North American market, iOS dominates both usage and spending, holding a market share of around 58.03% in 2025, which translates directly into higher regional app revenue for its developers.
- The compound Annual Growth Rate (CAGR) for consumer spending on the App Store is projected to be around 21% through 2025, outpacing Google Play’s forecasted CAGR of 17% over the same period.
- Even in the US, the average annual spending for an Android user is approximately USD 37,040, while the average income for an iPhone user is significantly higher at around USD 53,251, directly correlating with the platform’s superior monetization.
- The App Store’s superior performance is particularly evident in non-game categories, with revenue for apps like streaming services and productivity tools growing 4.7 times faster than mobile games between 2016 and 2020.
| Platform | Global Market Share (2025) | Consumer Spending (2025 Forecast – $ Billion) |
| iOS (App Store) | 28% | USD 142 Billion |
| Android (Google Play) | 72% | USD 65 Billion |
| Revenue Multiple (iOS/Android) | – | 2.18x |
App Revenue by Category
(Reference: statista.com)
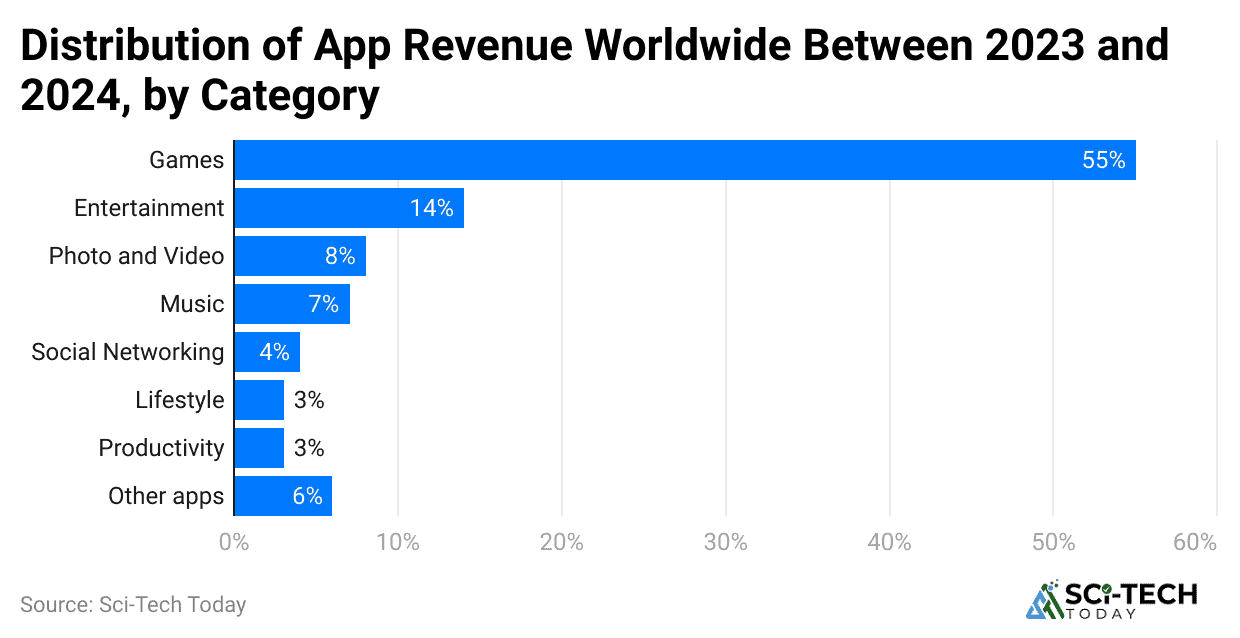
- Mobile Games remain the most financially dominant category, with projected global revenue of $196.1 billion in 2024, which represents an astounding 38% of the world’s total App Revenue.
- Social Networking Apps, including social media giants and messaging platforms, are the second largest revenue generator, contributing a massive $153.4 billion in 2024, mostly through a blend of in-app advertising and virtual gifts.
- Entertainment Apps, predominantly subscription-driven video and music streaming services, are a rapidly growing segment, bringing in approximately $39.2 billion in 2024 and showcasing a solid YoY growth rate exceeding 10%.
- Shopping/M-Commerce Apps are an economic giant, driving around $33.4 billion in 2024 directly from digital goods and sales, an area where the App Store ecosystem alone facilitated over $618 billion in general retail sales.
- Health & Fitness Apps are maturing rapidly, with the high-end performers in this category exhibiting a trial-to-paid conversion rate of up to 68.3%, which is one of the highest across all non-game categories.
- Travel Apps are demonstrating a powerful post-pandemic recovery, with their revenue growth rate spiking by over 16.1% YoY in 2024, signifying a renewed consumer confidence in booking and travel-related services via mobile.
- The top-grossing non-game app, TikTok, alone generated $2.33 billion in 2024, showcasing the immense potential for user-generated content and premium features within the social category.
- Even the niche News & Magazine Apps are experiencing substantial financial acceleration, reporting a YoY revenue growth rate of over 16.6% in 2024, fueled by a greater willingness to pay for quality content.
| App Category | Global Revenue (2024/2025 Estimate in $ Billion) | Share of Total App Revenue |
| Gaming | 196.1 | 38% |
| Social Networking | 153.4 | 30% |
| Entertainment | 39.2 | 7% |
| Shopping/M-Commerce | 33.4 | 6% |
| Health & Fitness | High ARPU, Smaller Slice | High Conversion |
| Travel | Rapid Growth Segment | 16.1% YoY Growth |
Gaming App Revenue Statistics
- The global mobile gaming market is valued at USD 81.75 billion in 2025.
- The percentage of mobile gaming declined to 49% in 2024 due to the recovery of the PC/console market and bounced back to 55% in 2025. The market shares of console and PC are 24% and 21%, respectively, in the global gaming market.
- The time spent on gaming per week by a mobile gamer is 3 hours and 40 minutes.
- The total number of mobile gamers is expected to increase up to 2.848 billion in 2024.
- Despite the decline, PUBG Mobile stays in the top 5 and generates USD 1.18 billion in 2024, still one of the top-earning games globally.
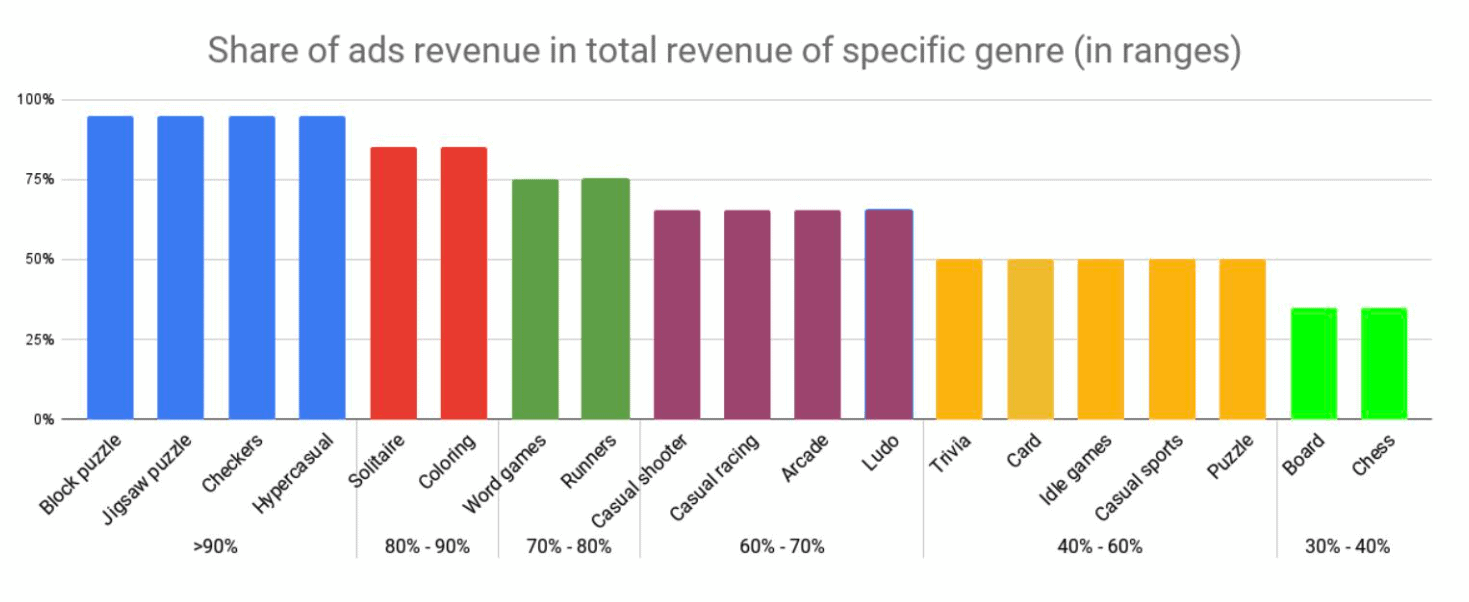
- The freemium games, which can be downloaded for free but have in-app purchases, are the most popular monetization model in gaming apps.
- The gaming apps earned 48.2% from in-app purchases.
- The ARPDAU of gaming apps is estimated to be around USD 0.32
Monetization Models- The IAP vs. Subscription
(Source: tenjin.com)
- In-App Purchases (IAP), which include single transactions for virtual goods, content, or permanent unlocks, still command the largest slice of the revenue pie, representing approximately 48.2% to 50% of total App Revenue.
- Global consumer spending on IAPs across the major app stores reached a massive milestone of USD 139.38 billion in 2025, with mobile games being the single largest contributor to this phenomenal total.
- Subscription-based models are accelerating their growth dramatically, with revenue from subscription-based apps reaching $139.38 billion in 2024, showcasing a maturity that extends far beyond streaming and fitness.
- The trend of Freemium apps is overwhelmingly dominant, as nearly 98% of mobile app revenue worldwide comes from free-to-download applications, emphasizing the effectiveness of both IAP and subscription upsells.
- Over 35% of apps are now adopting a hybrid monetization strategy, mixing subscriptions with consumables or lifetime purchases, particularly in categories like Gaming (61.7%) and Social & Lifestyle (39.4%).
- The median trial-to-paid conversion rate is highest for Travel apps at 48.7%, closely followed by Media & Entertainment at 43.8%, suggesting that high-value, time-sensitive utility drives immediate user commitment.
- Yearly subscriptions are the clear preference for high-retention categories, dominating Health & Fitness (67%) and Travel (65%), as developers prioritize longer customer commitment and higher Lifetime Value (LTV).
- The In-App Advertising market is a massive revenue stream outside of consumer spending, projected to reach a colossal USD 390.04 billion in 2025, growing at an 8.17% CAGR through 2029.
| Monetization Model | Total Global Spend (2024/2025) | Primary App Category |
| In-App Purchases (IAP) | USD 150 Billion (Consumer Spend) | Gaming, Social, Shopping |
| Subscriptions | USD 139.38 Billion (2024 Revenue) | Entertainment, Fitness, Productivity |
| In-App Advertising | USD 390.04 Billion (2025 Projected Market) | Social Media, Utility, Games |
| Hybrid Model Adoption | N/A | Gaming, Social & Lifestyle |
Highest Grossing Apps of All Time
- Candy Crush Saga holds a revenue of USD 20 billion.
- PUBG Mobile holds a revenue of USD 17 billion.
- Clash of Clans has generated a revenue of USD 13 billion.
- Pokémon GO has earned USD 7.9 billion in revenue.
- Gardenscapes and Coin Master have both generated a revenue of USD 6 billion.
- Fate/Grand Order has earned USD 4 billion in revenue.
- Clash Royale has achieved a revenue of USD 2.3 billion.
- Honor of Kings has generated a revenue of USD 1.9 billion.
- Lineage M also holds a revenue of USD 1.3 billion.
Grossing Apps and Games in the United States
- Candy Crush Saga brought in a revenue of USD 606 million, ranking first on the list of top-earning apps.
- Google One made USD 510 million in revenue, taking up the second place on the list.
- The HBO Max app had a revenue of USD 478 million, ranking it third on the list of top-earning apps.
- TikTok app had revenues amounting to USD 468 million, giving it the fourth place for revenues from the app.
- YouTube made USD 431 million in revenue, ranking it among the top-earning apps.
- Roblox made USD 424 million in revenue, ranking it among the top-earning apps.
- Disney+ app made USD 360 million in revenue, ranking it among the top-earning apps.
- Coin Master made USD 341 million in revenue, ranking it among the top-earning apps.
- Tinder had revenues amounting to USD 296 million, ranking it among the top-earning apps.
The AI App Revenue Market
(Reference: businessofapps.com)
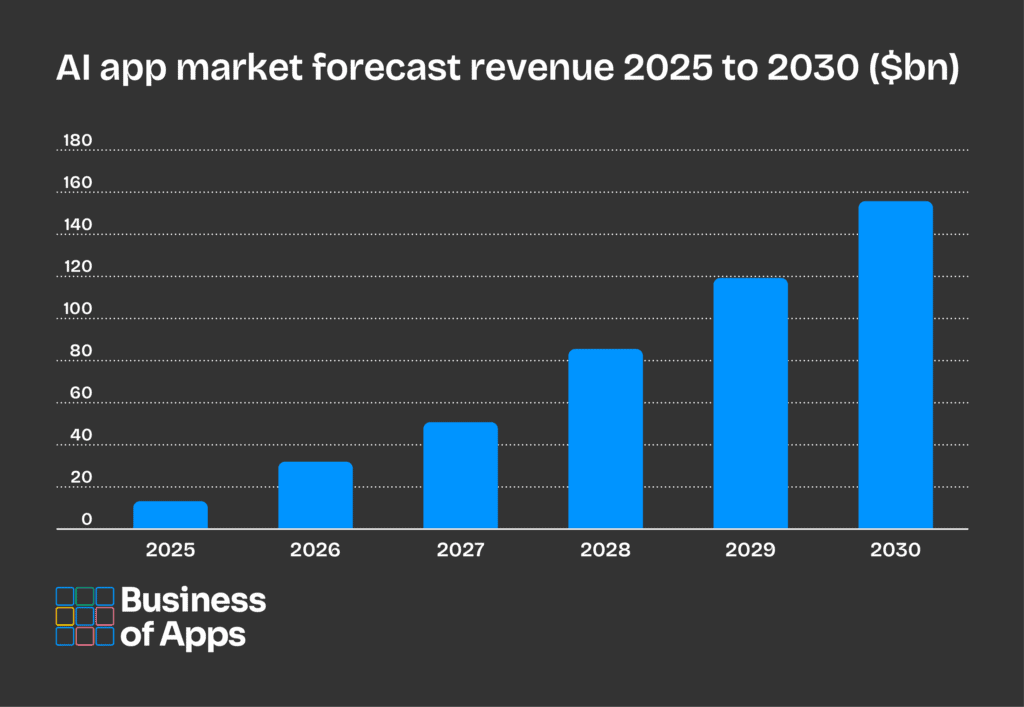
- The AI app sector is currently undergoing a massive financial transformation, with total revenue soaring to approximately USD 4.5 billion in 2024 and showing YoY growth of over 51% in the first eight months alone.
- This niche is forecasted to experience monumental growth, with AI app revenue projected to reach an estimated USD 18.8 billion by 2028, a near tenfold increase from the $1.8 billion recorded just a few years earlier.
- ChatGPT, the generative AI pioneer, has become the single most dominant force, with its in-app purchase revenue generating well over USD 2 billion in the first eight months of 2024, leading the charge in paid productivity.
- AI-powered apps are demonstrating exceptional monetization potential, with a median revenue per install (RPI) above USD 0.63 after 60 days, a figure that matches only high-earning Health and Fitness apps and is double the overall app market median.
- North America is the undisputed leader in monetizing AI apps, accounting for a massive 47% of the total global AI app revenue, despite regions like India leading in pure download volume.
- The demographic spending on AI is skewed towards specific user profiles, with over 70% of the paying users for major Chatbot products like ChatGPT and Microsoft Copilot being male users aged 25 to 34 who have high productivity needs.
- Utility and Photo & Video categories have been fundamentally enhanced by AI, with apps like Remini demonstrating strong monetization with over USD 200 million in in-app purchase revenue generated from its massive 450 million download base in 2024.
- The overall AI in Mobile Apps Market is projected for robust, sustained growth, estimated to reach an astounding USD 249.8 billion by 2033, expanding at a high Compound Annual Growth Rate (CAGR) of 33.7%.
| AI App Metric | Data Point (2024/2025) |
| AI App Sector Revenue | USD 4.5 Billion (2024) |
| Revenue Leader | ChatGPT (Over USD 2 Billion in 8 months, 2024) |
| Monetization Efficiency (RPI) | 0.63 Median RPI (60 days) |
| Regional Revenue Share | North America (47% of Revenue) |
Key Regional App Revenue Breakdown
(Reference: ripenapps.com)
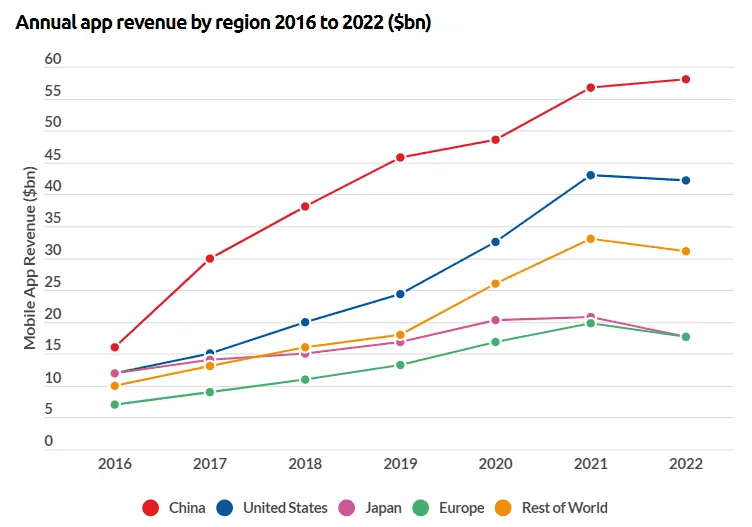
- Asia-Pacific (APAC) remains the largest single region for App Revenue, contributing over USD 110 billion in 2025, with the region’s total mobile application market size valued at an estimated 95.43 billion in 2024.
- China is the financial engine of APAC, driving a massive 60% of the region’s total earnings, primarily fueled by high-grossing mobile gaming titles like Honor of Kings, which alone brought in 1.8 billion in revenue in 2024.
- North America follows as the second-largest market, generating approximately USD 90 billion in 2025 in consumer spending, where the United States is the absolute stronghold due to a high average transaction value.
- Europe is a solid third revenue pillar, contributing an estimated USD 70 billion in 2025, with significant spending concentrated in major economies like Germany and France, driven heavily by entertainment subscriptions.
- India is the most explosive emerging market, experiencing a rapid 40% increase in App Revenue YoY in 2025, driven by the mass adoption of mobile internet and affordable Android devices.
- Japan remains a unique and highly lucrative market within APAC, generating over $40 billion in 2025, largely concentrated in a user base that shows an exceptional willingness to spend on premium mobile gaming content.
- Latin America is gaining financial maturity, with its App Revenue seeing a substantial rise of over 25% in 2025, contributing approximately 20 billion, with Brazil and Mexico leading the regional consumer spending.
- The Middle East and Africa collectively represent the fastest-growing geographical market for App Revenue, recording a colossal revenue growth rate of 45% in 2025, although starting from a smaller base, signaling future potential.
| Region | Total App Revenue (2025 Estimate – USD Billion) |
| Asia-Pacific (APAC) | USD 110+ Billion |
| North America | USD 90 Billion |
| Europe | USD 70 Billion |
| India | Rapidly Expanding |
| Middle East & Africa | Smaller Base |
Future Forecasts and Disruptive Trends in App Revenue
(Source: appinventiv.com)
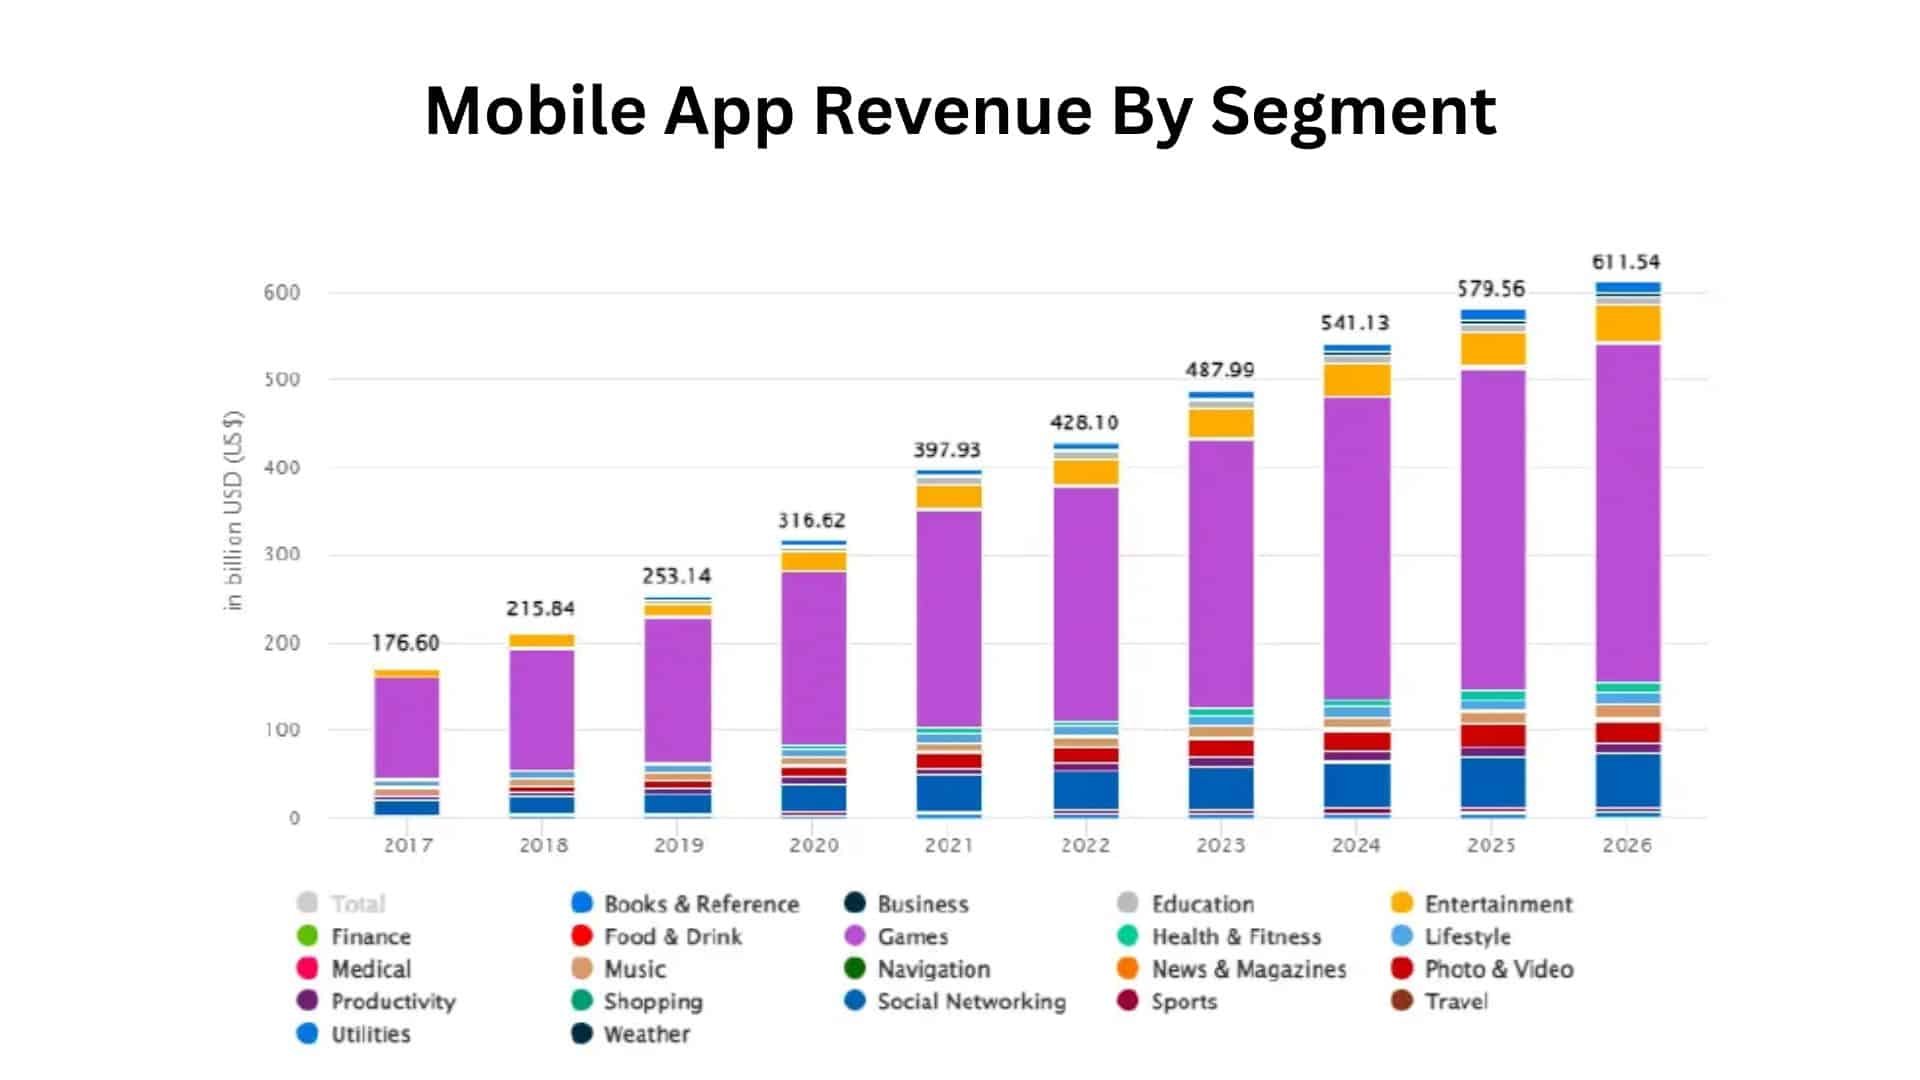
- Global App Revenue is conservatively projected to reach a colossal USD 1.10 trillion by 2031, showing no signs of slowing down its consistent double-digit growth trajectory that began over a decade ago.
- The dominant trend of In-App Purchases (IAP) will continue its reign, expected to account for a massive 65% of the total App Revenue by 2025, driven by the continuous development of premium features and virtual goods across all app categories.
- The emerging technologies of the Metaverse and Augmented Reality (AR) apps are anticipated to generate an additional USD 50 billion in App Revenue by 2027, specifically concentrated in gaming and social platforms that offer immersive digital experiences.
- Wearable Technology Apps, which are intrinsically linked to devices like smartwatches and health trackers, are set to create a new revenue stream, with estimates projecting they will generate USD 10 billion by 2025.
- The integration of 5G technology will be a crucial, indirect driver of App Revenue, particularly in North America and Asia, by enabling seamless, ultra-low-latency experiences crucial for high-fidelity mobile gaming and AR content.
- Super-apps, such as the dominant platforms in Asia that combine payments, messaging, and e-commerce into a single application, are expected to drastically diversify and multiply their revenue streams through enhanced user retention and cross-platform monetization.
- The increasing normalization of Ad-Free Premium Experiences means that users are consistently willing to pay a premium to bypass advertisements, creating a solid and predictable revenue base for streaming, utility, and content apps.
- Cloud gaming revenues are set for a sharp spike, projected to jump from USD 2.4 billion in 2024 to over USD 8.2 billion in 2025, a massive 3.4x increase driven by advancements in 5G infrastructure and edge computing capabilities.
Brief Summary
Overall, these app revenue statistics are a narrative of scale and growth. We are seeing the maturation of a digital economy, one that has moved far beyond simple paid downloads to embrace complex, high-retention models like subscriptions and in-app purchases. From the 2.18x revenue multiple held by the App Store to the explosive 45% growth in emerging markets, the data confirms that mobile apps are the most valuable form of digital commerce today.
The future of this 600 billion industry is one built on data-driven strategies. Success will depend on navigating the clear preference for high-value AI utility, the ever-dominant financial gaming, and the crucial platform-specific spending behaviors of users. For developers, businesses, and investors, the future is clear: the path to wealth lies in these statistics and in leveraging the powerful, ongoing change towards premium, indispensable mobile experiences. Overall, the benchmark has been set, and the financial potential of the mobile app ecosystem is still only scratching the surface. I hope you like this article. Thanks for staying up till the end.
FAQ
App earnings vary drastically: most independent apps make less than USD 50 monthly, while top-tier apps rake in millions. On average, apps make USD 0.60 to USD 1.20 per download, but successful mid-tier apps earn USD 5,000 to USD 50,000 per month by utilizing smart monetization strategies.
An app with 1,000 downloads typically makes anywhere from USD 5 to USD 200 in ad revenue, or USD 50 to USD 1,000 via in-app purchases and subscriptions. Earnings are determined by active usage and conversion rates rather than download numbers alone.
Yes, ChatGPT can build an app for you, but it acts as an intelligent coding assistant rather than an autonomous developer. It writes all the code, designs the layout, and fixes errors, but you will still need to handle setup, testing, and deployment.