Introduction
Ozone Layer Statistics: The ozone layer, a fragile protective shield of gas high in the Earth’s stratosphere, has a pretty incredible job. It’s essentially our planet’s sunscreen, absorbing the sun’s most damaging ultraviolet (UV) radiation. Without this layer, life as we know it would be a very different story, with severe risks to human health, ecosystems, and agriculture.
For decades, we were unknowingly making holes in this critical shield with man-made chemicals. This article is all about the ozone layer statistics. I want to cover the data and the projections of the ozone layer’s journey from problem to recovery. I also cover everything about how we collectively put the brakes on this environmental problem, and some measures to heal. Let’s get into the content without any ado.
Editor’s Choice
- A UN-backed scientific panel reported in early 2024 that the ozone layer is on track to fully recover by the middle of this century, with specific targets for different regions.
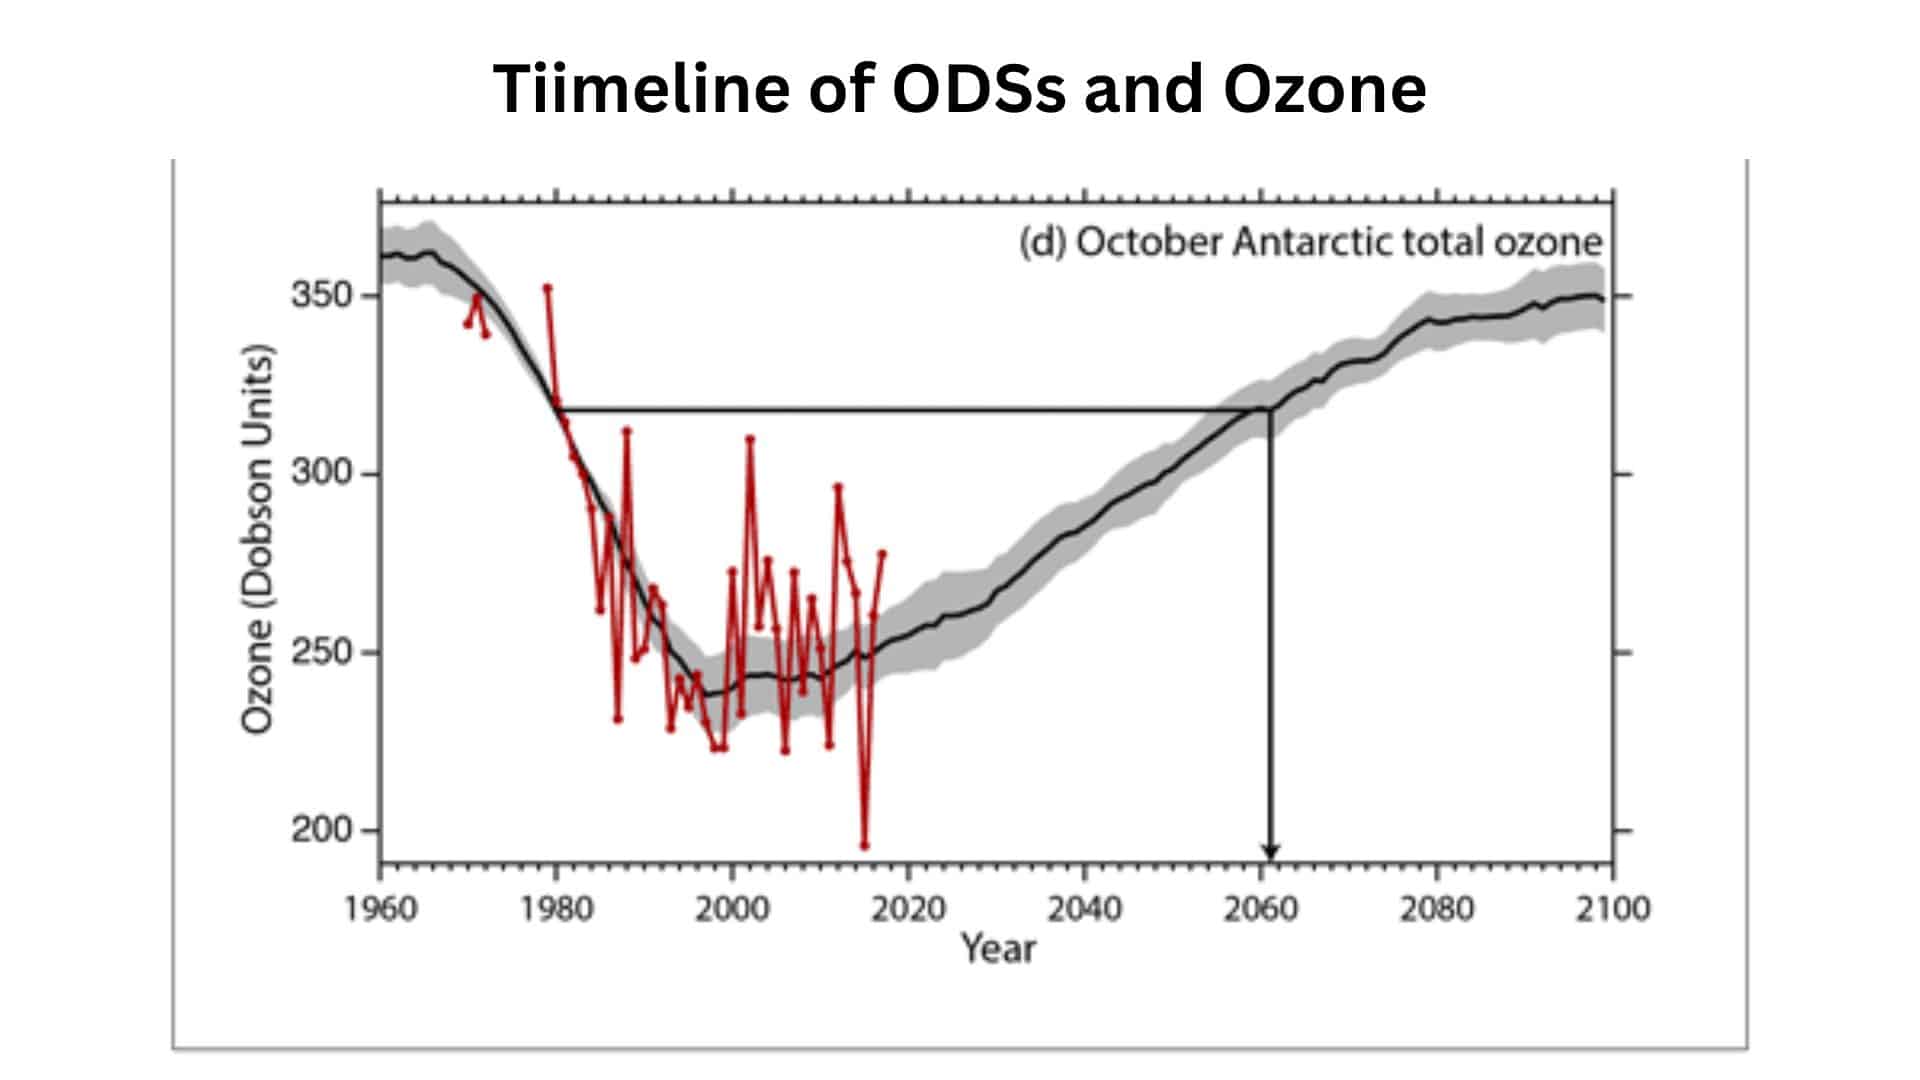
- The Antarctic ozone hole, which is the most well-known part of this issue, is projected to recover to 1980 levels by around 2066.
- Since the Montreal Protocol was signed in 1987, the global consumption of ozone-depleting substances has fallen by a staggering 99%.
- The 2024 Antarctic ozone hole was among the smallest on record since the recovery began, reaching a maximum one-day extent of 4 million square kilometers on September 28, 2024.
- This positive trend has a direct impact on public health. The U.S. Environmental Protection Agency (EPA) estimates that the Montreal Protocol will prevent more than 280 million cases of skin cancer, over 5 million skin cancer deaths, and more than 45 million cases of cataracts in the United States alone by 2100.
- The total combined abundance of ozone-depleting compounds in the lower atmosphere, known as Equivalent Effective Stratospheric Chlorine or EESC, peaked in 1994 and has been steadily declining ever since.
| Ozone Layer Recovery Projection | Projected to recover to 1980 levels by 2066 (Antarctic), 2045 (Arctic), and 2040 (mid-latitudes). |
| Reduction in ODS Consumption |
Over 99% reduction globally since 1987. |
|
The Ozone Hole’s size in 2024 |
It reached a peak of 22.4 million sq km, one of the smaller holes since recovery began. |
| Public Health Impact |
Forecast to prevent over 280 million cases of skin cancer and 45 million cases of cataracts in the U.S. alone by 2100. |
|
Peak Chlorine Levels |
The effective abundance of stratospheric chlorine peaked around 1994 and is now on the decline. |
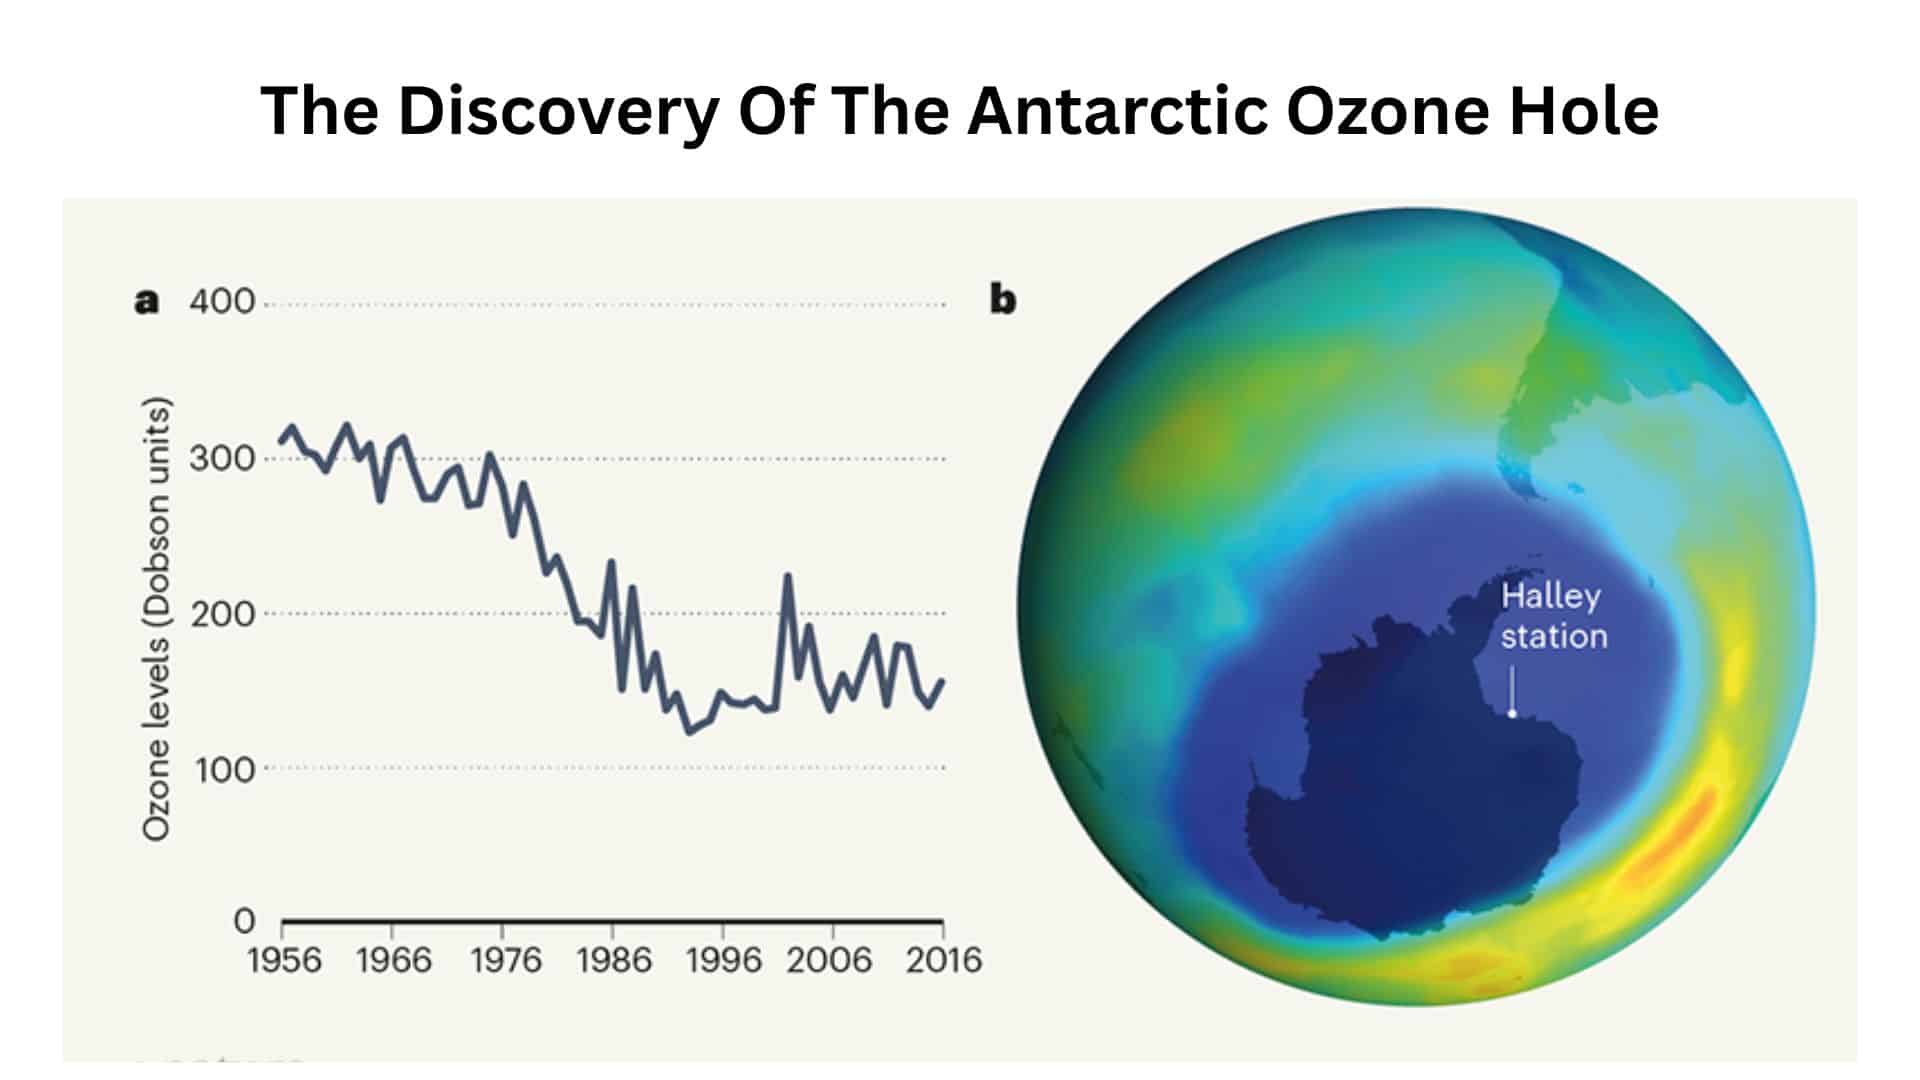
The Discovery and Early Depletion of the Ozone Layer
 (Source: nature.com)
- In 1974, scientists Mario Molina and Sherwood Rowland published a groundbreaking paper showing how CFCs could be destroying the ozone layer.
- The real shocker came in 1985 when a team of British scientists, led by Joe Farman, published data showing a severe and sudden drop in ozone concentrations over Antarctica.
- Satellite data from NASA quickly confirmed these findings. The numbers were terrifying. By the mid-1980s, the ozone layer over Antarctica was roughly 50% thinner than it had been in the 1970s.
- The data showed that while the thinning was most dramatic at the poles, there was also a measurable decline in the ozone layer globally. By the late 1970s, ozone levels had already dropped by an average of about 4% worldwide.
| Initial Scientific Discovery | A 1974 paper showed a link between CFCs and ozone layer breakdown. |
| The Ozone Hole Discovery | Confirmed in 1985 by a British Antarctic Survey team. |
| Initial Ozone Loss | By the mid-1980s, the Antarctic ozone layer was about 50% thinner. |
| Global Ozone Decline | A worldwide average decline of 4% was recorded by the late 1970s. |
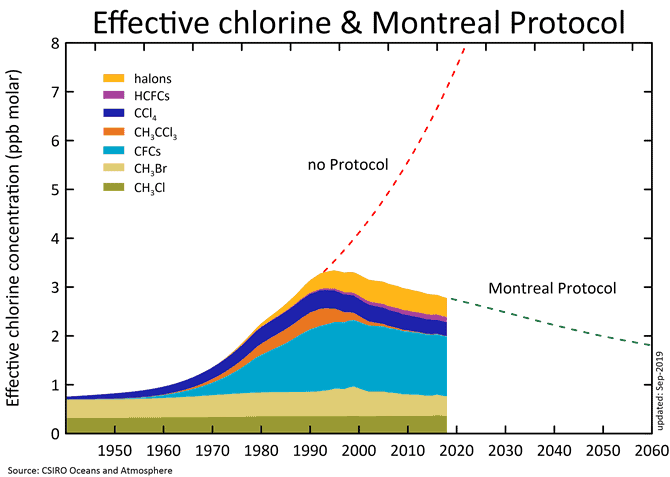
The Montreal Protocol and Its Impact
 (Source: dcceew.gov.au)
- The treaty has been ratified by 198 parties, which is every single country in the world. It’s the first universally ratified treaty in TN history. Talk about a united front.
- The phase-out schedule was strict and effective. From a peak of over 1.1 million metric tons of CFCs produced in 1986, the consumption plummeted to nearly zero in developed countries by the mid-1990s.
- By the end of 2010, more than 99% of the historic consumption of ozone-depleting substances had been eliminated globally.
- The scientific community has been monitoring the results closely. The total combined abundance of chlorine and bromine from ODS in the stratosphere, the stuff that eats the ozone, peaked around 1994 and has since been decreasing.
| Ratification | The Montreal Protocol has been ratified by all 198 UN member states. |
| ODS Reduction | Over 99% of the historic production and consumption of ozone-depleting substances has been phased out. |
| Peak Emissions | The abundance of ozone-depleting chemicals peaked in the mid-1990s. |
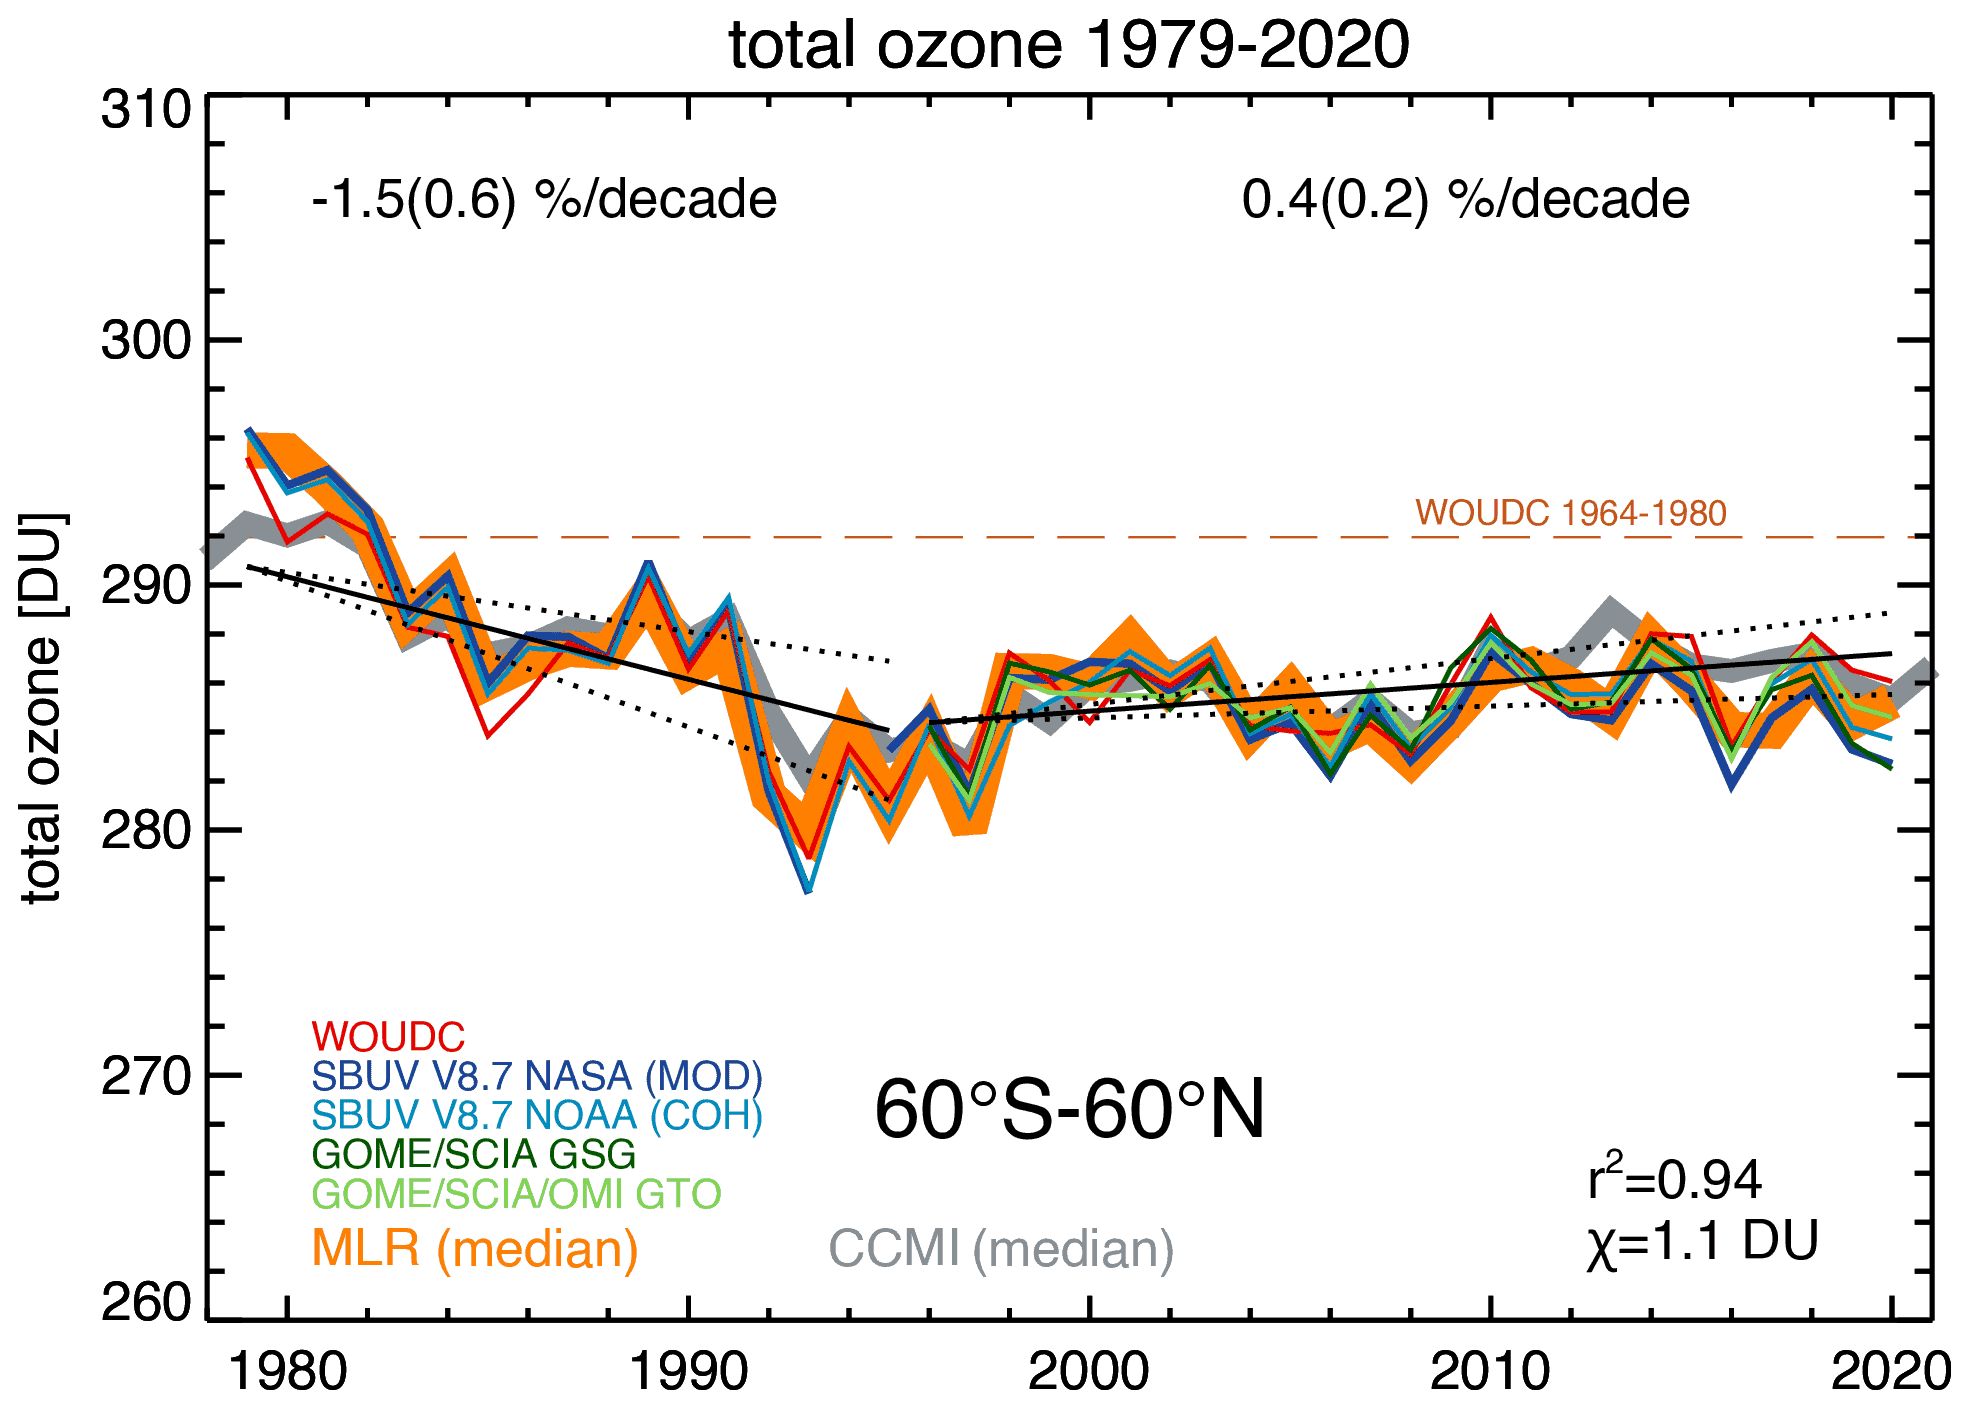
Healing of the Ozone Layer
 (Source: copernicus.org)
- The Antarctic ozone hole’s size varies each year based on weather, but the overall trend is clear. The average area of the hole has decreased significantly from its peak.
- For instance, the record-breaking holes of the late 1990s and early 2000s, which often exceeded 25 million square kilometers, have become much rarer.
- The 2024 ozone hole reached a maximum extent of 22.4 million square kilometers, while that still sounds big, it’s considerably smaller than the 2006 peak of 29.6 million square kilometers.
- Minimum ozone levels have also improved by the lowest single-day value over Antarctica, which was 92 Dobson units in 2006, and has not been seen since.
- The lowest value in 2024 was around 109 Dobson units, a Dobson unit is a measure of the total amount of ozone in a column over a given area.
- Scientists project that the ozone layer will not return to pre-1980 levels overnight. It’s a long road, but the roadmap is clear.
- The Antarctic ozone layer is expected to fully recover by about 2066. The Arctic and mid-latitudes are projected to heal even sooner, by around 2045 and 2040, respectively.
| Ozone Hole Size Trend | The average area of the Antarctic ozone hole has been trending smaller since the early 2000s. |
| Minimum Ozone Levels | The lowest single-day ozone value in 2024 was 109 Dobson units, up from the record low of 92 Dobson units in 2006. |
| Recovery Timeline (Antarctic) | Projected full recovery by 2006. |
| Recovery Timeline (Mid-Latitudes) | Projected full recovery by 2040. |
Ongoing Challenges and Future Predictions
 (Source: copernicus.org)
- A key challenge has been the rise of new chemicals. While CFCs are out, some of their replacements, like hydrofluorocarbons (HFCs), don’t harm the ozone layer, but they are powerful greenhouse gases.
- The Kigali Amendment to the Montreal Protocol was created to address this, aiming to phase down HFCs by 80% over the next 30
- Natural phenomena can still impact the ozone layer, for example, the massive volcanic eruption of Hunga Tonga-Hunga Ha’apai in 2022 injected millions of tons of water vapor into the stratosphere.
- Scientists believe this contributed to the slightly larger ozone hole in 2023, showing us how fragile the recovery can be.
- The success of the Montreal Protocol is a blueprint for tackling other global issues, most notably climate change. The statistical data from the last few decades prove that international cooperation, guided by sound science and hard numbers, can lead to real, measurable change.
- We have a lot of work to do on climate change, but the ozone layer is a testament to the fact that it is possible.
| New Chemicals (HFCs) | Phase down by 80% to 85% over the next 30 years. |
| Volcanic Eruptions | Hunga Tonga-Hunga Ha’apai eruption in January 2022. |
| Illegal Production | Spike in emissions of CFC-11 |
| Stratospheric Cooling | Climate change is causing the stratosphere to cool. |
| Global Monitoring | Illegal production of CFC-11 |
Conclusion
Overall, these ozone layer statistics give us a clear picture of how a human-made problem could have spiraled into an irreversible catastrophe. But it’s also a story of human ingenuity and cooperation. These numbers don’t lie. They show us a decades-long decline that has now been reversed.
We have stopped the damage for now, but we are watching the planet heal. While the ozone layer won’t be back to normal for a few more decades, the data gives us confidence that it will happen. And that, in a world of constant environmental problems, is a pretty great statistic to have. Thanks for reading. I hope you like this one. If you found it useful, kindly share it with those environmental enthusiasts.
