





Brief Overview
iPhone vs Android User Statistics: Smartphones are now probably most closely associated with a person, which makes them important in the life of a person. Most competition is between the two types of smartphones known as the iPhone and Android. Both of these contraptions have a loyal clientele. The different mobile platforms include their features, demographics, and market shares, which show quite interesting trends.
The following paper presents iPhone and Android user statistics from around 2025. It includes market preferences, as well as worldwide trends and, most interestingly, spending behaviours.
The Editor’s Best Picks
- According to iPhone and Android user statistics, Android had about 72.15% of the market, while iOS had a 27.37% market share in Q4 2024; updated for Q4 2025, Android held roughly 71.94% and iOS 27.64% globally.
- By June 2025, roughly 82% of all active iPhones were on iOS 18, as compared with newer Android version adoption being far more fragmented (Android 15 held just 26.17% share, the largest single version).
- The smartphone industry has propelled itself from 139 million units sold in 2008 to a staggering 1.26 billion units shipped in 2025 (or 1.64 billion including feature phones per some estimates). These goliaths include Apple, Samsung, and Xiaomi, with Apple leading full-year 2025 shipments at 247.8 million units and a 19.7% share.
- Android comes out as the most used among older people, with 60% of Generation X and 57% of Generation Z owning an Android.
- iPhone and Android user statistics reveal that 70% of the devices shipped worldwide in the second quarter of 2012 were Android, by contrast, compared to 46.9% the previous year.
- A high percentage of Android users (66%) are not spending on apps, unlike iOS users, who are more willing to pay for apps.
- iPhone and Android user statistics state that, in terms of usage by age group, 58% of those aged 18-34 use iPhones, while 41% use Androids.
- However, there is almost no difference in the case of the 35-54 age group, as the ratio is 47% iPhone users against 53% Android users. People aged 55 years and above are 51% Android users.
- iPhone consumers tend to have high income levels, averaging USD 53,251 compared to Android users, who make USD 37,040.
- Worldwide, the income of iPhone users is 7.4 times higher than that of Android users.
- iPhone consumers spend an average of 4 hours and 54 minutes of their time on the phone compared to Android users, who spend 3 hours and 42 minutes per day on the phone.
- iPhone and Android user statistics show that Android keeps 89-91% of its user base in retained loyalty rates, while iPhone retains 85-88%. Of all iPhone users, 18% moved from Android, while 11% of Android users switched to iPhones.
- With a global market share of 71.47%, Android devices are more susceptible to threats from malware, as attacks are higher than normal on this operating system.
- In contrast, the same software for all Apple devices, coupled with the strict screening for apps, provides a much safer environment for iPhone users.
Mobile Operating System Market Share
(Reference: statista.com)
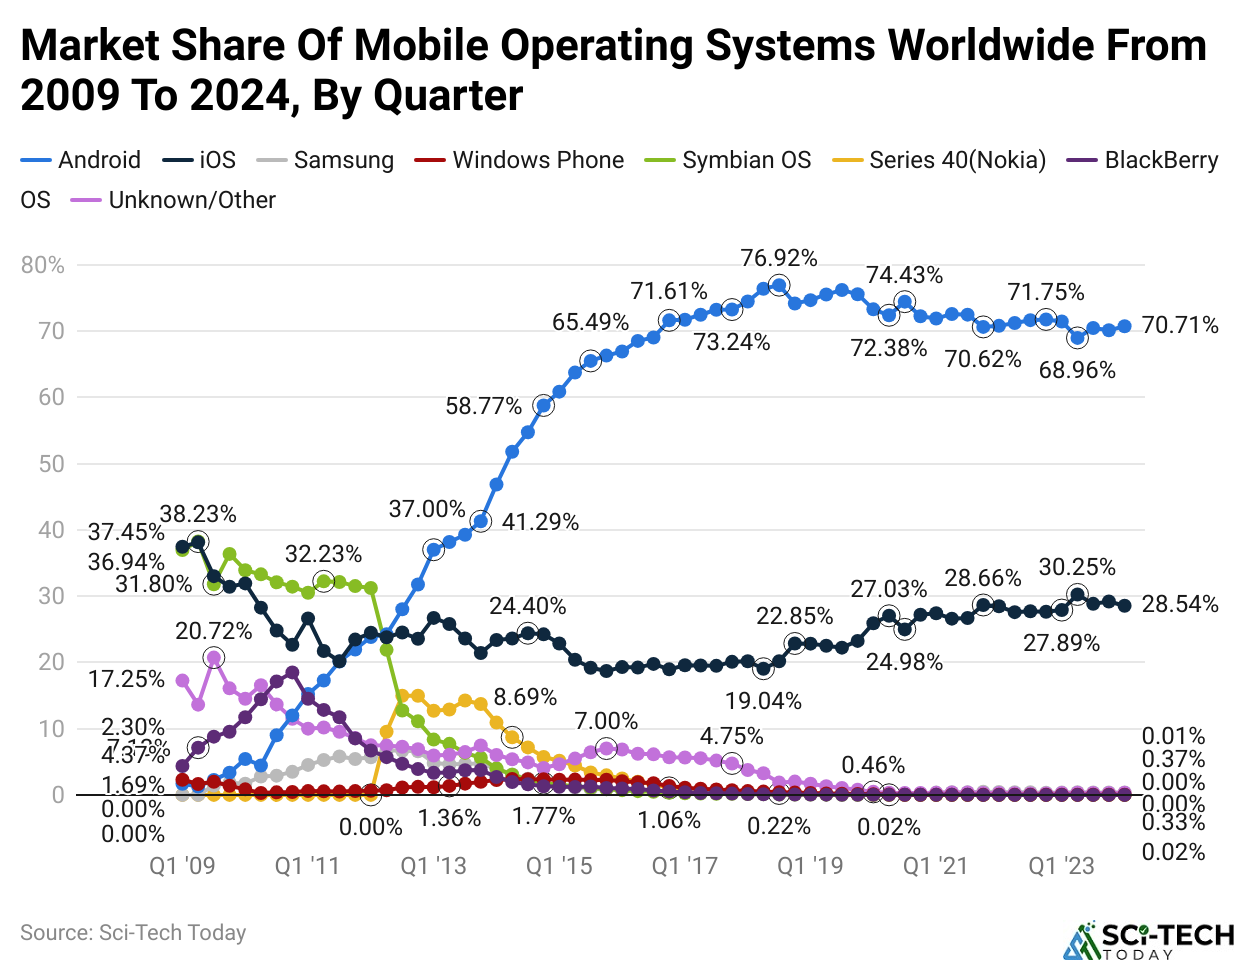
- In the fourth quarter of 2025, Android remained the world’s top mobile operating system, boasting a market share of approximately 72%.
- Apple’s iOS, however, claimed around 28% of the market during the same period, with Apple actually leading in unit shipments that quarter (25% share) even as Android retained OS dominance.
- Both Android and iOS were introduced in 2007 and have been regularly updated to add new features as they have evolved. iOS 26 is the latest release of iOS, which came out in September 2025, and Android’s latest version, Android 16, was also available in 2025.
- One of the critical differences between the two systems relates to hardware compatibility. iOS is unique to Apple devices, while Android powers devices from multiple manufacturers, including Samsung, Google, and OnePlus.
- In addition, Apple has managed to better keep its users current with the latest software; by June 2025, around 82% of active iPhone users were already on iOS 18, as opposed to Android version adoption remaining far more fragmented, with Android 15 holding just 26.17% as its largest single-version share.
- Touchscreen smartphones have been the wave of the future in the mobile world since 2010, when demand started to rapidly decline for basic feature phones.
- iPhone and Android user statistics show that the number of smartphones sold has grown from 139 million units in 2008 to 1.26 billion in 2025 (global shipments grew about 2% year-on-year for the full year).
- Transformations such as this have seen major brands such as Apple, Samsung, and Xiaomi emerge as market leaders, while the likes of BlackBerry and Nokia are struggling to realign their business models to take advantage of this smartphone revolution.
iPhone Vs Android Users by Generation
(Reference: statista.com)
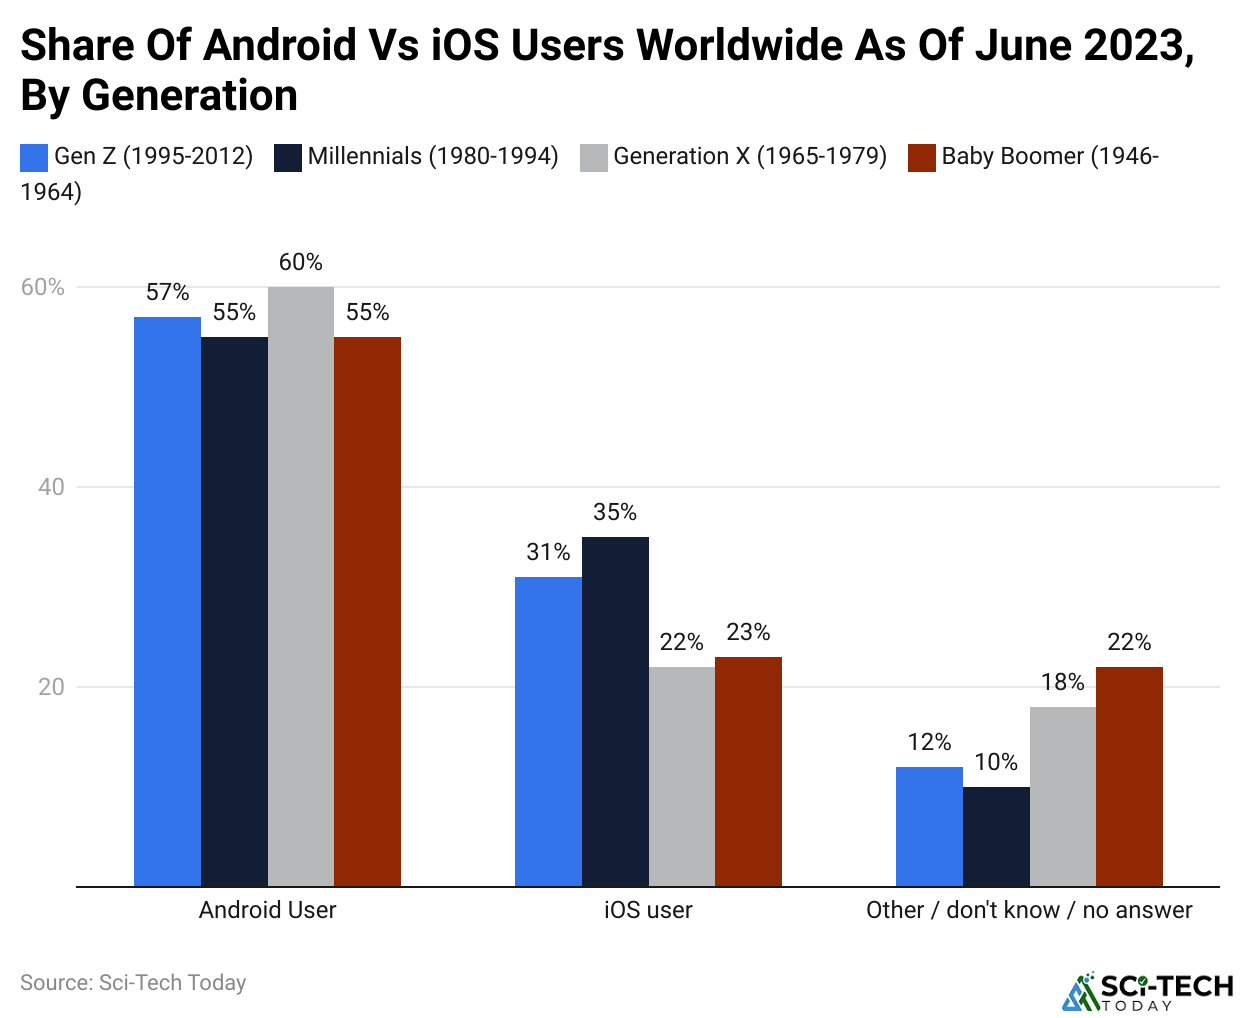
- As per iPhone and Android user statistics, Android is the dominant operating system among smartphone users in the world at present, with over half of users across various generations opting for it.
- Among respondents worldwide, 60% of Generation X users owned Android devices; 57% of Gen Z users reported the same.
- On the other hand, the operating system on iPhones appeals more to younger generations.
- Among these generations, 35% of Millennials and 31% of Gen Z users had an iPhone in 2025.
iPhone Vs Android Users Spend on Apps
(Reference: statista.com)
- Recently, Android has emerged as the best shot, taking an edge over iOS in the race for supremacy in smartphone platforms.
- According to iPhone and Android user statistics released by IDC, Android devices accounted for almost 70% of shipments worldwide in Q2 2012, up from only 46.9% at the same time last year.
- Counting more than 3.9 billion Android users worldwide, developers have a substantial rationale to prioritize Android for reach; however, iOS remains better monetized.
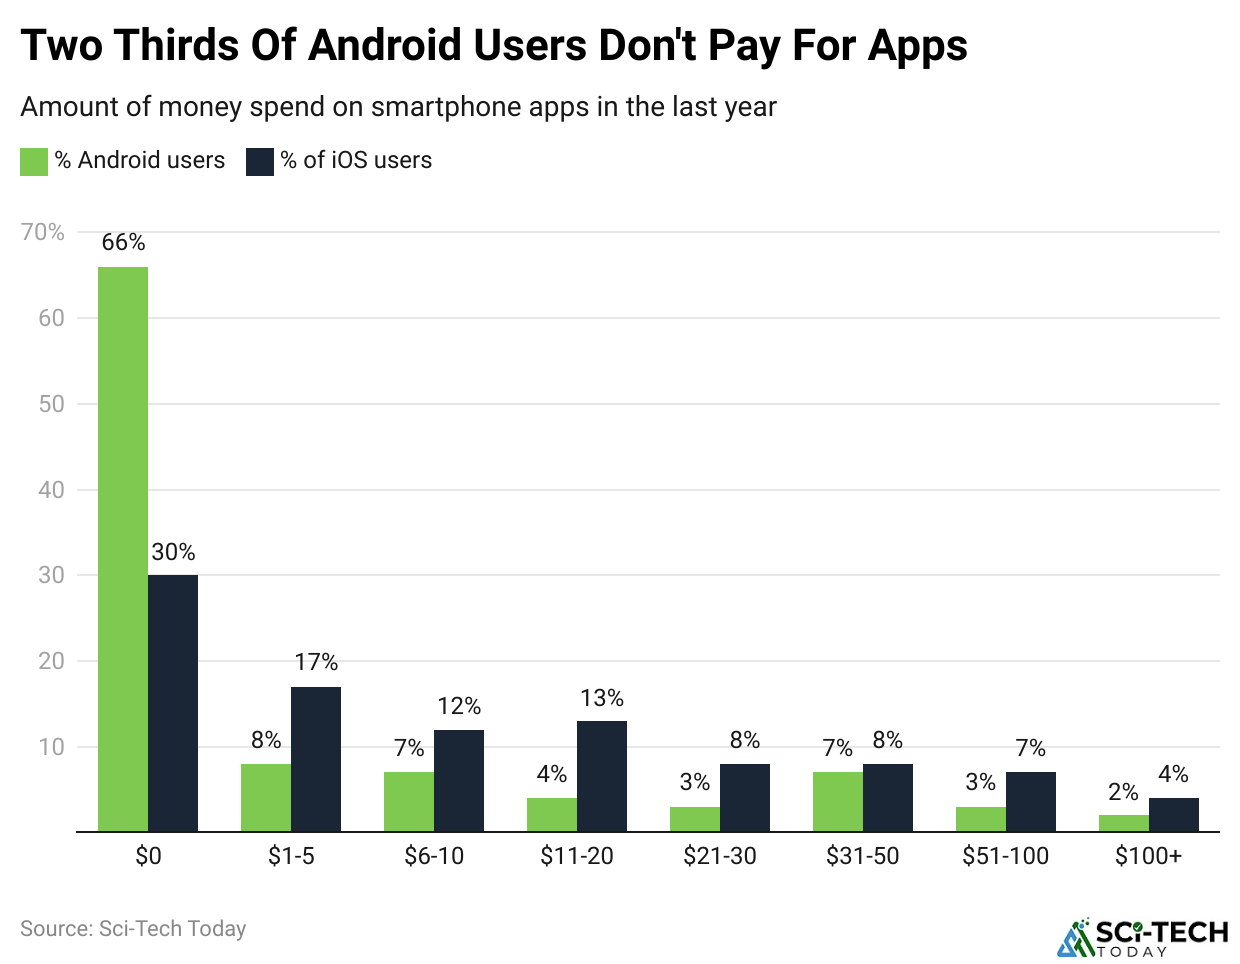
- The spending gap remains pronounced: Apple App Store consumer spending was forecast to reach USD 142 billion in 2025, compared with USD 65 billion on Google Play. That equals 68.6% of global mobile-app consumer spending for iOS versus 31.4% for Android.
- It so happened that 66% of surveyed Android users had not spent any money on apps in the past year.
iPhone Vs Android Users by Owner’s Age
(Reference: statista.com)
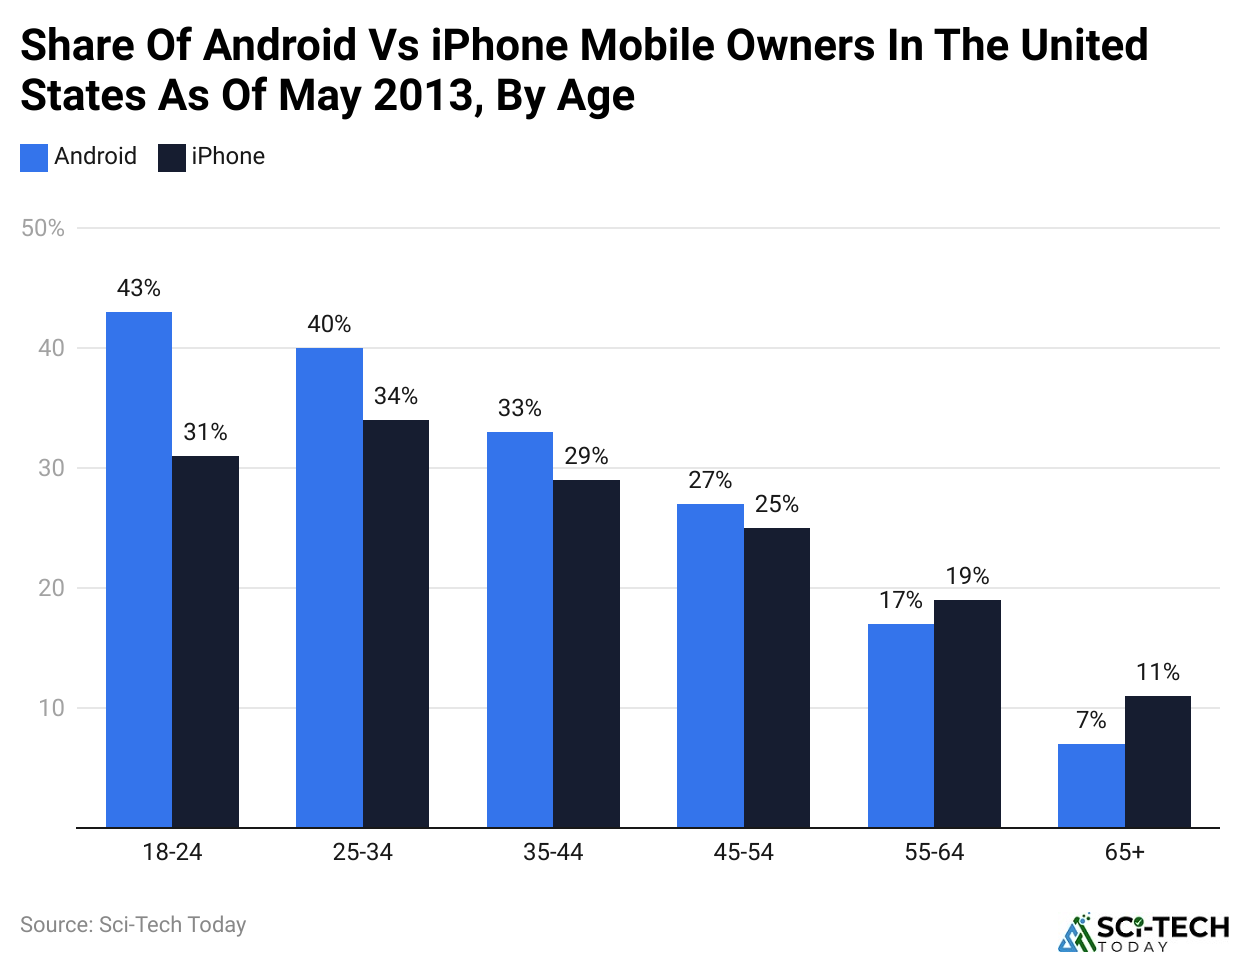
- Among mobile users in the United States in 2025, Android versus iPhone ownership varies by age. Among adults aged 55 and older, 51% used Android and 49% used an iPhone.
- For younger U.S. mobile users, the pattern has reversed since 2013: iPhone ownership is more prevalent. Among those aged 18-34, 58% used iPhones, compared with 41% using Android; among people aged 35–54, iPhone ownership was 47% and Android ownership was 53%.
iPhone Vs Android Users by Income Level
(Reference: designveloper.com)
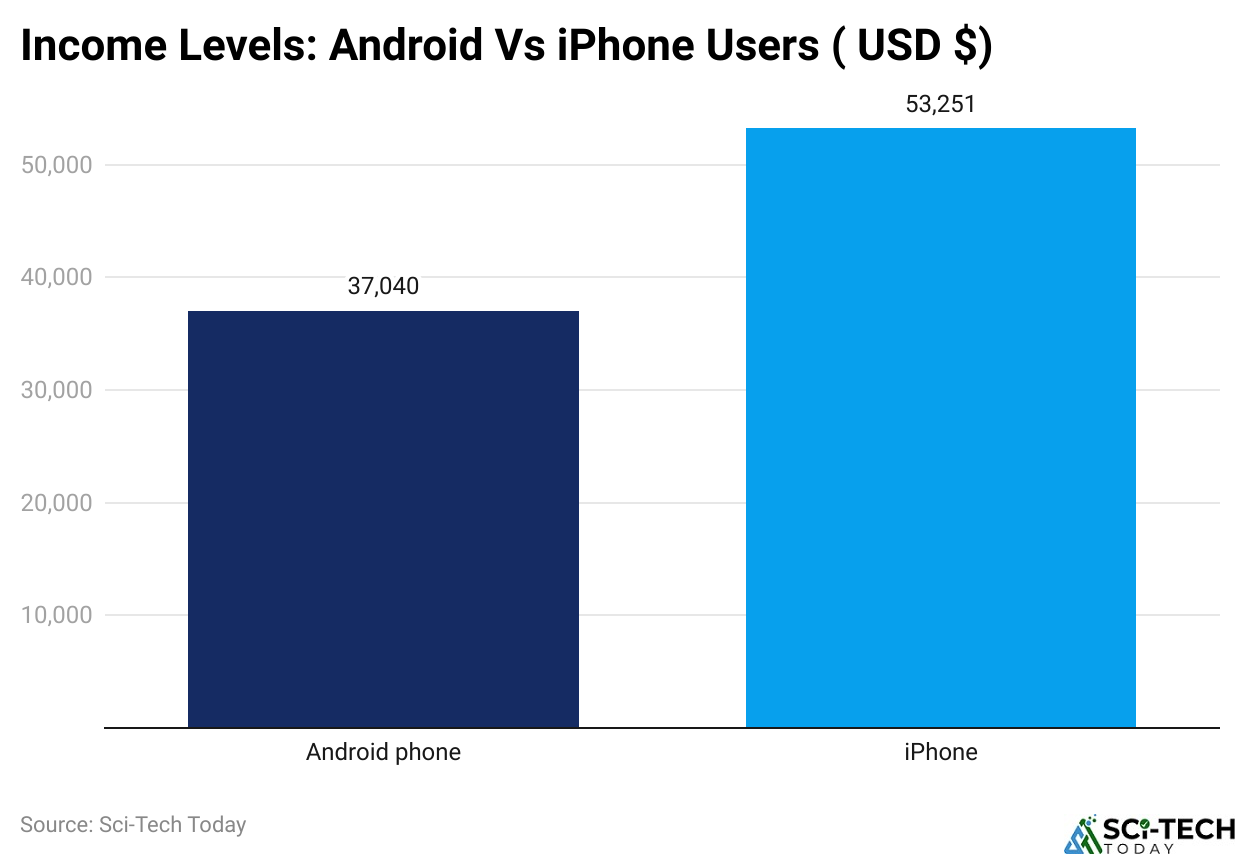
- iPhone users earn more than the average Android user.
- The average iPhone owner’s annual salary is USD 53,251 when compared to a lower USD 37,040 for an average Android user.
- In fact, an iPhone user usually spends around USD 101 a month on tech-related products, which is almost double what an Android user typically spends. This is still a trend today.
- According to iPhone and Android user statistics, iPhone users generate 7.4 times more than Android users. At a global level, the average monthly revenue from iPhone users is USD 10.4, compared to only USD 1.4 from Android users.
- This only goes to show that Android phones are indeed more affordable for poorer people because these are the ones who are most likely to purchase them.
- With the background of Apple as a premium brand, high-priced iPhones are identified with quality and prestige.
- It has become a status symbol for many and is fascinating to people with higher incomes because they regard it as a reflection of lifestyle and status.
iPhone Vs Android Users by Age
- iPhone and Android user statistics display the respective popularity of iPhones and Androids among various age groups.
- Among the age brackets from 18 to 34, 58% are using iPhones, while 41% are using Androids. The same ratio is almost evenly split among those within the ages of 35 to 54, whereby 47% use iPhones, whereas another 53% use Android devices.
- Among those aged 55 and above, Android is slightly more popular, with 51% using Android as opposed to 49% using iPhones.
- iPhone users averaged almost 4 hours and 54 minutes a day talking and sending 58 messages or text messages and taking 12 selfies on average, as compared to the Android users who used their phones for an average of 3 hours and 42 minutes, sent 26 messages, and took seven selfies in the same period.
- It shows that variations in confidence or even assurance about security were very different across these groups.
- A 2025 report also stated that around 20% of iPhone users were “extremely confident” that a user’s data was secured in Apple iCloud Keychain, while only 13% of Android users claimed the same ability with Google Password Manager.
- When it comes to adopting security habits, Android users are more likely to make use of a native password manager (72% vs. 62%). In contrast, iPhone users are more particular about the app location tracking (77% vs. 68%).
- Across a 2025 multinational consumer survey, 69% of users reported having at least one passkey, indicating significant uptake of passwordless authentication, but this figure is not broken down by iPhone versus Android users.
iPhone Vs Android Users’ Loyalty
- Understanding customer loyalty is paramount to studying iPhone users’ and Android users’ performance as two major smartphone operating systems.
- Customers are very loyal to these devices, and there is a pretty strong retention for both operating systems. Android has a retention rate of 89-91%, and iPhone users have a rate of 85-88%. This indicates that most consumers have a tendency to remain faithful to their selected brand over a period.
- And though these loyalty figures are great, there are a few users who switch to other mobile operating systems.
- iPhone and Android user statistics reveal that about 18% of iPhone users have been Android users previously, whereas only 11% of Android users have moved from Apple. Consumers are switching mostly due to user experience and cost.
- 47% of ex-Android users believed the iPhone to be a “superior experience”, and only 30% of ex-iPhone consumers viewed Android similarly; meanwhile, 29% of ex-iPhone users switched to Android for the price, and 11% of switchers from Android pointed to the price of the iPhone.
iPhone Vs Android User Entertainment Preference
Android
(Reference: techopedia.com)
iPhone
(Reference: techopedia.com)
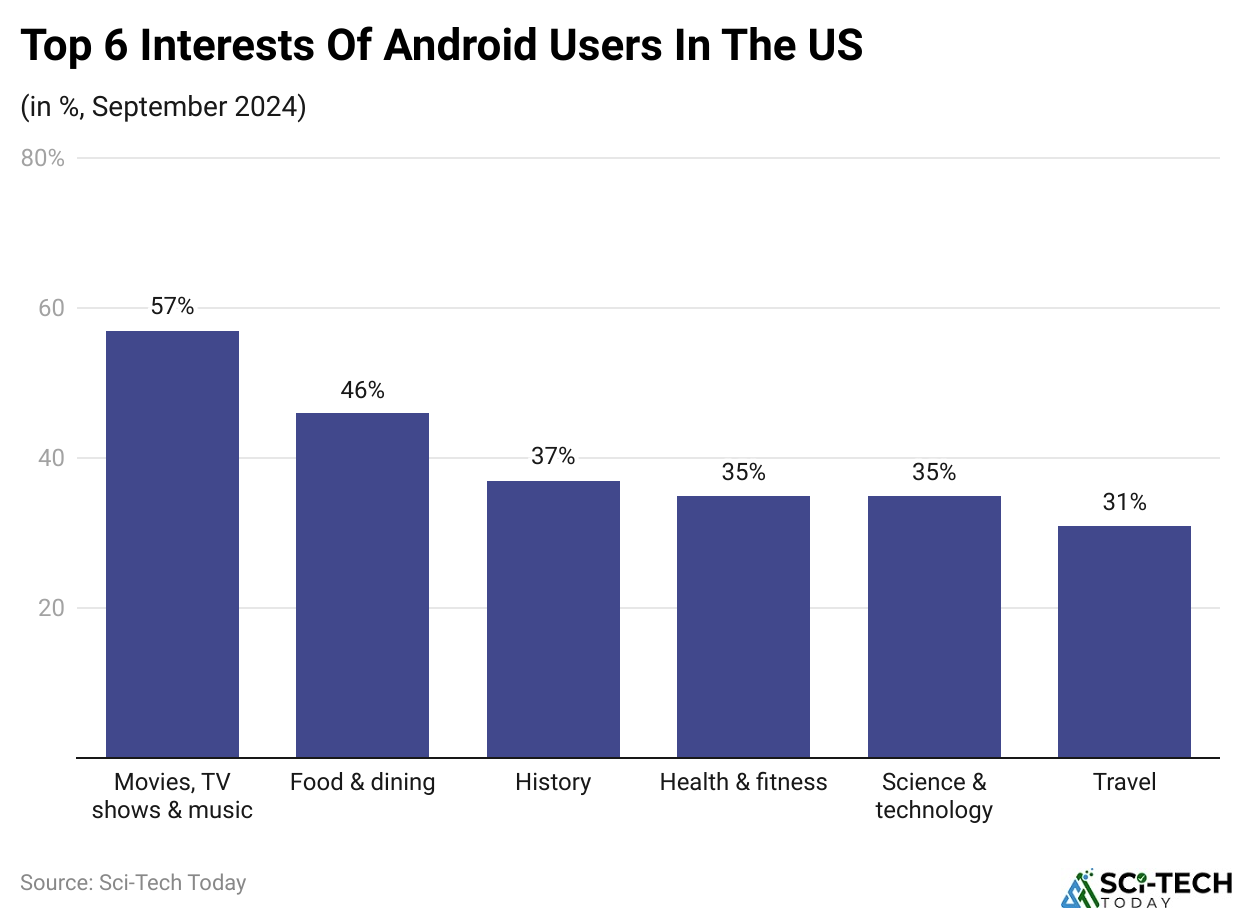
- From the statistics of iPhone and Android users, 57% of the latter loved to watch movies, TV shows, and listen to music.
- Although food and dining (46%), history (37%), and health and fitness (35%) were just slightly below them, science and technology also made up 35% of Android users’ interests.
- The trend was that of enjoying both forms of entertainment and educational materials. However, this category stayed in the closet and never made the top 10 list of interests for Android users.
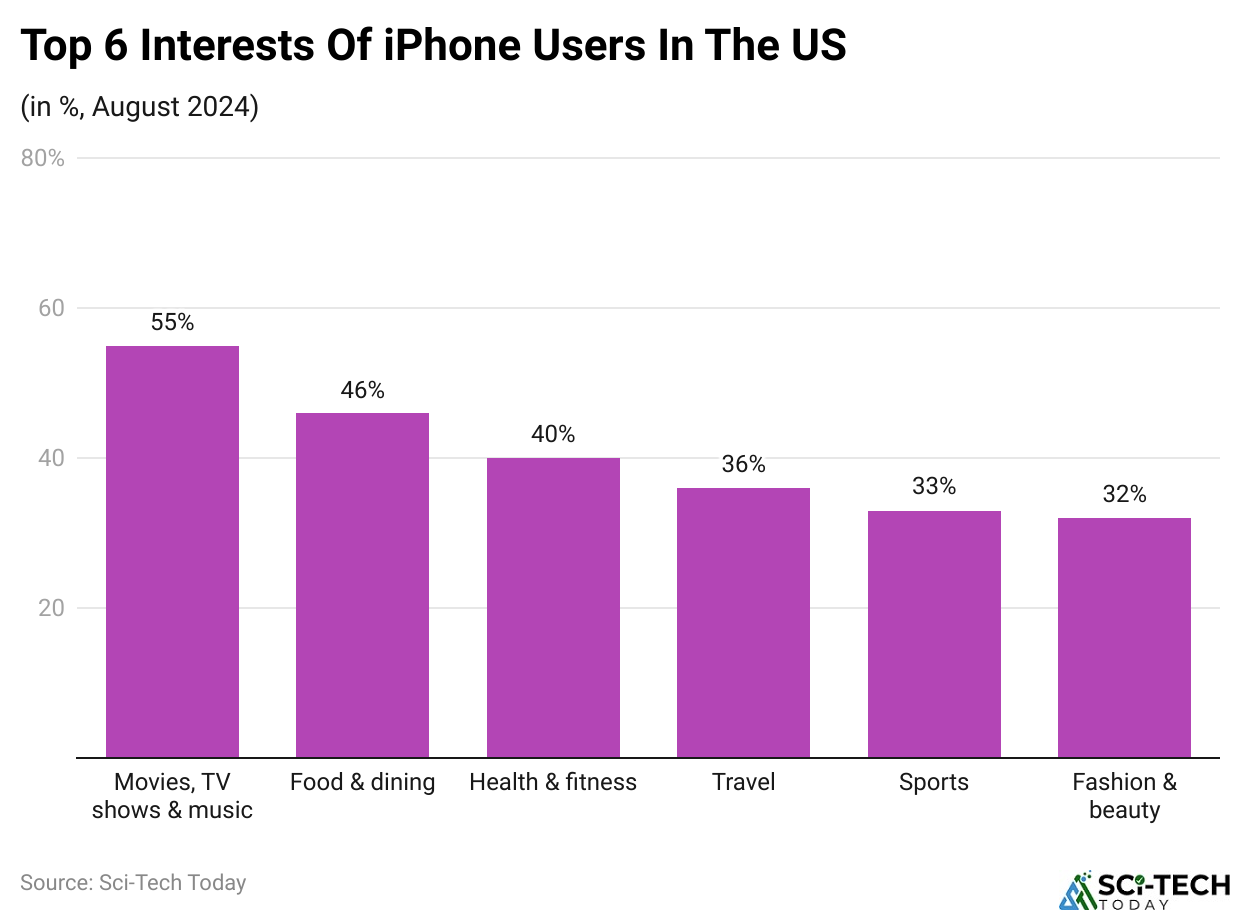
- As much as iPhone users were good at watching movies, TV series, and listening to music (averaging 55% of what they love), the distinguishing factor was that they were excellent in fashion and beauty, having 32% as their highest interest.
- Both categories had the same percentage in food and dining (46%) and health and fitness (40%).
- They were tied in science and technology at 29%.
iPhone Vs. Android by User Switch
| Factors | Users switching from Android to iOS | Users switching from iOS to Android |
| Faster Software updates | 4% | 1% |
| Better customer service | 3% | 5% |
| Better Prices | 11% | 29% |
| Better features | 25% | 24% |
| Better user experience | 47% | 30% |
| more apps | 4% | 6% |
| Other | 6% | 5% |
(Source: coolest-gadgets.com)
- iPhone and Android user statistics explain the reasons why users switch between Android and iOS, emphasizing their differences in motivations for each.
- A considerably larger proportion of users switched from Android to iOS due to improved user experience, with a massive 49% identifying this factor. Some of the additional general reasons why people switched from Android to iPhone are improvements in terms of features (27%) and pricing (11%).
- It is only 4% claimed to have been motivated by quicker software updates, while 8% belonged to other classifications.
- On the other hand, among the reasons that motivate users to shift from iOS to Android, it should be noted that better prices (29%) and better user experience (30%) were mentioned by those switching from iOS to Android.
- On the contrary, 24% of Android switchers switched because of better features, while 5% switched for another reason.
- Excellent customer service is another important reason why people switch from iOS to Android, as 7% of these users consider it primary.
- Furthermore, a few users on both sides regard more apps as a reason for switching: among Android users, 4%, while among iPhone users, 6% use it as a reason for switching.
iPhone Vs Android User Security and Privacy Preferences
- In 2025, approximately 72.15% of active mobile devices globally used Android, while iOS-powered Apple devices accounted for 27.37%.
- The fact that manufacturers customize the software for different Android devices can create additional security vulnerabilities, making them more prone to cyberattacks.
- While iOS users generally face fewer security risks, the possible risk with the standardization of iPhone software is that if a successful attack takes place, all iPhones will be affected.
- Apple’s strict application screening is the reason why malware cannot spread, and this is not something that can be compared with the rigors of the Google Play Store.
- Besides, Apple grants more standardized and widespread software updates, which provide blanket protection all at once, while Google’s update schedule is fragmented across various devices.
Summary
It appears that this rivalry between the iPhone and Android is unlikely to end anytime soon due to the strengths that each has to offer, as well as ardent fans of each. When considering user statistics on both phones, it is evident that the Android phone wins in terms of market share across the globe. iPhones excel in providing feature-rich services to people with above-average incomes, in addition to offering the needed brand prestige.
Difference between the two systems in terms of spending habits, user experience, and loyalty to a particular system. Thus, each system will serve a different purpose. Despite having loyal followers or even loyalists of both Android phones and iPhones, it is evident that these systems have carved a niche for themselves in the rapidly growing smartphone industry.
FAQ
Generation Z overwhelmingly prefers Apple (iPhone) over Android, particularly in the United States where roughly 87% of teenagers own an iPhone.
Globally, far more people use Android devices than iPhones.
The Apple iPhone 17 and Google Pixel 10a 5G are the top user-friendly phones. They offer clean software, simple navigation, great cameras, and long-term support. iPhones provide a uniform, intuitive iOS layout, while Pixels feature clean Android menus and helpful voice features.