
Introduction
Divorce Statistics: Divorce is something that impacts many lives each year—not just the couple splitting up, but also kids, relatives, and even friends. Whether you’re married, planning to get married, or want to learn more, looking at divorce stats can help you better understand today’s relationships.
In this article, “Divorce Statistics,” we’ll break down key numbers: how often divorces occur, the top reasons people separate, how factors such as age, income, and location impact the decision, and how divorce rates vary around the world. These facts can help you make smarter choices when it comes to love, marriage, and long-term commitment.
Editor’s Choice
- Among U.S. states, Nevada has the highest divorce rate, while Louisiana has the lowest.
- Parents with three daughters are 10% more likely to get divorced than those with three sons.
- Nearly 69% of all divorces are filed by women, often because of unfaithful partners or emotional needs not being met.
- When looking at divorce by race, Black women have the highest divorce rates, while Asian women have the lowest.
- Approximately 50% of first marriages, 67% of second marriages, and 73% of third marriages end in divorce.
- Children who go through more than one divorce in their family are often seen as “less likable” by other kids.
- Teens raised in single-parent homes or blended families are 300% more likely to need counselling or mental health support.
- Kids with divorced parents are more likely to face emotional struggles than those who lost a parent to death.
- Children from families that have broken apart are nearly 2 times more likely to attempt suicide.
- During a typical 5-hour wedding party, approximately 430 divorces occur in the country.
- Divorce Statistics stated that around 1% of married same-sex couples get divorced each year, which is lower than the 2% annual divorce rate for straight couples.
- On average, first marriages that end in divorce last about 8 years
Rate of Marriage Endings in Divorces in the United States
- Approximately 50% of first marriages, 67% of second marriages, and 73% of third marriages end in divorce.
 (Reference: divorce.com)
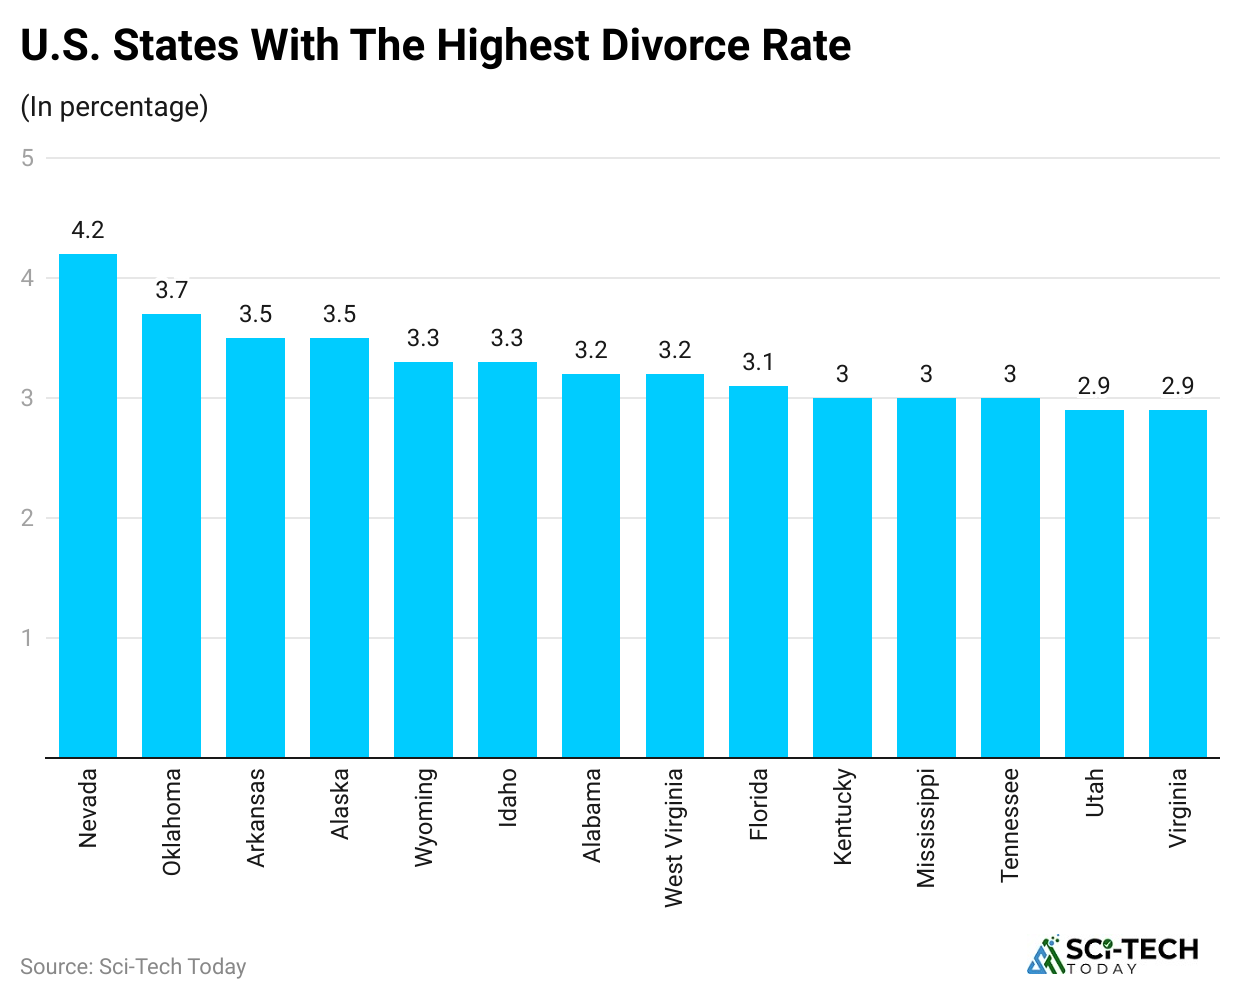
- The following are the states with the highest divorce rates per 1,000 people as of 2023.
| States | In % |
|
Nevada |
4.2 |
| Oklahoma |
3.7 |
|
Arkansas |
3.5 |
| Alaska |
3.5 |
|
Wyoming |
3.3 |
| Idaho |
3.3 |
|
Alabama |
3.2 |
| West Virginia |
3.2 |
|
Florida |
3.1 |
| Kentucky |
3.0 |
|
Mississippi |
3.0 |
| Tennessee |
3.0 |
|
Utah |
2.9 |
| Virginia |
2.9 |
 (Reference: divorce.com)
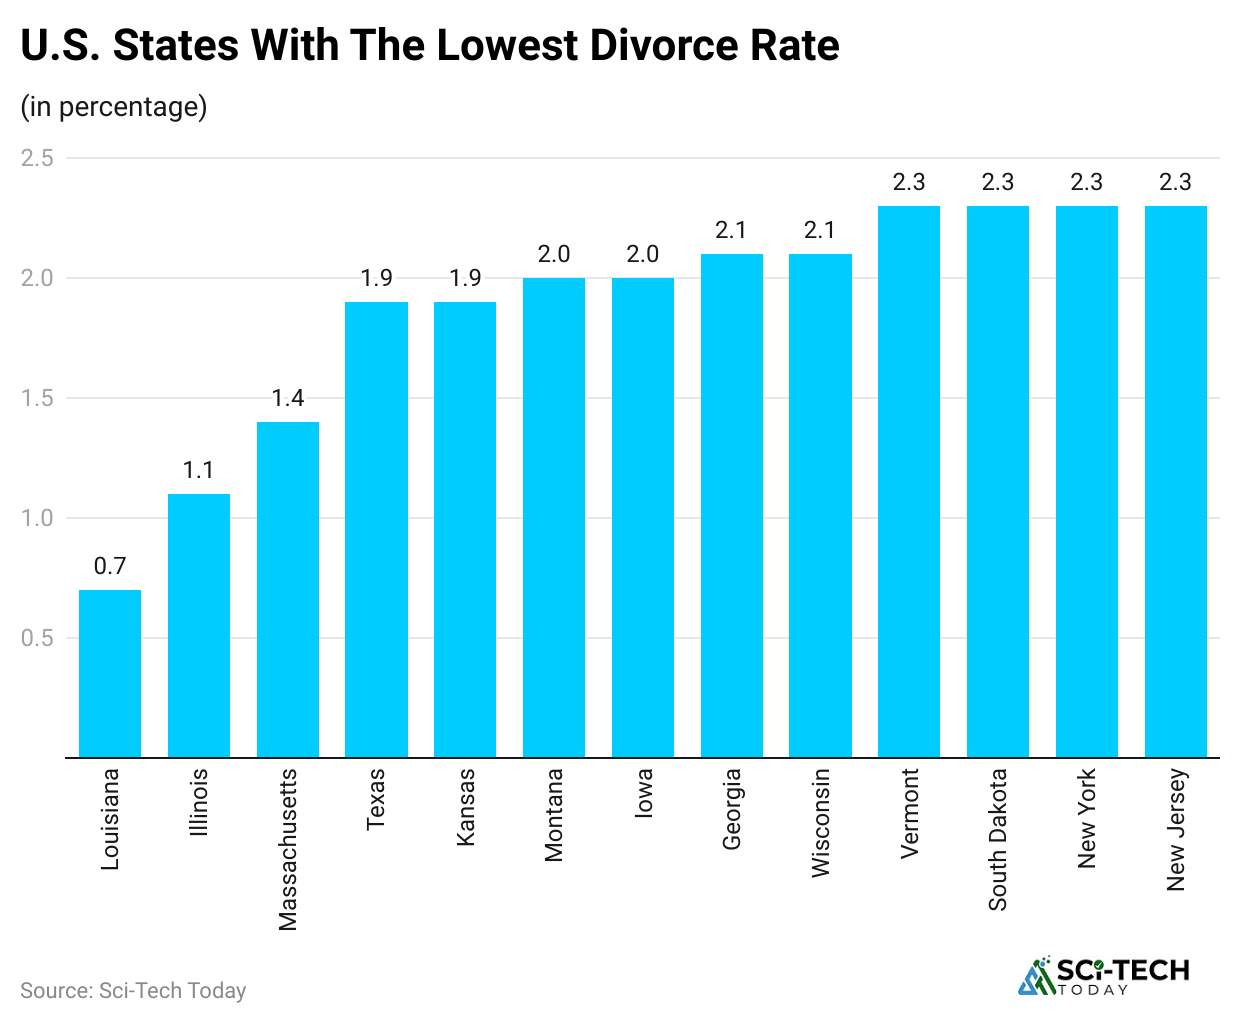
- The following table shows
| State | % |
|
Louisiana |
0.7 |
| Illinois |
1.1 |
|
Massachusetts |
1.4 |
| Texas |
1.9 |
|
Kansas |
1.9 |
| Montana |
2.0 |
|
Iowa |
2.0 |
| Georgia |
2.1 |
|
Wisconsin |
2.1 |
| Vermont |
2.3 |
|
South Dakota |
2.3 |
| New York |
2.3 |
|
New Jersey |
2.3 |
Share of women who are married or in a union statistics
- According to estimates from the United Nations, approximately 69% of women were either married or living with a partner in 1970, compared to around 64% in 2024.
- For the past 50 years, approximately 2 out of 3 women worldwide have been in some form of long-term relationship.
- In Asia and South America, the rate of women in relationships has remained relatively unchanged.
- However, in Africa, Europe, and North America, there has been a noticeable decline in the number of women who are married or in a union.
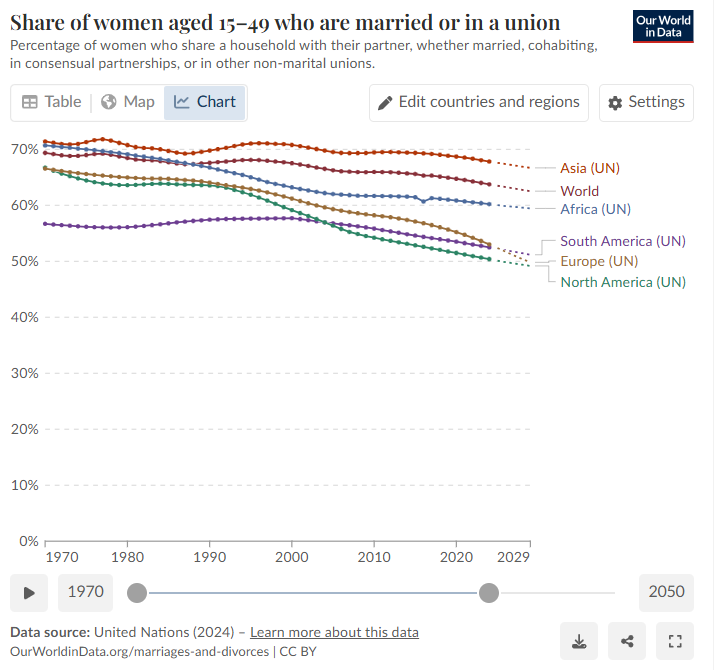 (Reference: ourworldindata.com)
| Year | Asia (UN) | World | Africa (UN) | South America (UN) | Europe (UN) | North America (UN) |
|
2000 |
70.8% | 67.5% | 63.2% | 61.2% | 59.1% | 57.7% |
| 2001 | 70.6% | 67.3% | 62.9% | 60.8% | 58.6% |
57.5% |
|
2002 |
70.3% | 67.0% | 62.7% | 60.4% | 58.1% | 57.3% |
| 2003 | 70.1% | 66.8% | 62.4% | 60.0% | 57.5% |
57.2% |
|
2004 |
69.8% | 66.5% | 62.2% | 59.6% | 57.0% | 57.0% |
| 2005 | 69.5% | 66.3% | 62.0% | 59.3% | 56.8% |
56.4% |
|
2006 |
69.4% | 66.1% | 61.9% | 59.0% | 56.6% | 55.8% |
| 2007 | 69.3% | 66.0% | 61.8% | 58.8% | 56.4% |
55.3% |
|
2008 |
69.3% | 66.0% | 61.7% | 58.6% | 56.3% | 54.9% |
| 2009 | 69.4% | 65.9% | 61.7% | 58.4% | 56.1% |
54.5% |
|
2010 |
69.5% | 66.0% | 61.7% | 58.2% | 55.8% | 54.2% |
| 2011 | 69.5% | 66.0% | 61.7% | 58.1% | 55.6% |
52.9% |
|
2012 |
69.5% | 65.9% | 61.6% | 57.9% | 55.4% | 53.7% |
| 2013 | 69.5% | 65.8% | 61.6% | 57.7% | 55.1% |
53.4% |
|
2014 |
69.4% | 65.7% | 61.5% | 57.4% | 54.8% | 53.1% |
| 2015 | 69.4% | 65.6% | 61.5% | 57.1% | 54.6% |
52.9% |
|
2016 |
69.3% | 65.3% | 60.7% | 56.8% | 54.4% | 52.6% |
| 2017 | 69.2% | 65.3% | 61.3% | 56.5% | 54.1% |
52.3% |
|
2018 |
69.0% | 65.1% | 61.2% | 56.1% | 53.9% | 52.0% |
| 2019 | 68.9% | 64.9% | 61.0% | 55.7% | 53.7% |
51.8% |
|
2020 |
68.7% | 65.7% | 60.9% | 55.2% | 53.5% | 51.5% |
| 2021 | 68.5% | 64.5% | 60.7% | 54.7% | 53.3% |
51.2% |
|
2022 |
68.3% | 64.3% | 60.6% | 54.2% | 53.0% | 50.9% |
| 2023 | 68.1% | 64.0% | 60.4% | 53.6% | 52.8% |
50.7% |
|
2024 |
67.8% | 63.8% | 60.2% | 53.0% | 52.5% | 50.4% |
| 2025 | 67.6% | 63.5% | 60.0% | 52.4% | 52.2% |
50.1% |
|
2026 |
67.4% | 63.3% | 59.9% | 52.0% | 51.7% | 49.9% |
| 2027 | 67.2% | 63.0% | 59.7% | 51.7% | 51.1% |
49.6% |
|
2028 |
66.9% | 62.8% | 59.6% | 51.5% | 50.4% | 49.4% |
| 2029 | 66.7% | 62.5% | 59.5% | 51.2% | 49.8% |
49.2% |
|
2030 |
66.5% | 62.3% | 59.3% | 50.9% | 49.2% |
49.0% |
Global Divorce Rate Statistics
 (Reference: lawyers.com)
- In the U.S., a divorce happens about every 42 seconds. That equals roughly 86 divorces an hour, 2,046 each day, 14,364 a week, and nearly 747,000 every year.
- A marriage takes place every 16 seconds in the U.S. That adds up to around 230 weddings per hour, 38,762 per week, and about 2 million annually.
- In the time it takes a couple to say their vows (about 2 minutes), around three divorces have already happened somewhere in the U.S.
- While watching a typical romantic comedy (2 hours long), more than 172 couples get divorced.
- During a typical 5-hour wedding party, approximately 430 divorces occur in the country.
- Over the typical 8-year span of a first marriage that ends in divorce, about 6 million divorces happen across the U.S.
- Over the past 40 years, around 67% of first marriages have eventually broken up.
- Among all U.S. adults age 18 and older—whether they’ve been married or not—25% have gone through a divorce.
- Today, around 15% of adult women in the U.S. are divorced or separated, compared to less than 1% back in 1920.
- On average, first marriages that end in divorce last about 8 years.
U.S Divorce Rate by Occupation Statistics
| Occupation | Divorce Rate |
|
Agricultural Engineers |
1.78 |
| Optometrists |
4.01 |
|
Clergy |
5.61 |
| Podiatrists |
6.81 |
|
Farmers |
7.63 |
| Dentists |
7.75 |
|
Audiologists |
7.77 |
| Legislators |
8.74 |
|
Other Scientists |
8.79 |
| Medical Scientists |
9.11 |
|
Mechanical Engineers |
9.22 |
| Doctors and Surgeons |
9.23 |
|
Law Enforcement |
14.47 |
| Corrections Workers |
21.3 |
|
Maids |
26.3 |
| Roofers |
26.8 |
|
Waitstaff |
27.1 |
| Telemarketers |
28.1 |
|
Bellhops and Concierges |
28.4 |
| Entertainers |
28.4 |
|
Home Care Aids |
28.7 |
| Nurses |
28.9 |
|
Textile Machine Operators |
29 |
| Telephone Operators |
29.3 |
|
Food and Tobacco Machine Operators |
29.7 |
| Gaming Service Workers |
31.3 |
|
Gaming Cage Workers |
34.6 |
| Massage Therapists |
38.2 |
|
Bartenders |
38.4 |
| Dancers |
43 |
- Groups most likely to go through a divorce include adults with low incomes (making under $20,000 a year) at 39%, Baby Boomers at 38%, people who follow non-Christian religions at 38%, Black Americans at 36%, and individuals with liberal social or political views at 37%.
- In contrast, those least likely to get divorced after getting married are Catholics at 28%, evangelical Christians at 26%, high earners (making more than $75,000 a year) at 22%, Asian Americans at 20%, and people with conservative views at 28%.
Same-Sex Divorce Statistics
#1. United States
- Around 1% of married same-sex couples get divorced each year, which is lower than the 2% annual divorce rate for straight couples.
- Female same-sex marriages (lesbian couples) are more likely to end than male same-sex or straight marriages. For instance, about 34% of lesbian marriages have ended in divorce, compared to 19% of heterosexual ones.
#2. Netherlands
- Since same-sex marriage became legal, about 26% of lesbian marriages ended in divorce by 2021.
- That’s higher than the 16% divorce rate for straight couples and 14% for gay male marriages.
#3. Sweden & ???????? Norway
- In these countries, lesbian marriages are 10% more likely to end in divorce than male same-sex marriages.
- In Sweden, about 40% of lesbian marriages ended in divorce between 1995 and 2012, compared to 30% for both gay male and straight marriages.
#4. United Kingdom
- Lesbian civil unions were 2.5× more likely to result in divorce than gay male unions.
Reasons for Divorce in 2024-2025
- Not Fully Committed – About 75% of divorces happen because one or both people weren’t truly committed to staying together.
- Cheating – Infidelity plays a part in around 60% of divorces. In nearly 45% of these cases, cheating was the main reason.
- Fighting and Poor Communication – Roughly 58% to 59% of couples say their marriage ended because of too much arguing or not being able to talk things through properly.
- Financial stress is a contributing factor in 22% to 38% of divorces. Issues include debt, spending habits, and income disparities.
- Drug or Alcohol Use – Substance abuse was a factor in about 17% to 35% of breakups.
- Abuse – About 24% of divorces involve abuse—either physical or emotional harm from a partner.
- Marrying Too Young – Getting married at a young age is linked to approximately 45% of divorces.
- Unrealistic Expectations or Unmet Needs – When people feel their emotional, physical, or relationship needs aren’t being met, it leads to about 13% to 75% of divorces.
- Not Compatible – Differences in values, goals, or interests lead to 31% to 43% of marriages ending in divorce.
Other Reasons
- Lack of support from family (14% to 43%)
- Health problems (17%)
- Religious or cultural differences (12% to 13%)
- Problems that started before marriage (13% to 58%)
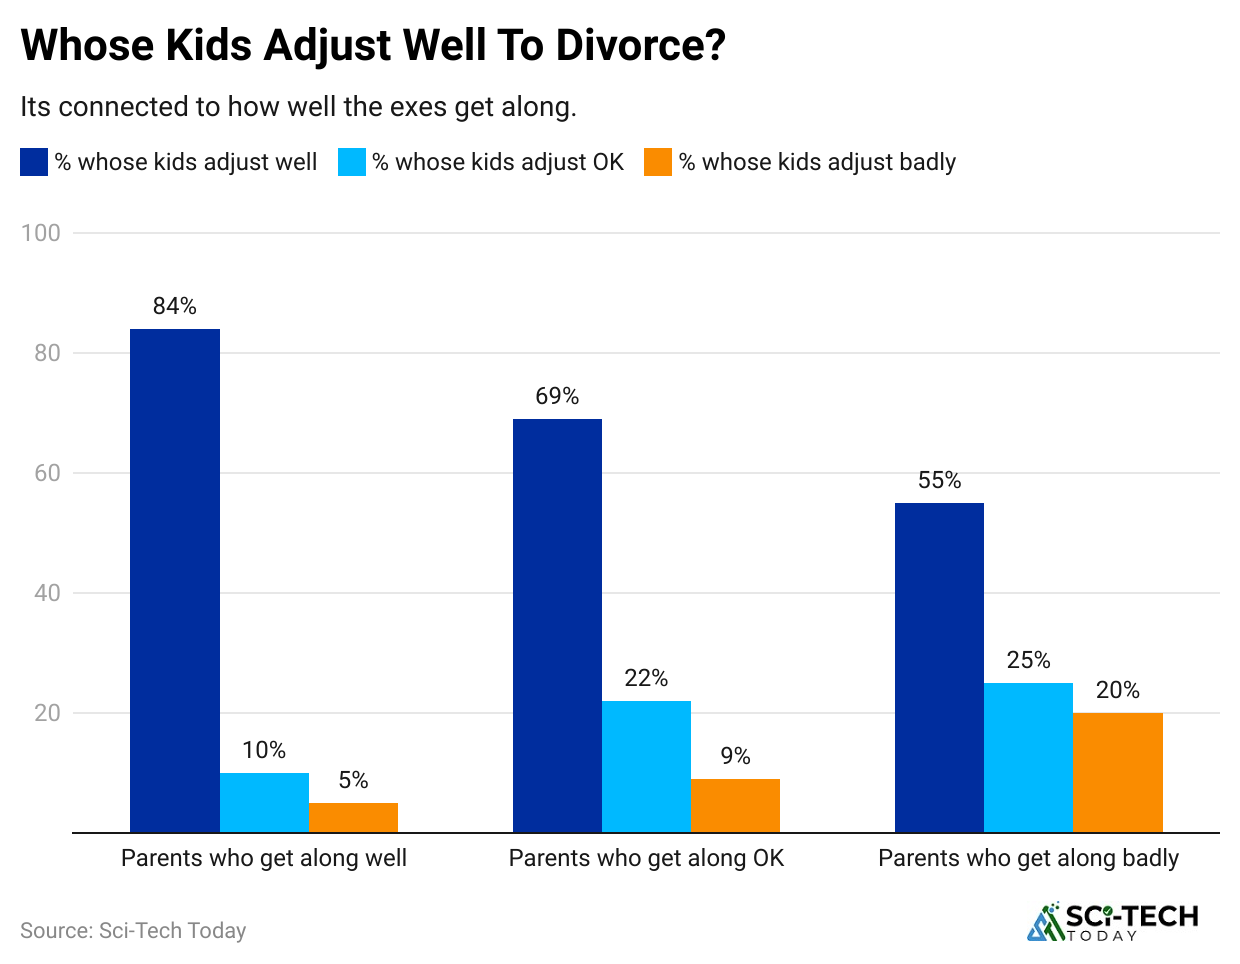
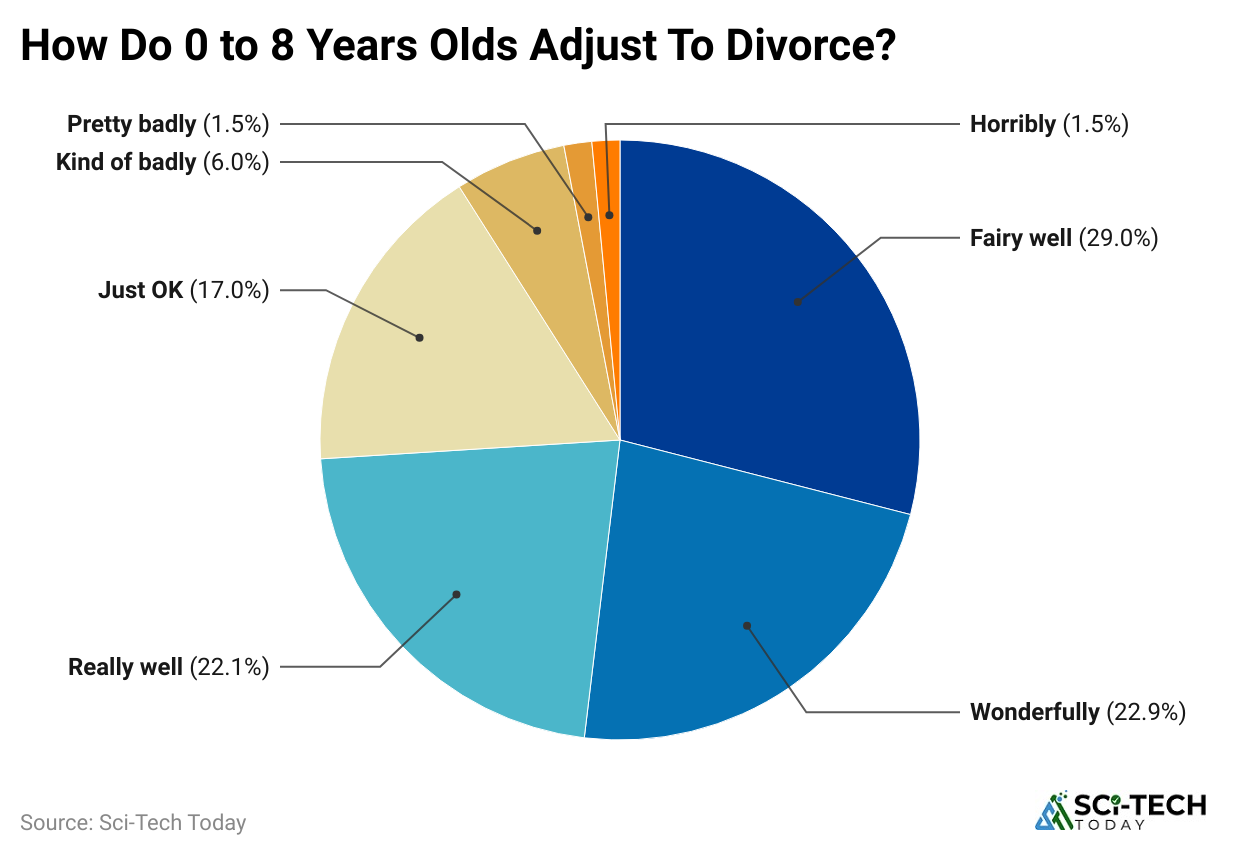
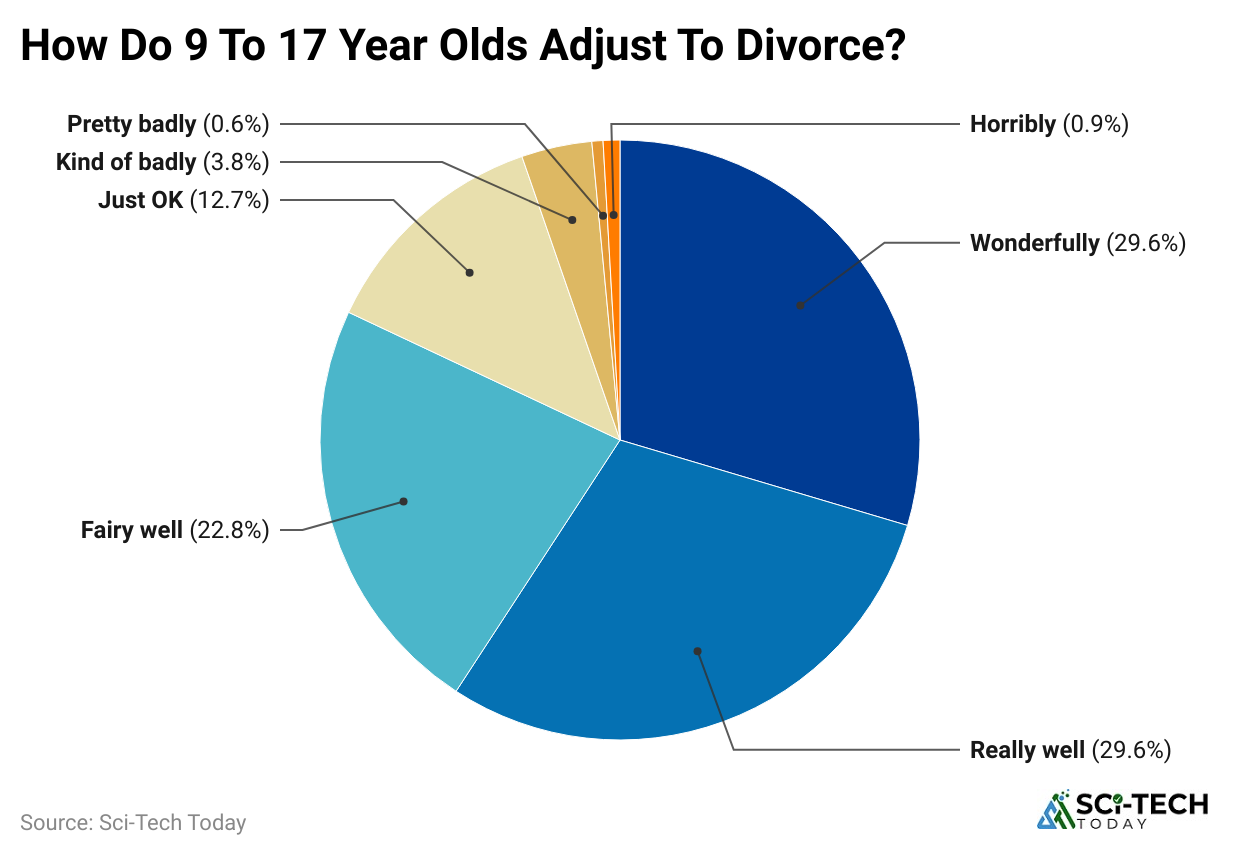
Effects of Divorce on Children
- About 50% of children in the U.S. will go through their parents’ divorce.
- Another 50% of those kids will also see their parents’ second marriage end.
- Twins or triplets are 17% more likely to experience a parental divorce than single-born children.
- Girls are almost 5% more likely than boys to witness a parental breakup.
- Parents with three daughters are 10% more likely to get divorced than those with three sons.
 (Reference: custodyxchange.com)
- Kids born outside of marriage are 24% more likely to see their parents separate.
- Children whose parents are both from divorced families have a 50% higher chance of marrying each other.
 (Reference: custodyxchange.com)
- Children of divorced parents are 35% more likely to go through a divorce themselves as adults.
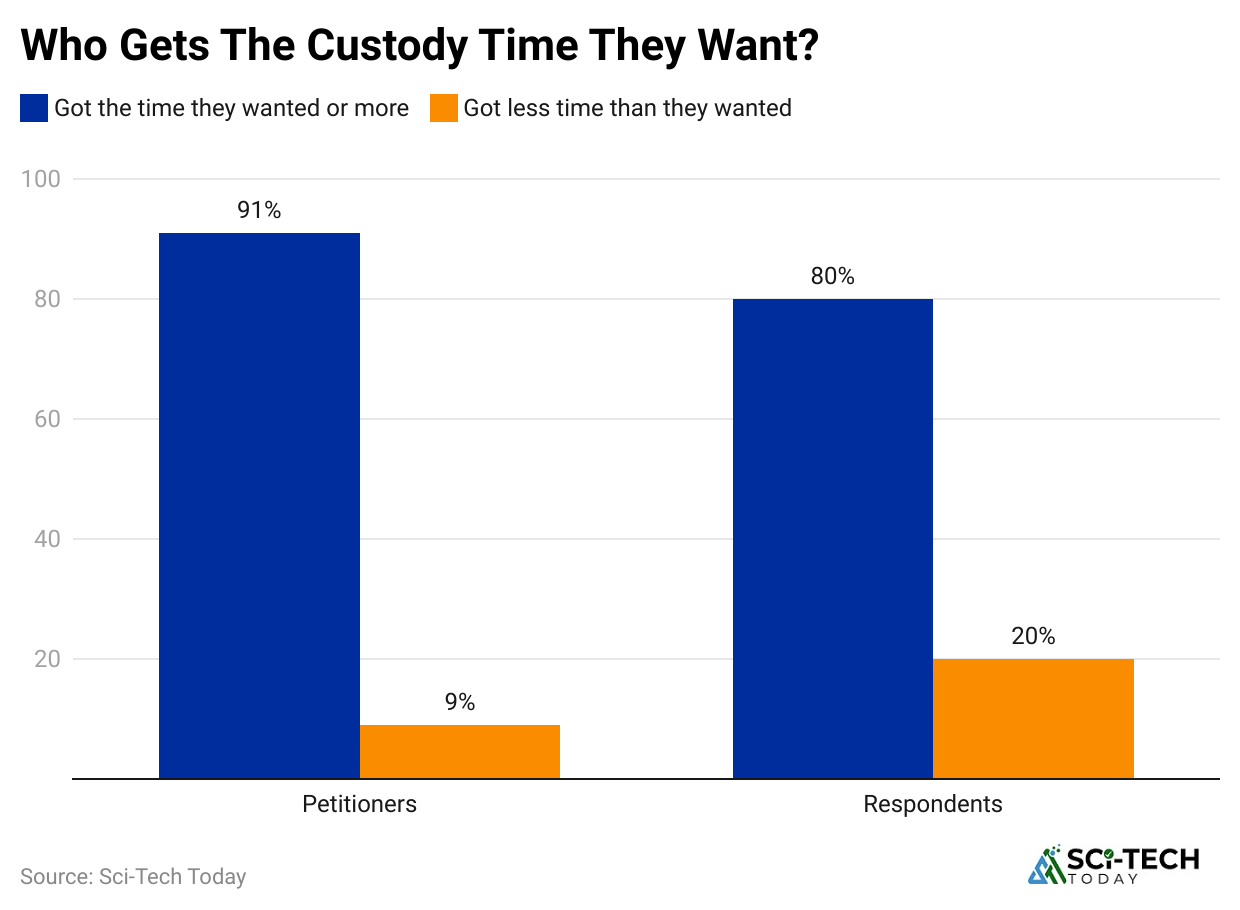
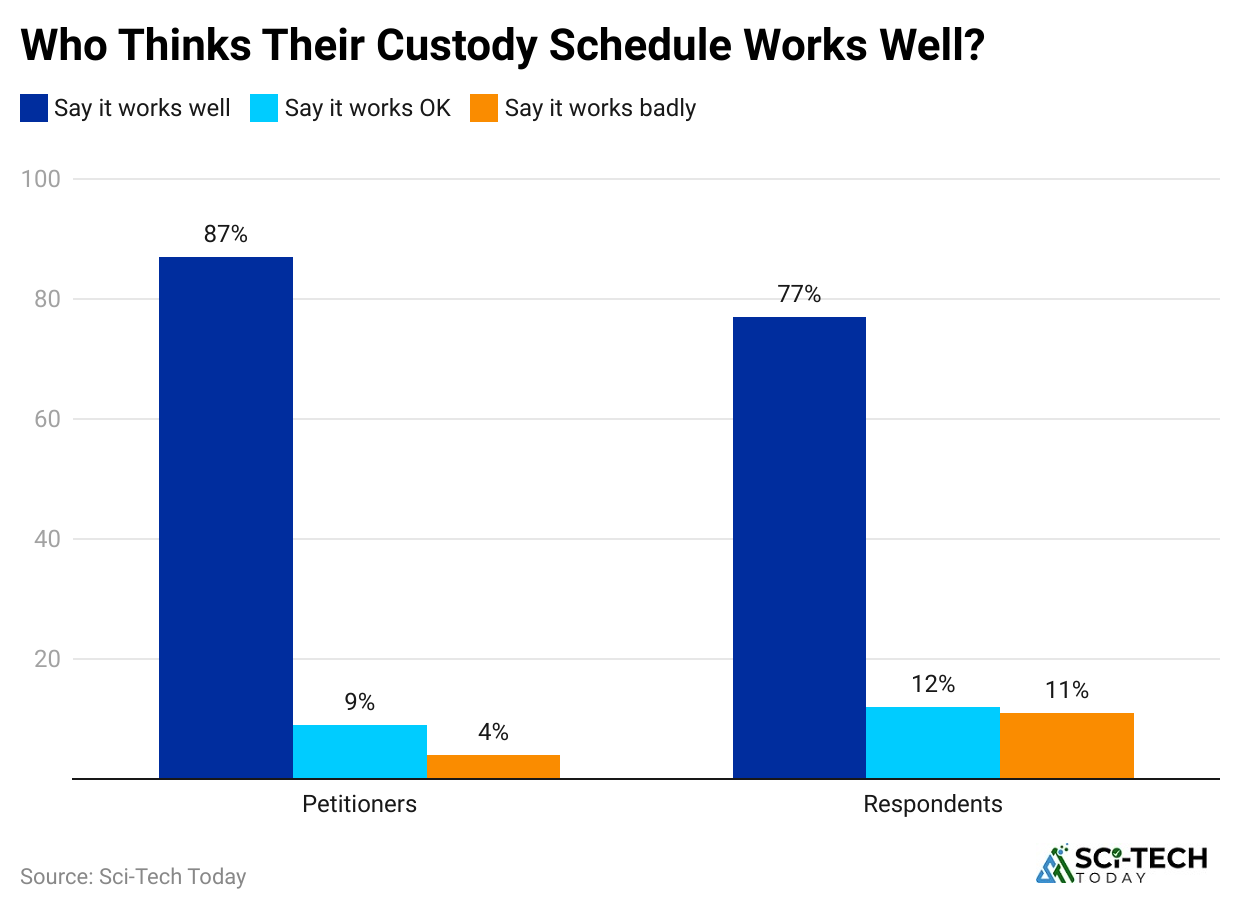
- Divorce Statistics stated that 90% of divorced moms take custody of their children.
 (Reference: custodyxchange.com)
- Around 79% of these moms receive financial child support.
- Divorce Statistics stated that fewer than 30% of divorced dads with custody get child support.
- Kids from divorced families are more likely to suffer physical issues like asthma, injuries, headaches, or speech delays.
 (Reference: custodyxchange.com)
- These children are 50% more likely to have health problems.
 (Reference: custodyxchange.com)
- Overall, they are 20% less physically healthy compared to kids from households where parents stay together.
Conclusion
Divorce still plays a big role in many families across the U.S. and worldwide. Even though the divorce rate has dropped in recent years, it still impacts millions, especially kids. The data shows that things like low income, race, gender, education level, and even having daughters can raise the chances of a marriage ending. Divorce often brings emotional stress and financial struggles, particularly for single moms and dads raising children.
By understanding these facts and trends, individuals can make more informed decisions, seek assistance when needed, and work toward building better relationships and a stronger support system for their families. We have shed enough light on Divorce Statistics through this article.
