





First Glance
Wind Energy Statistics: The year 2025 sees wind power installation figures remaining almost at the same level as the previous year, with the contribution of wind energy being still paramount among renewable energy sources and promoting environmental sustainability considerably. In 2025, Wind Energy found its place in the renewable energy field like never before.
Governments, companies, and private individuals have turned their focus on this technology because it is efficient and economical. In this regard, wind energy statistics for 2026 look at the capacity, costs, and development of wind energy.
Editor’s Verified Favorites
- According to wind energy statistics, Asia was at the forefront in terms of wind energy generation.
- Global wind generation hit a record 2,494 TWh in 2024, with wind’s electricity share rising slightly to 8.1%.
- China’s installed wind capacity hit 640.6 GW by the end of 2025, nearly 60% higher. The planned Taiwan Strait project is still in the pipeline, now sized at roughly 43.3 GW, which would indeed dwarf Jiuquan’s 20 GW.
- In 2024, commercial offshore wind energy production shifted to reporting capacity, which grew from 68 GW (2023) to 83.2 GW.
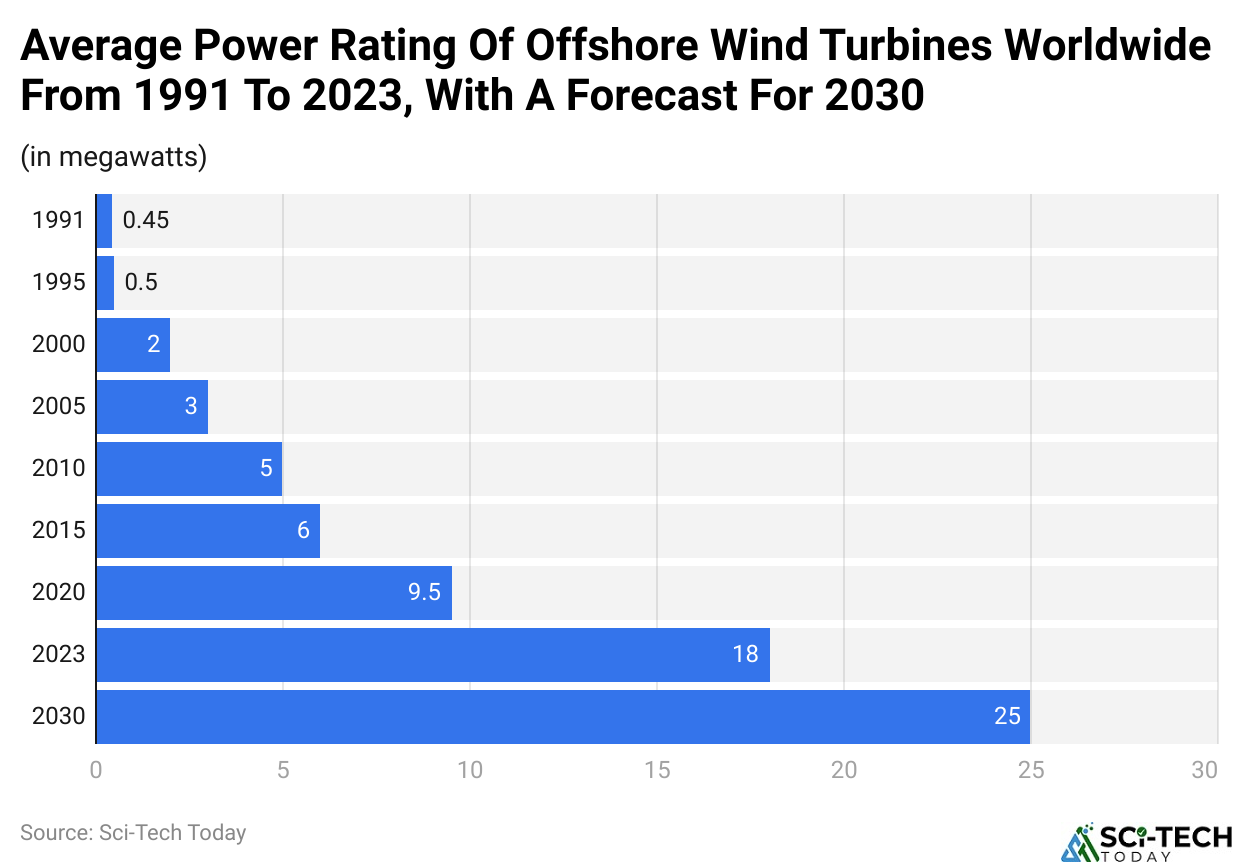
- Wind energy statistics reveal that, with respect to offshore turbines, Ariel Wright British Airways has advanced quite remarkably, with average power ratings increasing from 9.5 MW in 2020 to 18 MW two years down the line. It is forecast that the capacity of offshore wind turbines will increase to an average of 25 MW by 2030, which will lead to more energy being produced at a lower cost.
- Wind power capacity, in terms of MW, reached 1,136 GW by the end of 2024, and surged to approx. 1,347 GW by the end of 2025 across the world.
- Southeast Asia and Latin America’s developing markets are likely to spearhead wind energy growth due to favorable government policies and a supportive investment climate.
- Global wind power employment stood at approximately 1.9 million people in 2024.
- The majority of horizontal axis wind turbines (HAWT) are available in a plethora of designs that vary from small residential units of 2.5 meters, 1 kW, to large offshore designs of 100+ meters, 10+ MW.
- Wind energy statistics show that Most turbines work at an efficiency level of about 50%, even though the theoretical efficiency limit is 59% for wind turbines, commonly referred to as the Betz Limit.
- In the United States, onshore turbines have capacity factors ranging from 9% to 53%, with an average capacity factor of 37%.
- On the other hand, offshore wind projects are anticipated to achieve a capacity factor of 60% by the year 2050.
- In 2024, wind power curtailment in the United States stood at 5.5% opportunity cost, still a significant improvement from the 11.1% opportunity cost of curtailment experienced in 2009.
- The current state-of-the-art offshore wind installation puts limits in the range of 40-50 meters in depth, but the growing floating turbine technology is expected to enable the harnessing of water resources in deeper areas, where 58% of the technical wind resources in the US are found.
Wind Energy Key Facts
- Global installed wind capacity reached about 1,136 GW by the end of 2024 and surged past 1,347 GW by the end of 2025.
- China has positioned itself as the country with the highest number of cumulative wind power installations and the most added capacity over the years.
- China added 86.9 GW of new wind capacity in 2024, and then a record 130.3 GW in 2025, representing 77% of the entire global market for new wind turbines that year, up from 72% in 2024 and 65% in 2023.
- China’s installed wind capacity passed 600 GW by the end of 2025 (691.75 GW per WWEA data), giving it more than 50% of total global installed wind capacity.
- In 2023, Sweden and Denmark managed to attain 3.3 megawatt-hours of production per head. It is important to highlight that among the top ten countries with per capita wind energy production, all were members of the European Union.
- Denmark had the highest percentage of wind energy on the electricity demand side, reaching above 57%, with Ireland and Spain following at low ratios.
- The price of wind energy has diminished significantly over the last ten years, making it more attractive as a source of energy across the world.
- The global weighted-average installed cost for onshore wind fell further to about USD 1,041/kW by 2024.
- Offshore wind’s global weighted-average installed cost stood at about USD 2,852/kW in 2024.
- Wind energy is one of the sources of energy that will grow at the highest rate in the world. Annual wind capacity additions are expected to fall between 117 and 182 gigawatts in the years to come.
- Wind energy statistics estimate that Asia and Europe will dominate the new additions onshore and offshore, respectively, with China expected to add 12 gigawatts of new offshore wind capacity in 2024.
Wind Energy Production
(Reference: statista.com)
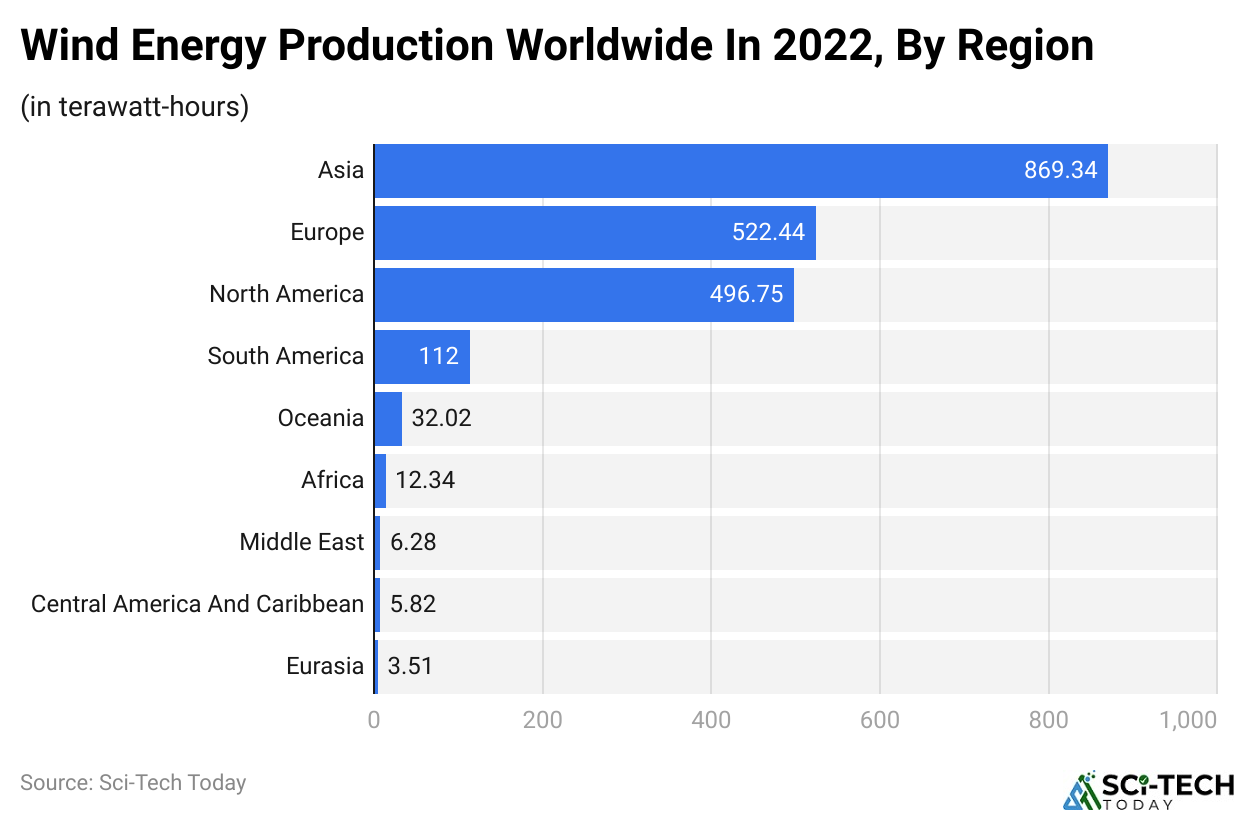
- Global wind generation reached about 2,712 TWh in 2025 (up from 2,494 TWh in 2024), with Asia continuing to lead, though updated region-specific splits; the EU alone generated 477 TWh from wind in 2024.
- In recent years, wind energy statistics indicate that the share of wind energy in the total energy generated has always been more than 8.5%.
- Asia has already proven to be the world’s number one region in wind power generation, accounting for more than one-third of wind power generated worldwide.
- There is no doubt that this is greatly attributed to China, which is the most prolific producer and consumer of wind energy on this continent and around the globe.
- China proposes to build what would be the biggest onshore wind farm in the world, with an established and operational base and an installed capacity of 570 GW by 2025.
- The facility, expected to be constructed in the Taiwan Strait, will exceed the already existing and operational Jiuquan wind power base, the biggest wind energy facility in China, located in the Inner Mongolia region.
- By the end of 2025, cumulative installed wind capacity reached approximately 1,347 GW globally, with a record 169 GW added in 2025 alone.
- Nevertheless, in order to be on course to the target for Net Zero Emissions by 50 years from now, the current annual targets must be greatly elevated, with an average of 390 gigawatts by 2030.
Offshore Wind Production
(Reference: statista.com)
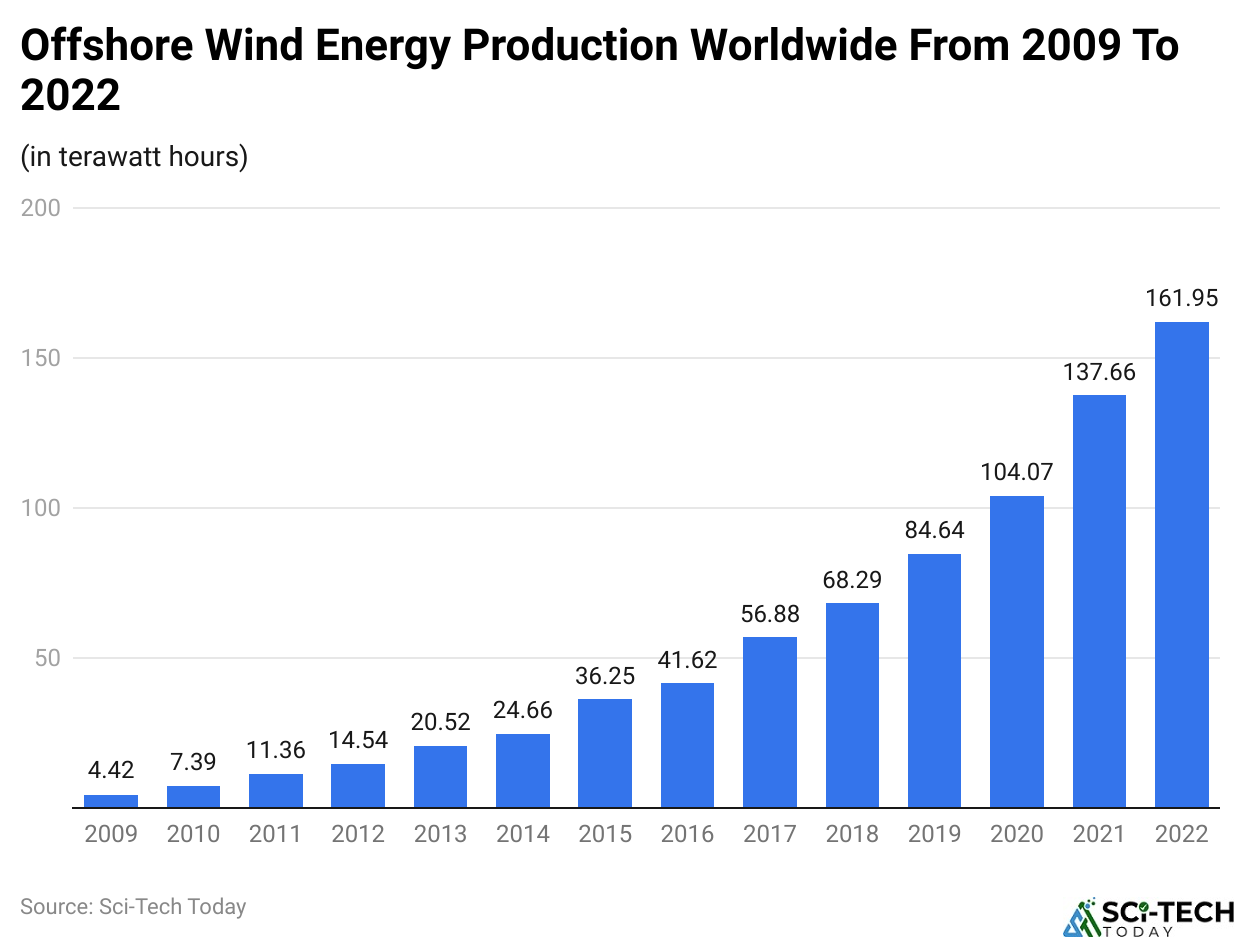
- The production of offshore wind energy across the globe has witnessed phenomenal developments, hitting the highest peak of more than 161 terawatt-hours in the year 2022.
- This translates to a rather impressive increase of 157 terawatt-hours from the year 2009, typifying the growth in offshore wind power generation and its uptake within ten years.
- Some countries, such as China, have been central to this enhancement, with their contributions significantly impacting the overall picture.
- China’s offshore wind capacity continued to lead the world, with roughly 39.1 GW connected to the national grid by Q3 2024.
- This figure epitomizes the country’s policy towards wind energy and its capacity to expand offshore projects in line with energy provision and environmental sustainability.
Power Rating of Offshore Wind Turbines Worldwide
(Reference: statista.com)
- If we turn the pages of history towards recent years, it’s not hard to point out the fact that wind turbine technology has undergone some transformation revolutionarily consisting of bigger and more efficient turbines.
- Wind energy statistics reveal that the global average offshore turbine size reached 9,815 kW delivered to market in 2024, and the industry frontier has now pushed dramatically further, with 20 MW turbines commercially installed in China in early 2026 and a 26 MW prototype unveiled by Dongfang Electric in October 2024.
- The increase is due to improvements in engineering, materials, and design of the turbines, which facilitate the more efficient collection of wind. And, in the future, the tendency towards even higher power ratings will no doubt persist.
- Forecasts suggest that the mean size of an offshore wind turbine to be in operation by 2030 will be close to 25 Megawatts.
- The increasing size and efficiency of turbines mean that there will be higher energy output per turbine, lowering costs and increasing the potential for wind energy as a renewable resource.
Wind Energy Industry Jobs
(Reference: statista.com)
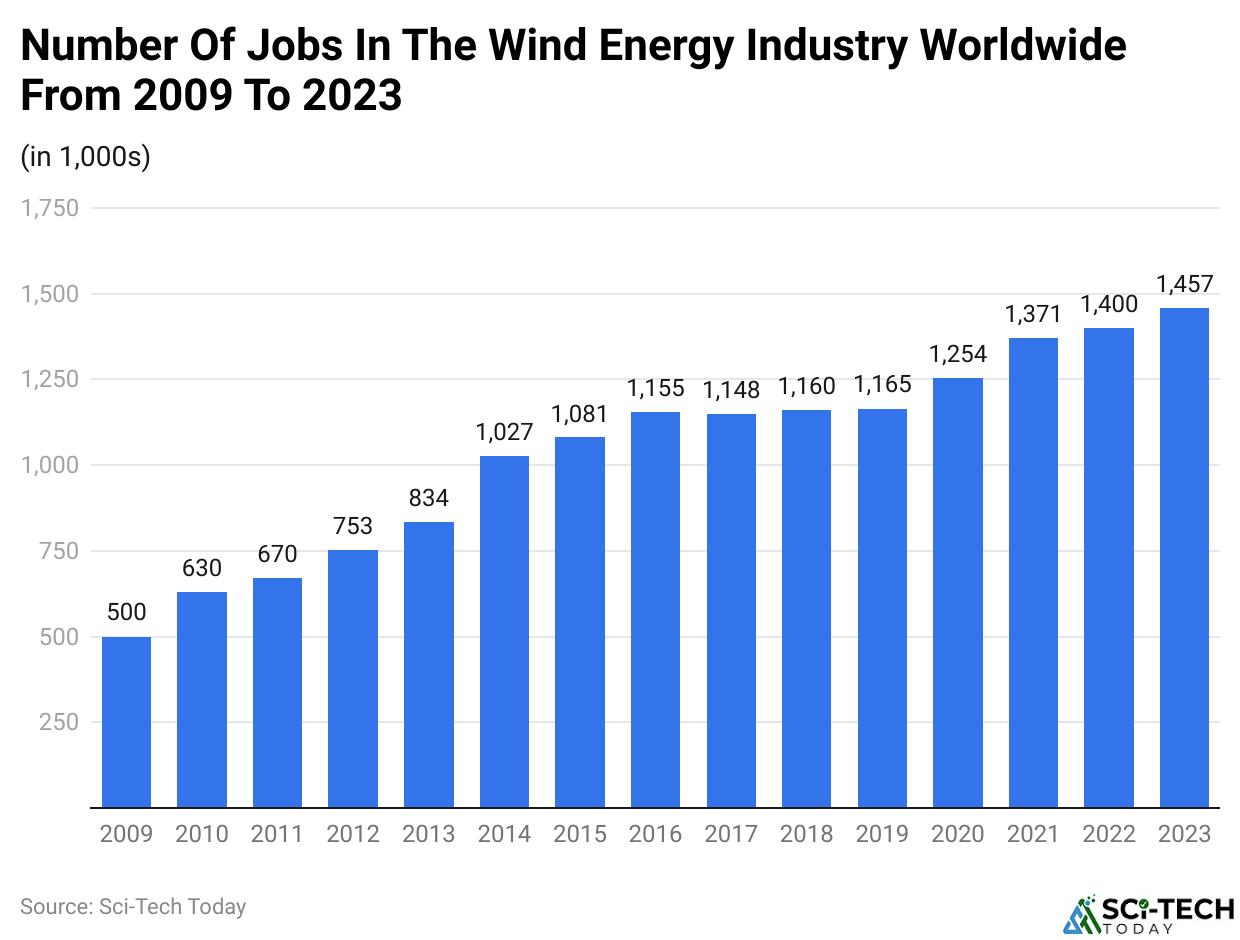
- Wind energy statistics show that in 2024, the global wind industry employed an estimated 1.9 million workers, representing a growth rate of about 8% from the previous year.
- While this rise is not large, it is indicative of the growth in the market, which is primarily attributed to the rise in investments in wind energy initiatives, technology developments, and the world’s move towards renewables.
- The almost consistent rise in wind energy employment in recent years signifies that this field is one of the key answers to the employment crisis faced by the renewable energy industry.
- It should also be remembered that as the sector grows, and in countries where there is an effort to define scenarios in which energy transitions happen in the context of clean energy, jobs will be created as well.
Leading Wind Power Asset Owners Worldwide by Operating Capacity
(Reference: statista.com)
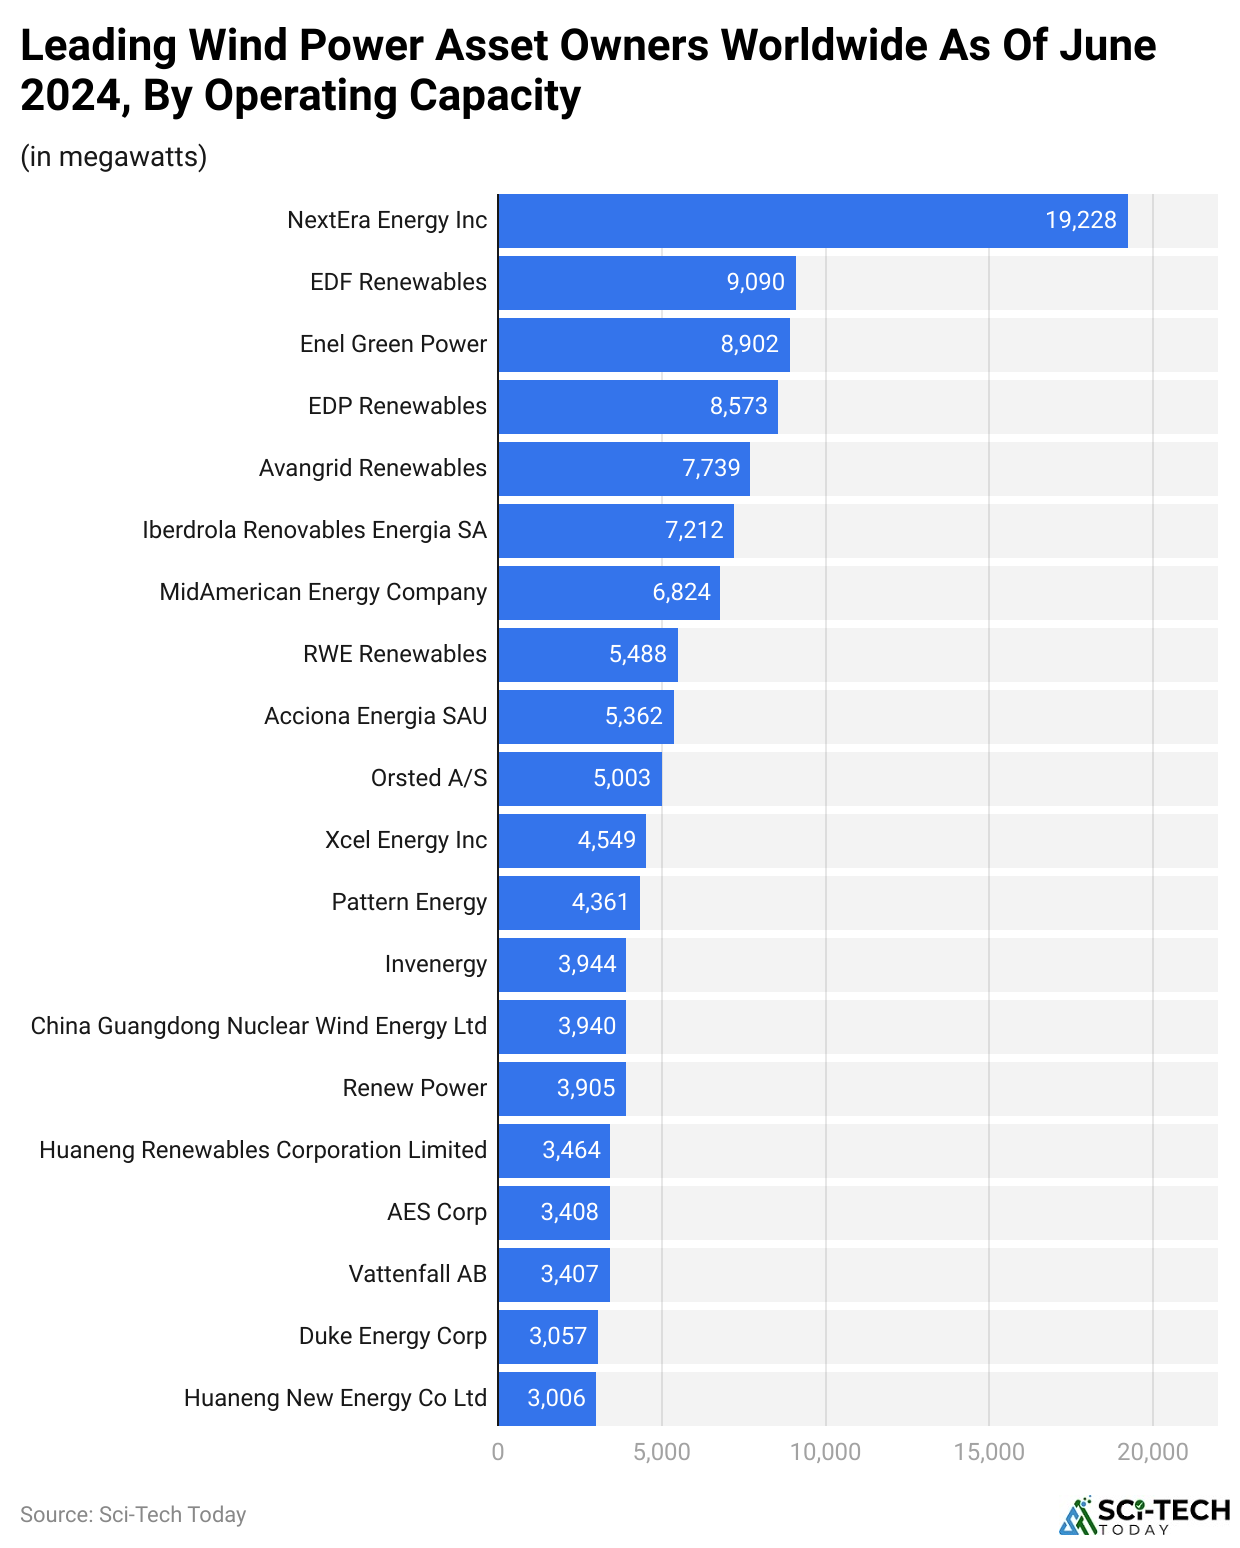
- NextEra Energy remains the world’s largest generator of renewable energy from wind and solar as of 2025, with its parent portfolio now spanning more than 40,000 MW (40+ GW) of total generating capacity as of December 31, 2025.
- This indicates the firm’s leadership in a sector especially dominated by wind energy. By contrast, EDF Renewables possessed the world’s second-largest wind operating capacity, at about 13.2 gigawatts in 2024.
- This capacity is rather small considering that more than half of this figure is NextEra’s, showing the depth and market power of this particular company.
- These numbers show that the majority of these actors are investing more and doing more in terms of networks to enhance their market competitiveness in the wind energy sector as the demand for renewable energy grows globally.
Cumulative Installed Wind Power Capacity
(Reference: statista.com)
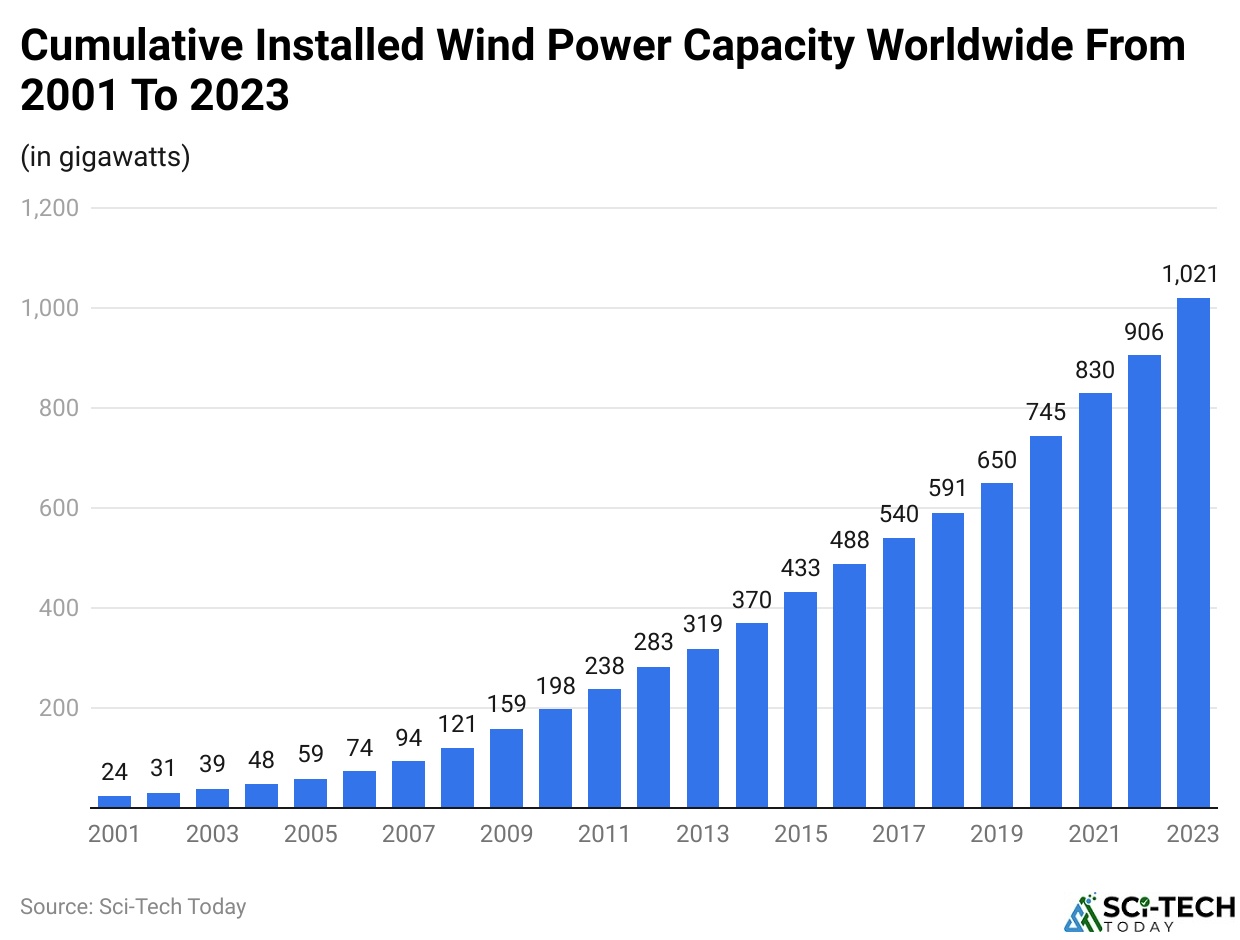
- Wind energy statistics indicate that as of 2025, the total installed wind power capacity worldwide was approximately 1,347 gigawatts, with the largest share – about 946 gigawatts, accounted for by land-based wind power.
- China holds the title of the largest wind power market in the world, with an installed capacity surpassing 620 gigawatts. Its geographical features, particularly the vast landmass and long coastlines, offer the country a lot of wind energy.
- More recently, China has successfully developed offshore wind projects to a sizeable extent, owing to the country’s great ambitions to grow its offshore wind energy resources.
- Other emerging countries, such as those found in the Southeast Asian and Latin American regions, are expected to contribute significantly towards the acceleration of the growth of wind energy development.
- There are expectations that government support, investments, and the introduction of better policies will facilitate these developments in these markets.
- Renewable energy technologies are attaining more affordability and are contributing to an increase in the ‘Other Renewables’ proportion in electricity generation across regions.
Wind Technology And Impacts
- Turbines in a horizontal axis configuration (HAWT) are the most preferred turbine design. These turbines comprise blades (typically three) that are evenly spaced around a hub that is attached to a shaft that connects to a gearbox and generator fixed in a nacelle located at the top of the tower.
- The variations of horizontal axis wind turbines can be both small, with a diameter of 2.5 meters and consuming 1 kW for household use, and very large offshore designs that stand above 100 meters and produce more than 10 MW of power.
- Wind energy statistics reveal that Theoretical calculations suggest that the maximum efficiency achievable by a wind turbine is about 59%, also known as the Betz Limit. However, this is hardly ever achieved, as most turbines use about 50% of the wind that goes through their rotor area.
- For instance, the capacity factor, which expresses a ratio of a turbine’s average power output divided by the turbine’s rated (maximum) power output, is 9% to 53%, with an average of 37% for onshore turbines in the US.
- In the United States, wind power curtailment averaged 5.5% in 2024, up from 5.3% in 2022, still a significant decline from the highest-ever wind power curtailment of 11.1% in 2009.
- Offshore winds are mainly strong compared with land, which makes the capacity factor high. It is expected that the capacity factor for new offshore capacity projects by 2050 will be as high as 60% or more.
- Nonetheless, there is a higher cost of installation and operation related to offshore wind power.
- Currently, offshore wind turbines are set up to a maximum depth of 40-50 meters of water.
- The development of floating technology in installing offshore wind capacity may transform the dynamics of wind generation because 58% of technical wind resources in the US are located in areas where water depths exceed 60m.
Summary
In the year 2025, wind energy statistics have established themselves as one of the pillars of the energy transition. Due to all these changing factors, lower prices, larger installations, and increased capacity, it has continued to be one of the main trends in the clean energy transition. The situation in the industry is also optimistic, and more funds and creativity are being invested to pave the way for green energy.
FAQ
The biggest problem with wind turbines is their intermittency and unreliability, which requires a backup power source because they only generate electricity when the wind blows.
China is the number one country in the world for wind energy production, total installed capacity, and offshore wind capacity.
A 1 kW (kilowatt) wind turbine costs between USD 300 and USD 1,000 for the turbine unit alone, while a full working system with a tower, batteries, and a controller costs USD 1,200 to USD 3,000.