





The Ultimate Picks
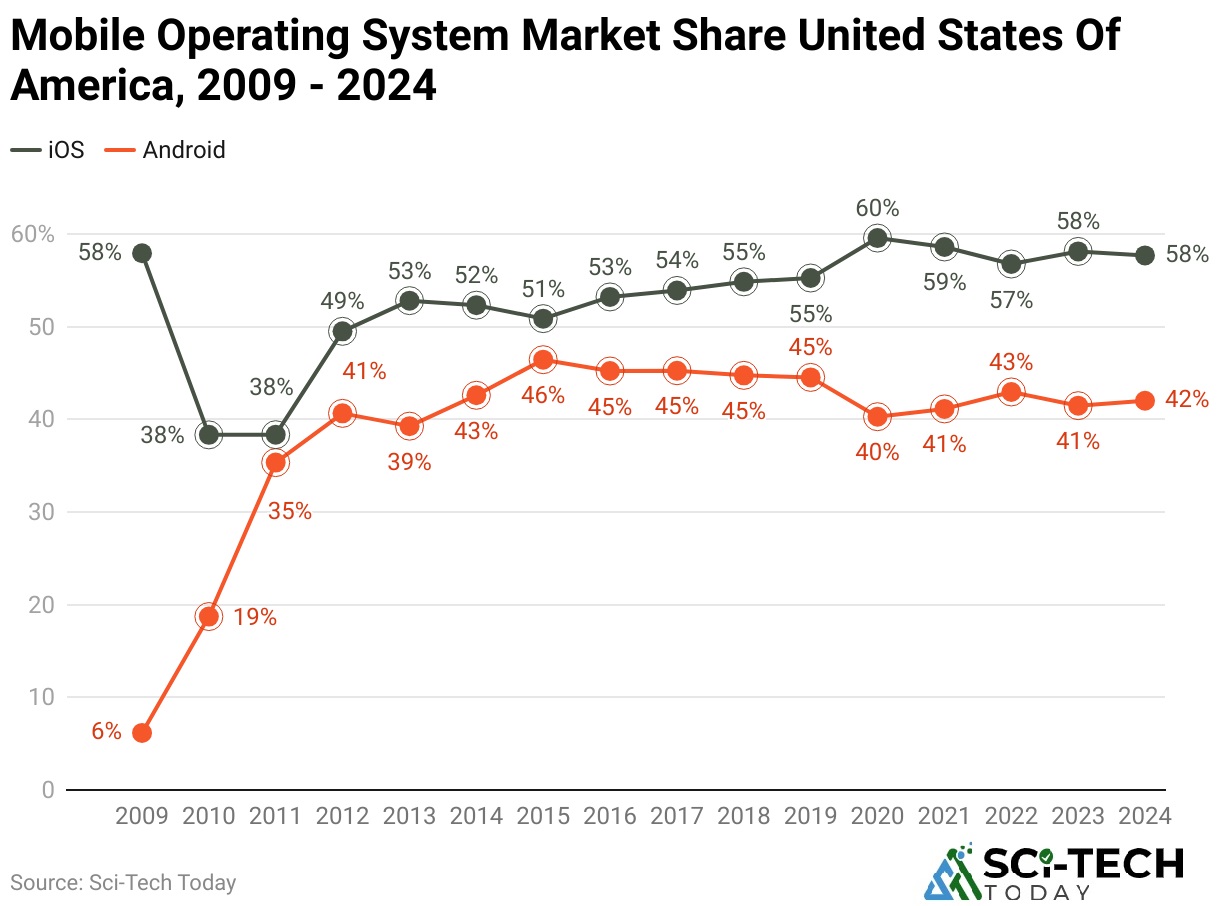
iPhone vs Android Statistics: Android and iOS are the leading mobile operating systems globally, each with distinct market shares and user demographics. As of February 2025, Android holds approximately 71.75% of the global mobile operating system market, while iOS accounts for about 27.78%. In the United States, iOS has a higher adoption rate, with a market share of around 58%, compared to Android’s 42%.
Customer loyalty remains strong for both platforms; Android boasts a retention rate of 91%, slightly surpassing iOS at 86%. These figures underscore the competitive landscape of the mobile operating system market, with each platform maintaining a dedicated user base and varying regional dominance.
What Caught the Editor’s Eye
- As of February 2025, Android holds 72.72% of the global mobile operating system market, while iOS accounts for 26.92%.
- In the first quarter of 2025, Android held approximately 71.88% of the global mobile operating-system market, while iOS accounted for about 27.65%.
- For global smartphone sales, Android accounted for 76% in Q1 2025, while iOS represented 19%.
- In Europe (2025), Android users represented 71%, while iPhone users made up 33%.
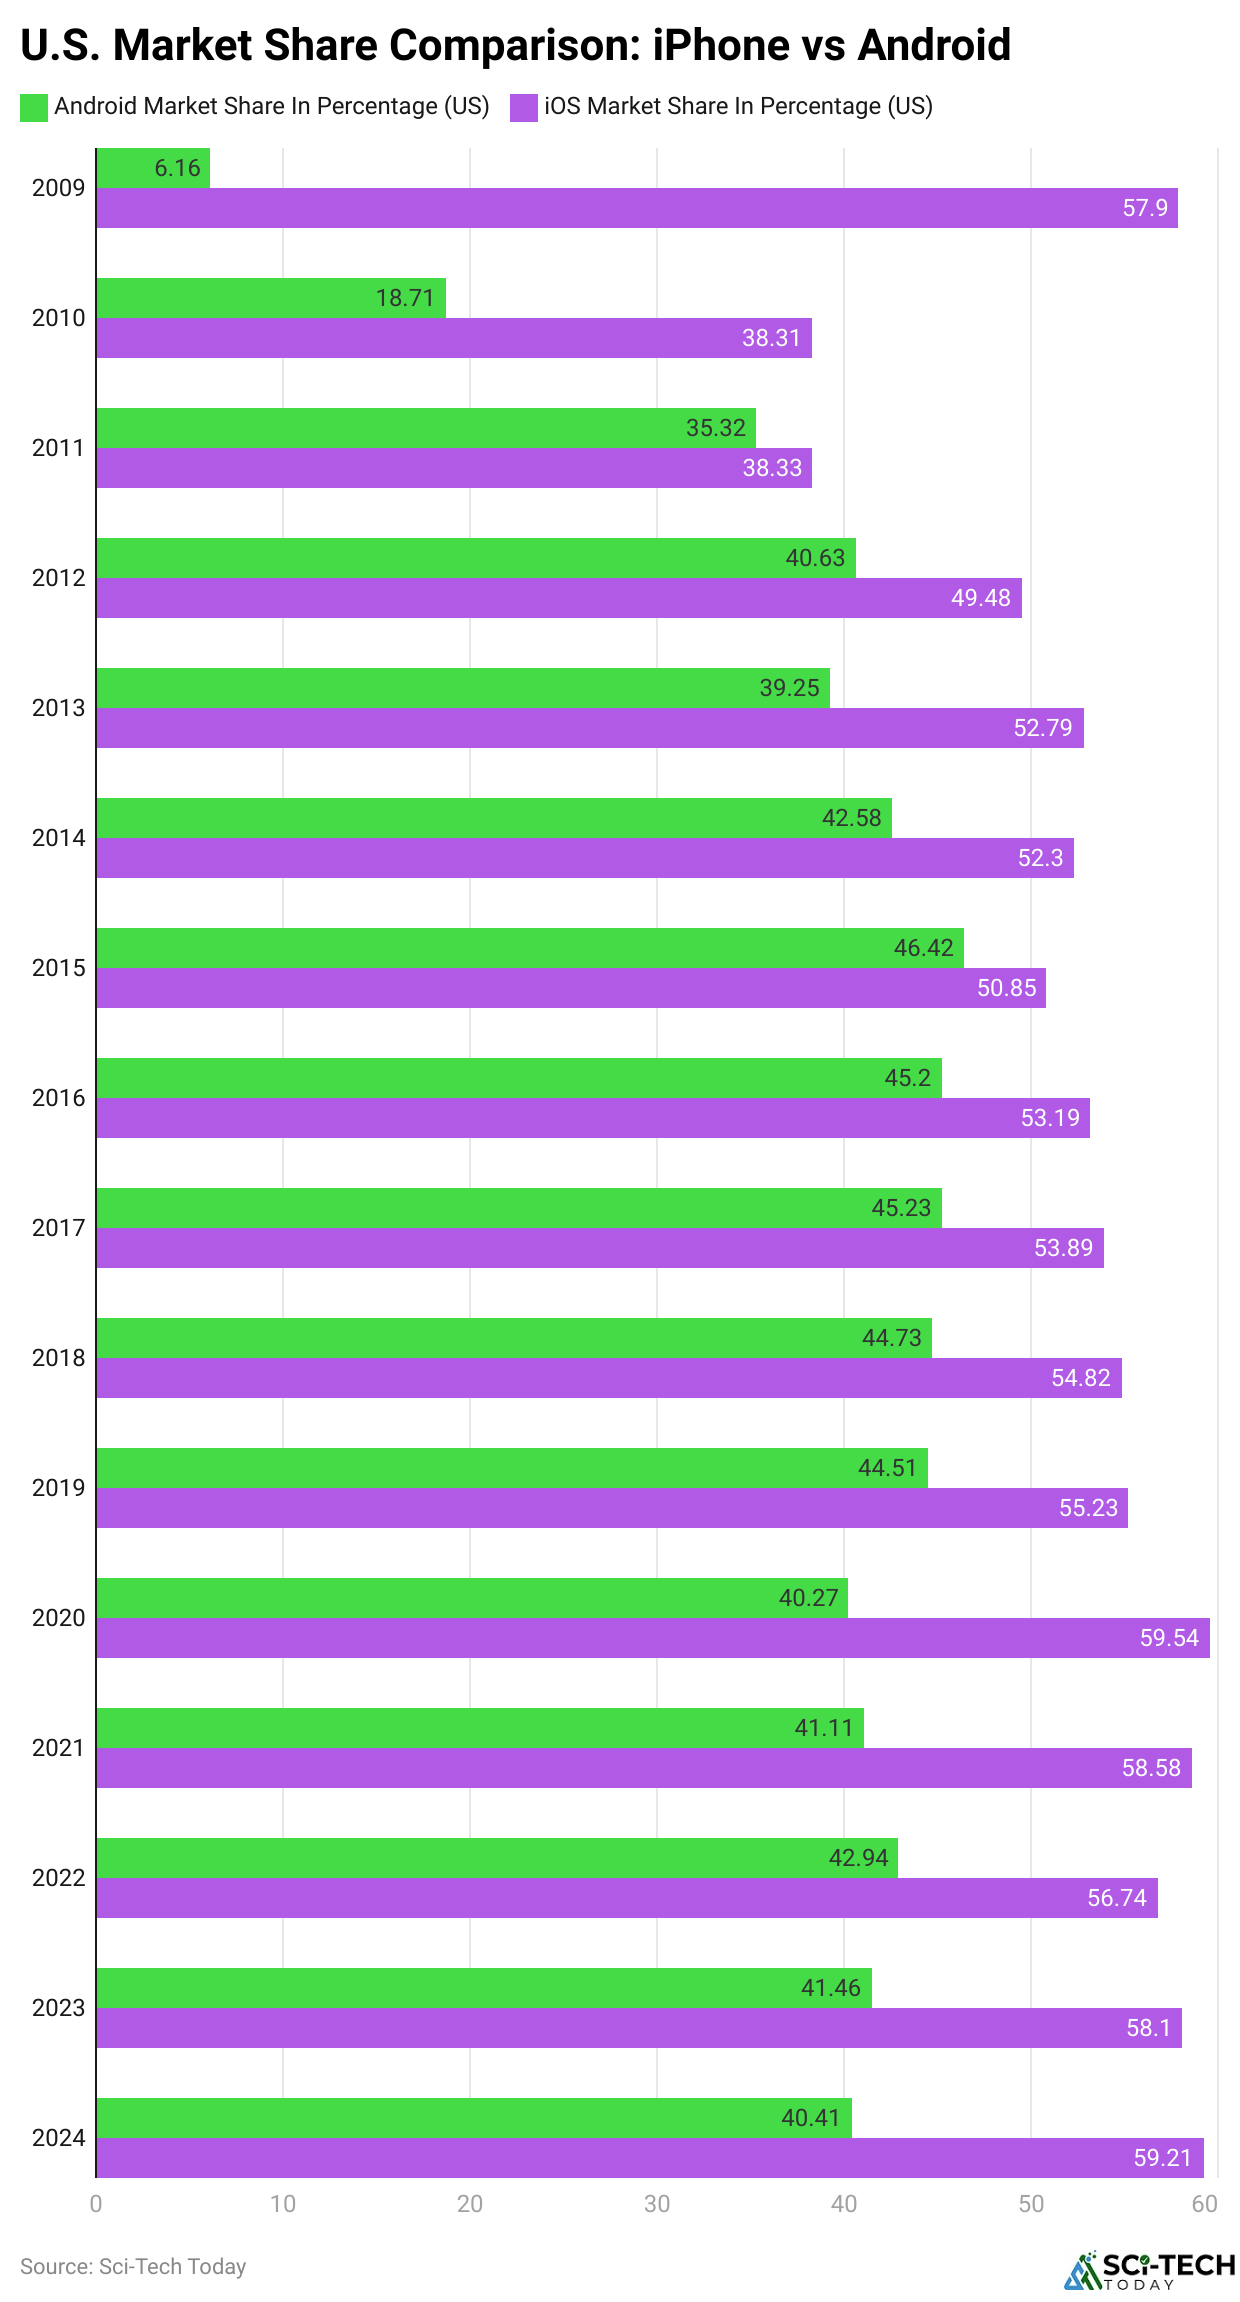
- In the United States (2025), iPhones hold a 59.21% market share.
- In the United States, iPhone’s market share was 57.68% in 2024.
- In Japan, iPhones accounted for 58.85% of the smartphone market.
- In wealthier markets, such as the U.S. and Japan, iPhones hold 60.77% and 58.85% of the market, respectively.
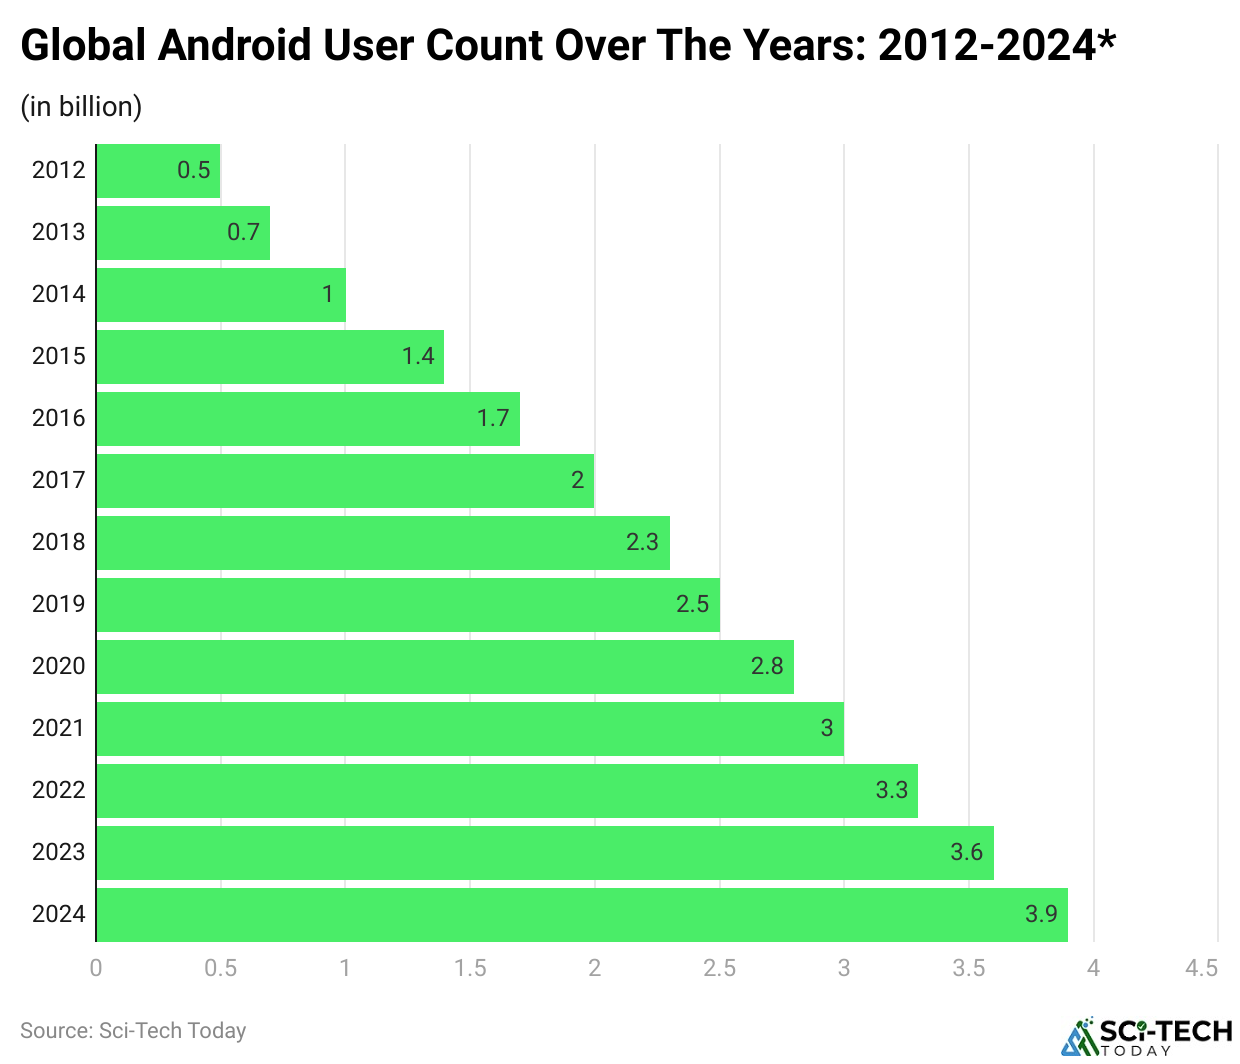
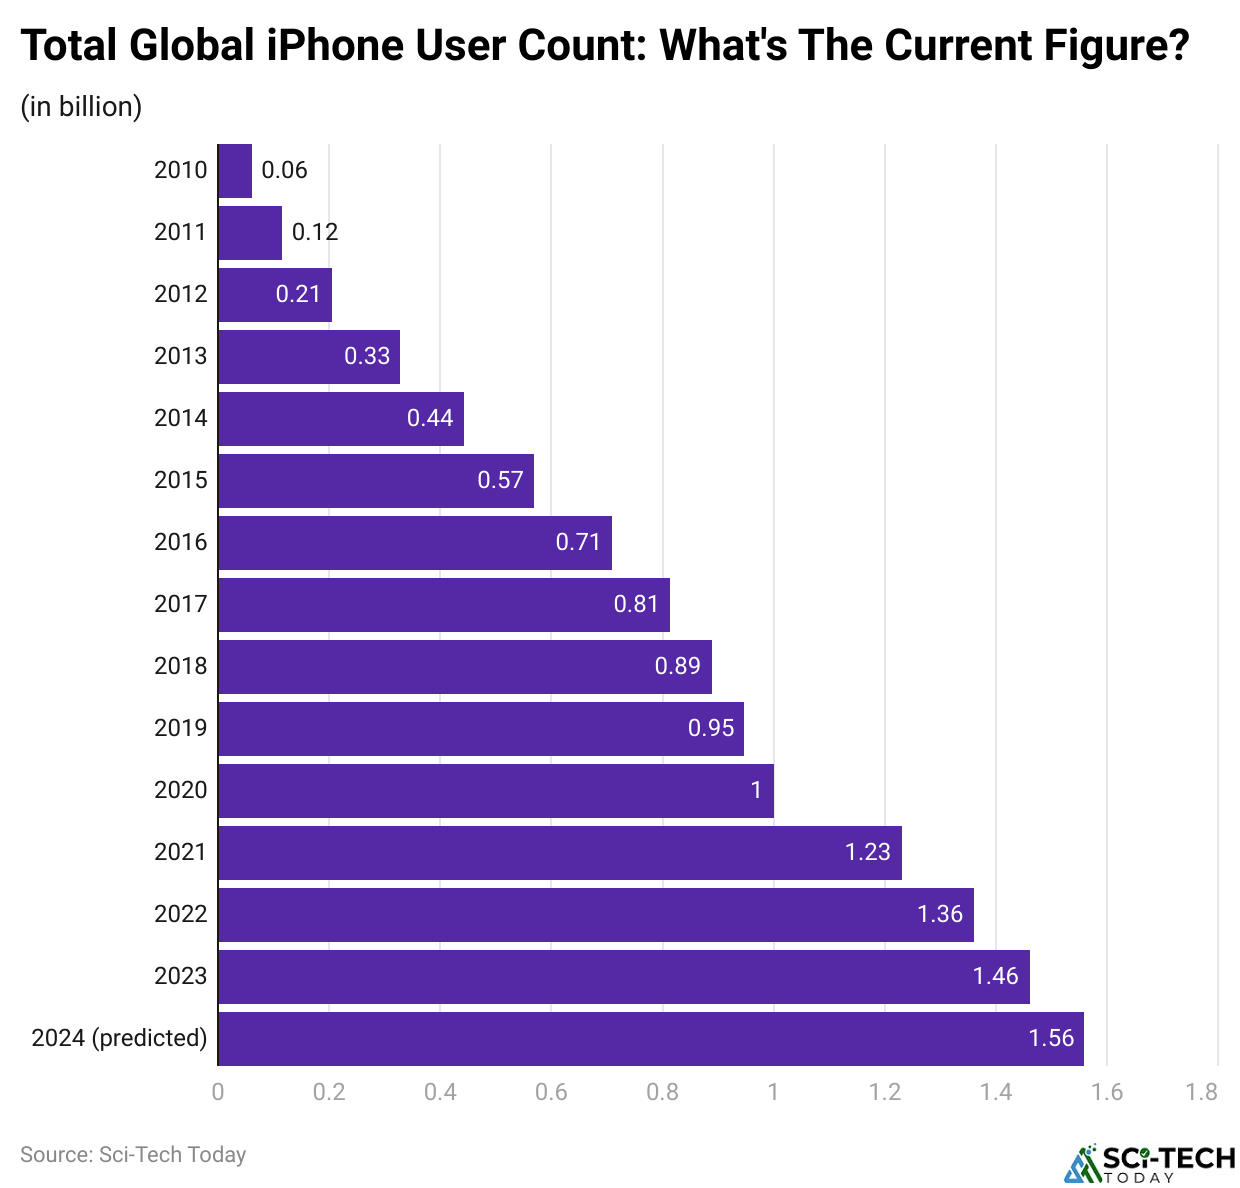
- Globally, more than 3 billion Android phones and over 1 billion iPhones are in use.
- Apple’s iPhone shipments were forecast at approximately 247 million units in 2025, generating more than USD 261 billion in iPhone revenue.
- By the fourth quarter of 2025, Apple’s App Store offered more than 2.5 million apps, while Google Play offers over 5 million apps.
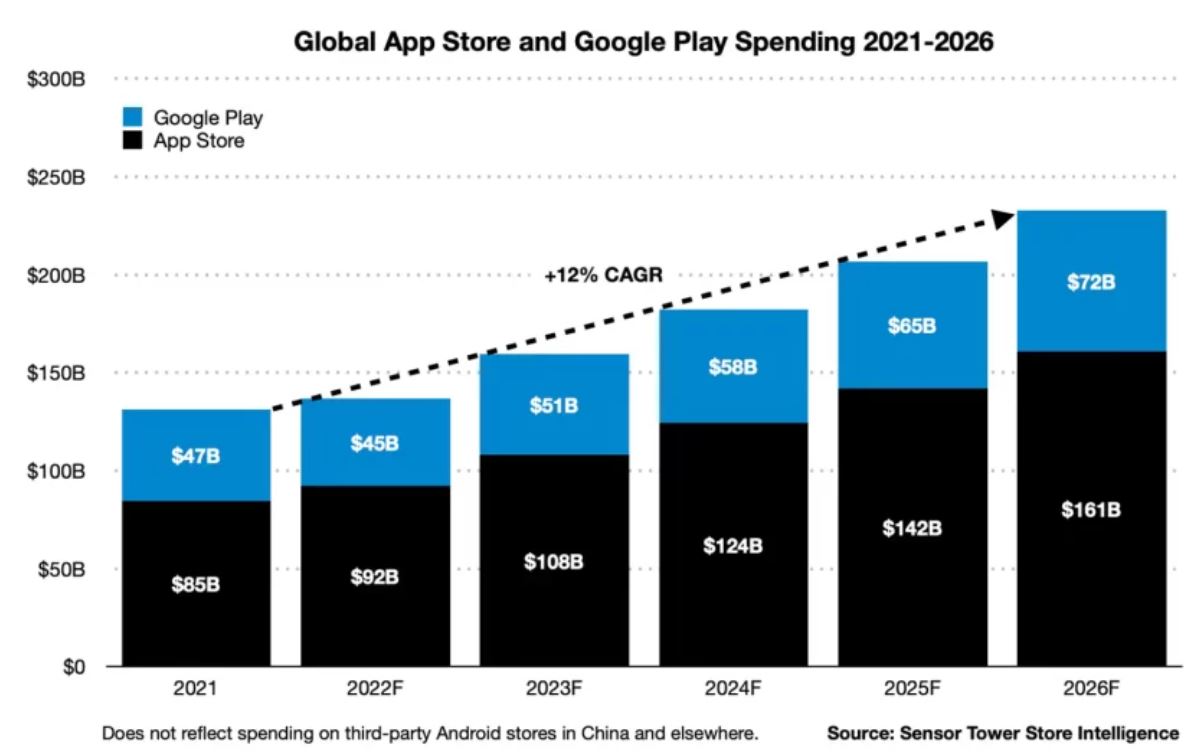
- In 2025, consumer spending on mobile apps was forecast at roughly USD 142 billion through Apple’s App Store and USD 65 billion through Google Play.
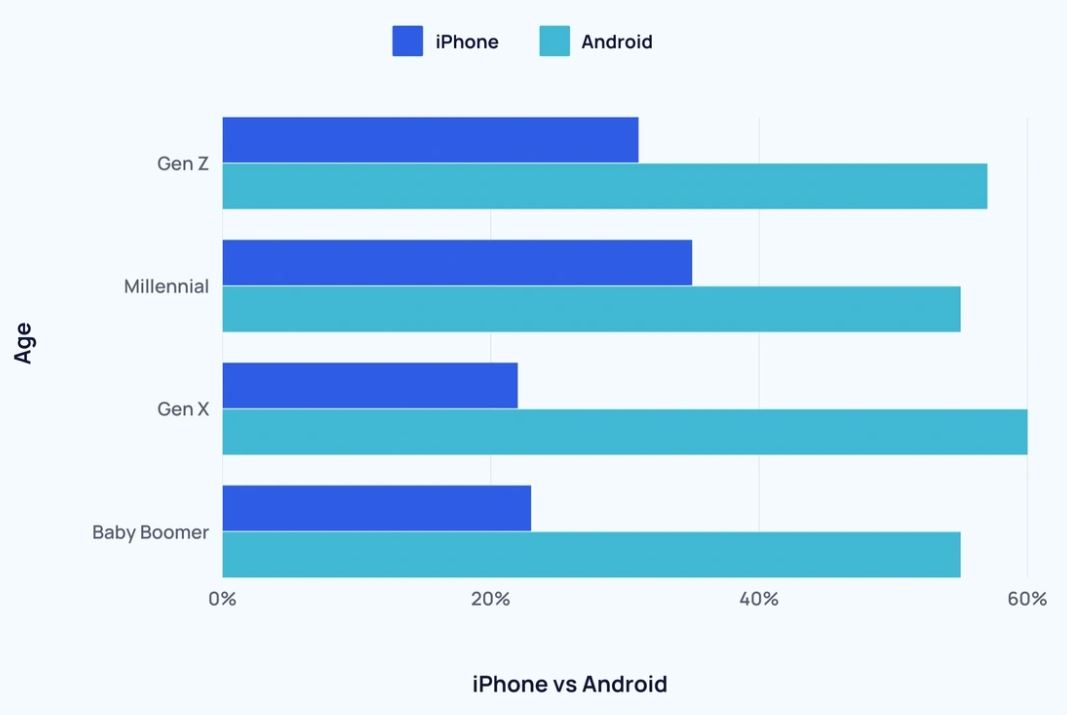
- Millennials account for 35% of iPhone users, while 55% of Android users are also from this generation.
- The iPhone 14 held a 3.9% market share globally as the best-selling smartphone.
- 47% of former Android users stated that the iPhone provides a better user experience.
- 29% of former iPhone users cited affordability as a reason to switch to Android.
- iPhone users have a 43.7% higher average salary than Android users.
- Gen Z and Millennials are more likely to be iPhone users than users from other generations.
General Android vs iOS Statistics
(Reference: blogger.googleusercontent.com)
Android Users Statistics
(Reference: blogger.googleusercontent.com)
- In 2025, Android had an estimated 3.9 billion active users worldwide, while iPhone users numbered roughly 1.5 billion.
- In the United States, iOS accounted for approximately 59% of smartphone sales in Q1 2025, compared with 41% for Android.
- Apple reported approximately 2.5 billion active devices worldwide by late 2025. Public reporting supports more than 1 billion active iPhones, while Android had more than 3 billion active users/devices globally.
- In 2025, the Apple App Store offered more than 2.5 million apps. No directly comparable, verified 2025 Google Play app total was identified.
- Seven of the ten best-selling smartphones globally in 2025 were iPhones, and the iPhone 16 was the year’s best-selling model.
By U.S. Market Share Comparison
(Reference: blogger.googleusercontent.com)
- In Q1 2025, iOS accounted for 55% of U.S. smartphone sales, compared with 45% for Android, meaning most people used iPhones more than other brands.
- In 2015, Android reached its highest U.S. market share of 46.42%, but iPhone still led with 50.58%.
iPhone vs Android Market Share Statistics
(Reference: gs.statcounter.com)
- As of 2025, Android held approximately 72.72% of the global mobile operating-system market, while Apple’s iOS accounted for around 26.92%.
The table below shows that in the United States of America, the mobile operating system market share of iPhone and Android in the past years is:
| Years | Android | iPhone (iOS) |
| 2025 | 72.72% | 26.92% |
| 2023 | 41.46% | 58.10% |
| 2022 | 49.94% | 56.74% |
| 2021 | 41.11% | 58.58% |
| 2020 | 40.27% | 59.54% |
| 2019 | 44.51% | 55.23% |
| 2018 | 22.73% | 54.82% |
| 2017 | 45.23% | 53.89% |
| 2016 | 45.20% | 53.19% |
| 2015 | 46.42% | 50.85% |
| 2014 | 42.58% | 52.30% |
| 2013 | 39.25% | 52.79% |
| 2012 | 40.63% | 49.48% |
| 2011 | 35.32% | 38.33% |
| 2010 | 18.71% | 38.31% |
| 2009 | 6.16% | 57.90% |
By Region-Wise OS Market Share
- As of August 2024, the African region captured the highest mobile operating system market share, with Android (86.26%) and iOS (12.43%).
Furthermore, other region and country-wise OS market shares of iOS and Android at the same time are stated in the table below:
| Geography | Android | iOS |
| Asia | 80.12% | 19.22% |
| Europe | 68.05% | 31.48% |
| North America | 55.53% | 44.17% |
| Oceania | 51.14% | 47.90% |
| South America | 83.43% | 16.30% |
| United States of America | 57.09% | 42.62% |
| United Kingdom | 53.51% | 46.00% |
| India | 95.32% | 4.13% |
| Canada | 58.72% | 40.79% |
| Germany | 69.86% | 29.22% |
iPhone vs Android Users Statistics
- In 2025, Apple was forecast to ship approximately 247.4 million iPhones worldwide and generate more than USD 261 billion in iPhone revenue.
- iPhone users tend to be wealthier, having the average annual income of USD 53,251, while the average income of Android users is just USD 37,040.
- At the same time, iPhone users spend more time on their smartphones, using them on average 4 hours and 54 minutes per day, while Android users spend 3 hours and 42 minutes on their smartphones every day.
- During the same period, Android managed to retain about 89-91% of its users, while iPhones managed to retain 85-88%.
- On the other hand, 47% of former Android users like iPhones better for their performance and 30% move to more affordable Android.
- According to Android vs iOS Statistics, about 18% of iPhone users used to have Android phones, while only 11% of Android users used to have iPhones before.
- About 47% of Android users who changed their smartphone to iPhone think that iPhone is more convenient and better to use.
- Only 30% of iPhone users liked Google’s OS, while 29% moved to Android because it is cheaper.
- Only 11% of Android users considered their new iPhone to be cheaper than their old Android phone.
iPhone vs Android Users by Demographics
- iPhone vs Android Statistics show that young people in the U.S. are more likely to use iPhones, with users aged 18 to 34 accounting for 58% of the share in the United States.
- Meanwhile, Android users captured a share of 41% to date in 2024.
| Age | iPhone | Android |
| 35-54 | 47% | 53% |
| 55 and older | 49% | 51% |
iPhone vs Android Users by Generations
The chart below elaborates ton he iPhone vs Android users by age worldwide:
(Source: cdn.buttercms.com)
- iPhone vs Android Statistics elaborates that globally, Millennials account for the highest share of iPhone users (35%) and Android users (55%).
| Age | iPhone | Android |
| Gen Z | 31% | 57% |
| Baby Boomer | 23% | 55% |
| Gen X | 22% | 60% |
The table below signifies iPhone vs Android users share by gender in 2024:
| Gender | iPhone | Android |
| Female | 31% | 54% |
| Male | 28% | 60% |
iPhone vs Android Apps Statistics
- By the fourth quarter of 2025, Apple’s App Store offered more than 2.5 million apps.
- Android vs iOS Statistics: About 1,200 new apps are added to the Android and iPhone app stores each day.
- Android has more app categories than the iPhone, with 49 categories compared to the iPhone’s 26.
(Source: cdn.buttercms.com)
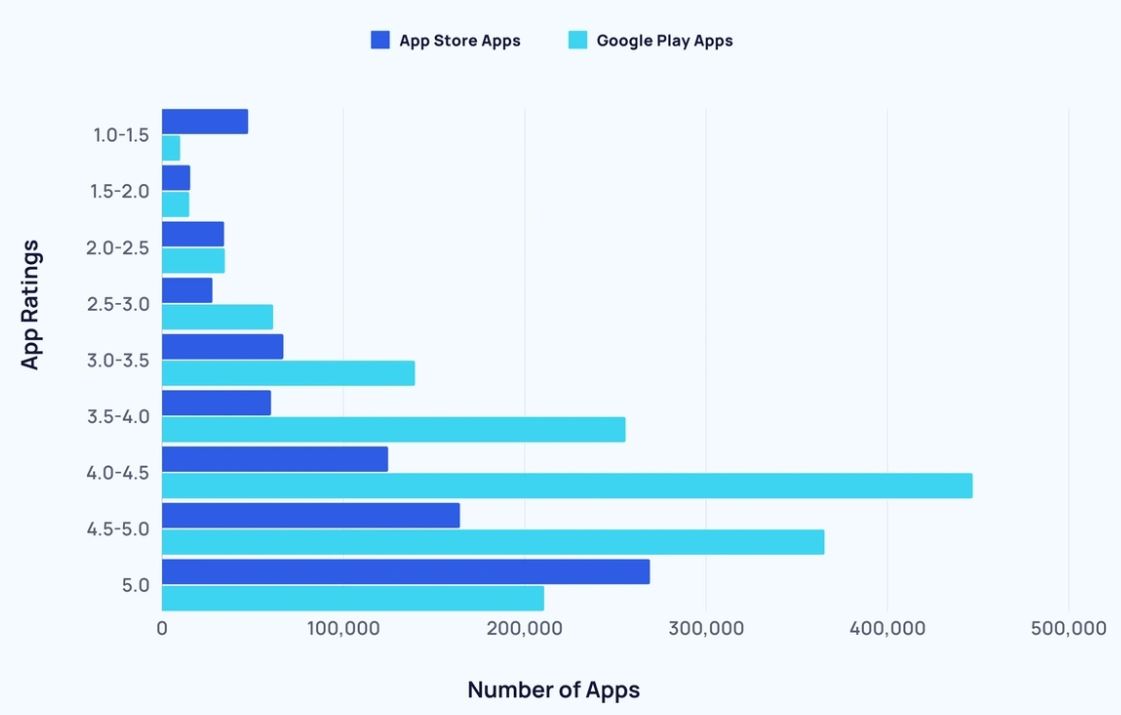
The above graph shows that the number of App Store and Google Play by App Ratings in 2024:
| App Ratings | Google Play Apps | App Store Apps |
| 5 | 210,706 | 269,047 |
| 4.5-5.0 | 365,394 | 164,311 |
| 4.0-4.5 | 447,072 | 124,694 |
| 3.5-4.0 | 255,678 | 60,142 |
| 3.0-3.5 | 139,483 | 66,915 |
| 2.5-3.0 | 61,248 | 27,818 |
| 2.0-2.5 | 34,635 | 34,243 |
| 1.5-2.0 | 15,022 | 15,531 |
| 1.0-1.5 | 10,043 | 47,494 |
iPhone vs Android Apps Spending Statistics
- In 2025, global consumer spending on premium apps, in-app purchases, and subscriptions across Apple’s App Store and Google Play totalled approximately USD 167 billion.
- iOS accounted for roughly 70% of global consumer app spending in 2025, while Google Play/Android contributed approximately 30%.
- On average, iPhone users spend USD 12.77 per app, while Android users spend USD 6.19.
- In-app purchases average USD 1.07 for iPhones compared to USD 0.43 for Android.
(Source: appmysite.com)
A report published on Backlinko represents consumer spending on mobile apps across the Google Play and App Store from 2021 to 2026.
| Year | Google Play (USD billion) | App Store (USD billion) |
| 2021 | 47 | 85 |
| 2022 | 45 | 92 |
| 2023 | 51 | 108 |
| 2024 | 58 | 124 |
| 2025 | 65 | 142 |
| 2026 | 72 | 161 |
Android vs iOS by App Retention Rates
(Source: cdn.buttercms.com)
- In 2025, the average U.S. store-listing conversion rate was 8.56% on Apple’s App Store and 16.15% on Google Play.
- In addition, Apple’s top app category is navigation, with a 104.5% conversion rate, while Android’s best is events, with 84.1%.
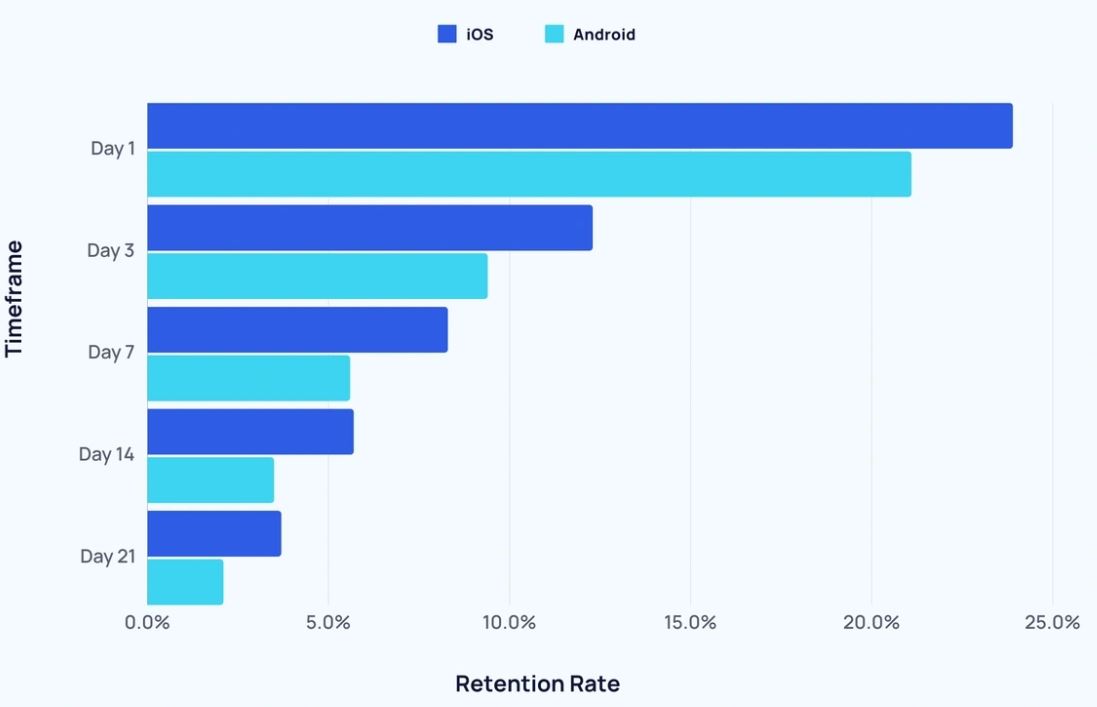
| Timeframe | Android App Retention Rate | iPhone App Retention Rate |
| Day 1 | 21.1% | 23.9% |
| Day 3 | 9.4% | 12.3% |
| Day 7 | 5.6% | 8.3% |
| Day 14 | 3.5% | 5.7% |
| Day 21 | 2.1% | 3.7% |
iPhone vs Android App Revenue Statistics
iPhone App Revenues
- In August 2025, ChatGPT was the highest-grossing iPhone app worldwide on Apple’s App Store, replacing TikTok.
- As of August 2024, TikTok had the highest revenue among all iPhone applications, resulting in USD 208 million.
| iPhone Apps | Revenue (USD) |
| YouTube | 157 million |
| Disney+ | 93 million |
| Tinder Dating App | 81 million |
| Max (formerly HBO Max) | 65 million |
| Tencent Video | 40 million |
| 39 million | |
| Bumble Dating App | 37 million |
| Peacock TV | 35 million |
| 34 million |
Android App Revenue
- iPhone vs Android Statistics also states that the top 3 highest-grossing Android apps by revenue in the same period are Google One (USD 33 million), TikTok (USD 32 million) and Disney+ (USD 31 million).
| Android Apps | Revenue (USD) |
| Max (formerly HBO Max) | 18 million |
| Tinder Dating App | 16 million |
| Spotify | 14 million |
| Crunchyroll | 13 million |
| Amazon Shopping | 11 million |
| Twitch | 10 million |
| Amazon Prime Video | 9 million |
Android vs iOS by Smartphone Sales Share in Countries
- In Q4 2025, iOS accounted for 69% of U.S. smartphone sales, while Android represented 31%.
- Moreover, the US is Apple’s strongest market, with iPhones being the top-selling model in eight out of the top ten.
| Country | Android | iPhone |
| Australia | 48.7% | 50.3% |
| Japan | 51.7% | 47.7% |
| China | 56.8% | 25.3% |
| Great Britain | 54.8% | 45.0% |
| Germany | 63.4% | 36.3% |
| Spain | 76.6% | 22.6% |
| Italy | 70.9% | 28.4% |
| France | 65.6% | 34.3% |
List of Best-Selling Smartphones by Operating Systems Market Share
Year 2024
(Source: appmysite.com)
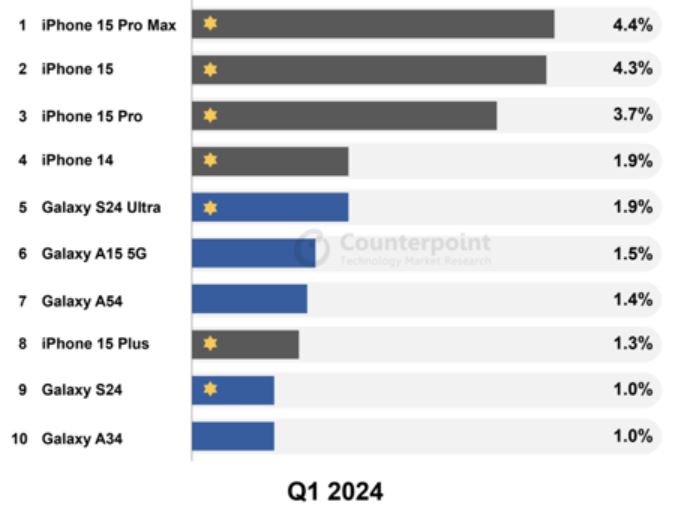
- Android vs iOS Statistics further shows that in the first quarter of 2024, the iPhone 15 Pro Max was the best-selling smartphone, with a market share of 4.4%.
- The iPhone 16 and iPhone 15 Pro captured the second and third highest market share, 4.3% and 3.7%, respectively.
- In addition, other best-selling smartphones at the same time were the iPhone 14 (1.9%), Galaxy S24 Ultra (1.9%), Galaxy A15 5G (1.5%), Galaxy A54 (1.4%), iPhonen15 Plus (1.3%), Galaxy S24 (1.0%), and Galaxy A34 (1.0%).
Year 2025
| iPhone 16 | iOS |
| iPhone 16 Pro Max | iOS |
| iPhone 16 Pro | iOS |
| Samsung Galaxy A16 5G | Android |
| Samsung Galaxy A06 4G | Android |
| iPhone 16e | iOS |
| Samsung Galaxy A16 4G | Android |
| Samsung Galaxy S25 Ultra | Android |
| Xiaomi Redmi 14C 4G | Android |
| iPhone 15 | iOS |
- Across global smartphone sales in 2025, Android remained the dominant operating system: 76% in Q1, 79% in Q2 and Q3, and 72% in Q4. iOS accounted for 19% in Q1, 17% in Q2 and Q3, and 24% in Q4.
Android vs iOS by Android Version Market Share
By Android Version Market Share
(Source: gs.statcounter.com)
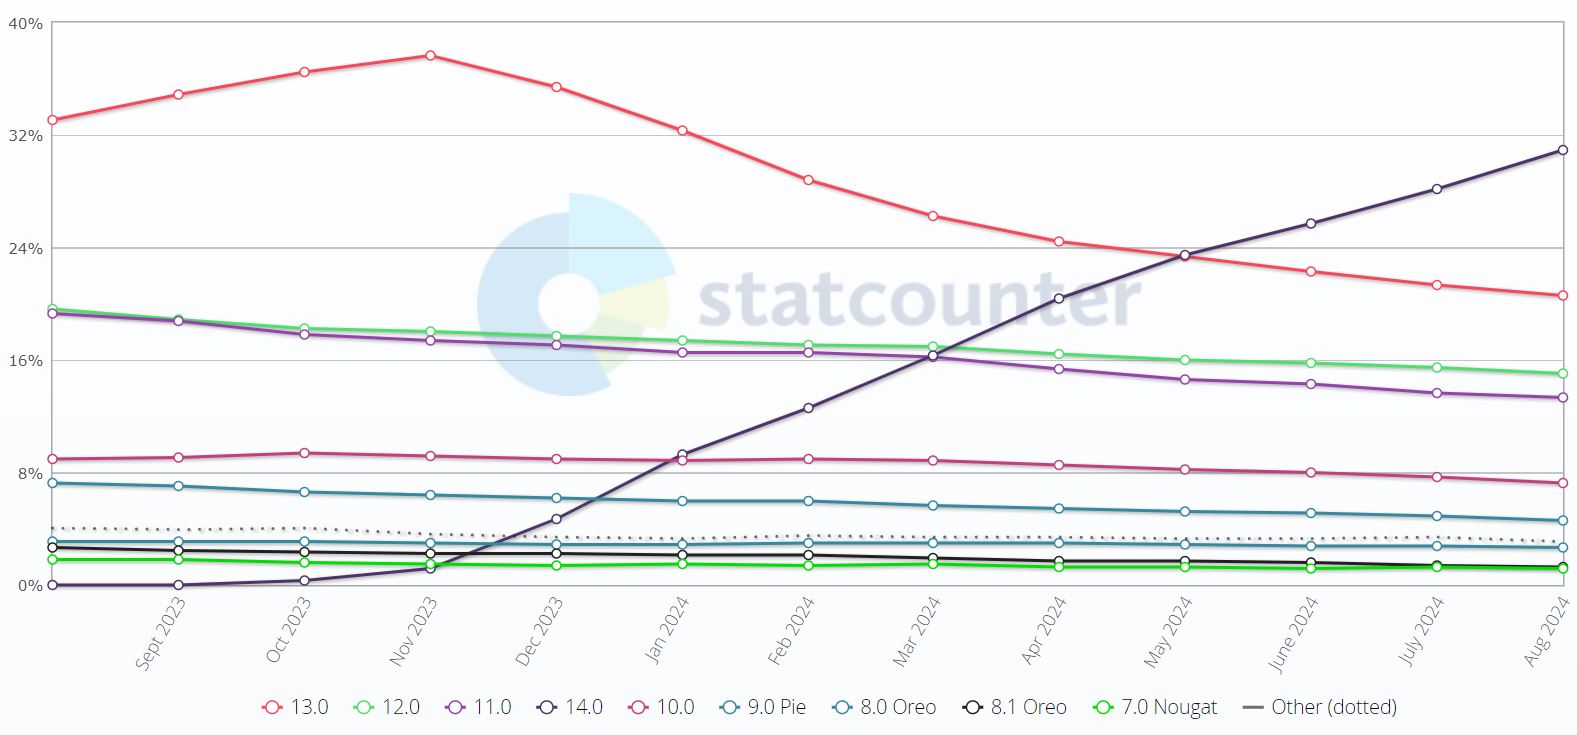
- As of August 2025, Android 15.0 held the largest global Android-version share at approximately 46.9%, followed by Android 14.0 at 18.5% and Android 13.0 at 11.8%.
Furthermore, other Android version’s market share globally is analyzed below:
| 11 | 13.31% |
| 10 | 7.22% |
| 9.0 Pie | 4.36% |
| 8.0 Oreo | 2.65% |
| 8.1 Oreo | 1.32% |
| 7.0 Nougat | 1.21% |
By iOS Version Market Share
(Source: gs.statcounter.com)
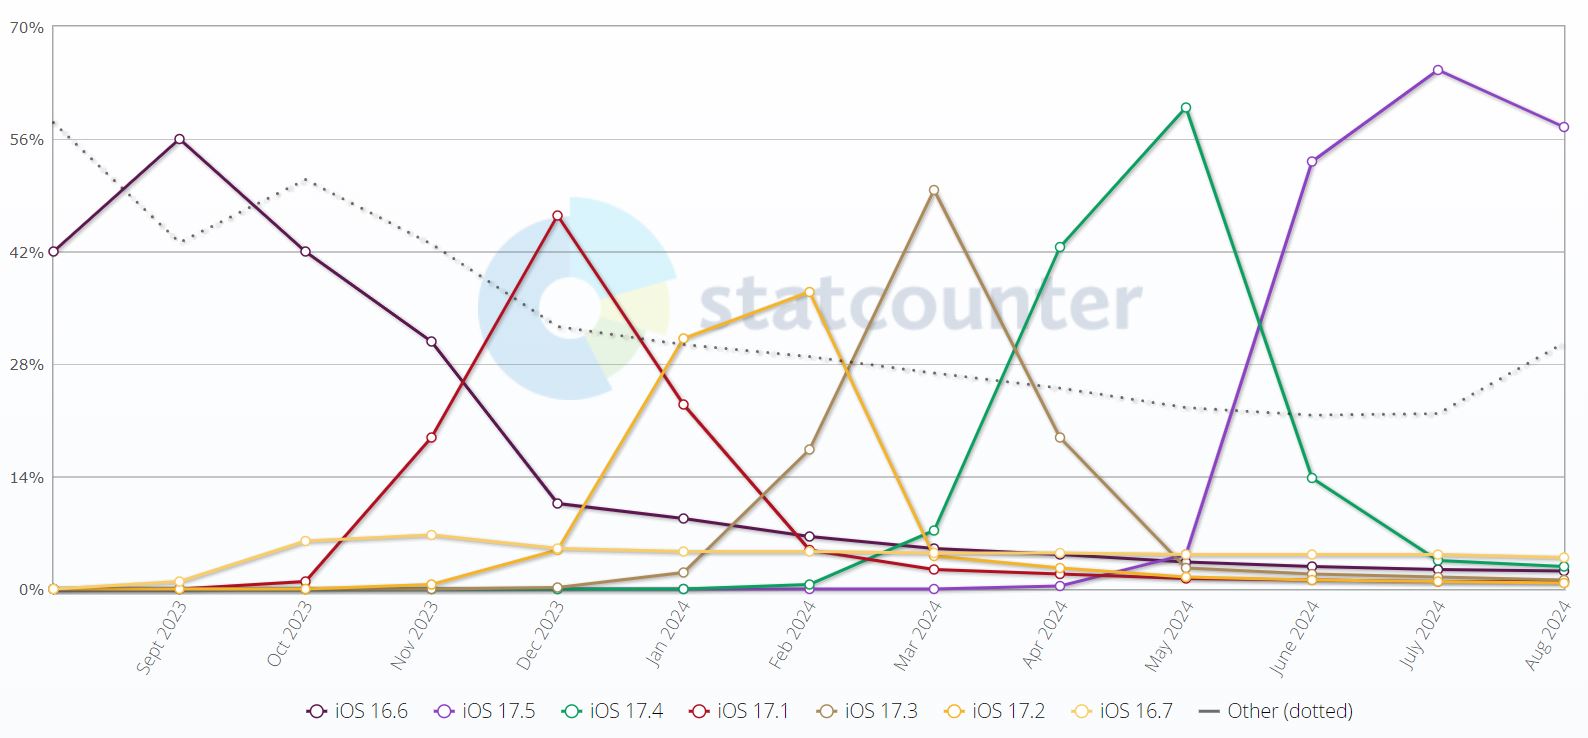
- As of August 2025, iOS 18.6 held the largest worldwide mobile-and-tablet iOS version share at approximately 46%, followed by iOS 18.5 at around 18% and iOS 18.3 at roughly 4%.
- Similarly, the other mobile and tablet iOS versions that had the largest market share worldwide during the same period were iOS 16.6 (2.2%), iOS 17.3 (1.2%), iOS 17.1 (0.88%), and iOS 17.2 (0.81%).
By Mobile Apple iOS Market Share
(Reference: statista.com)
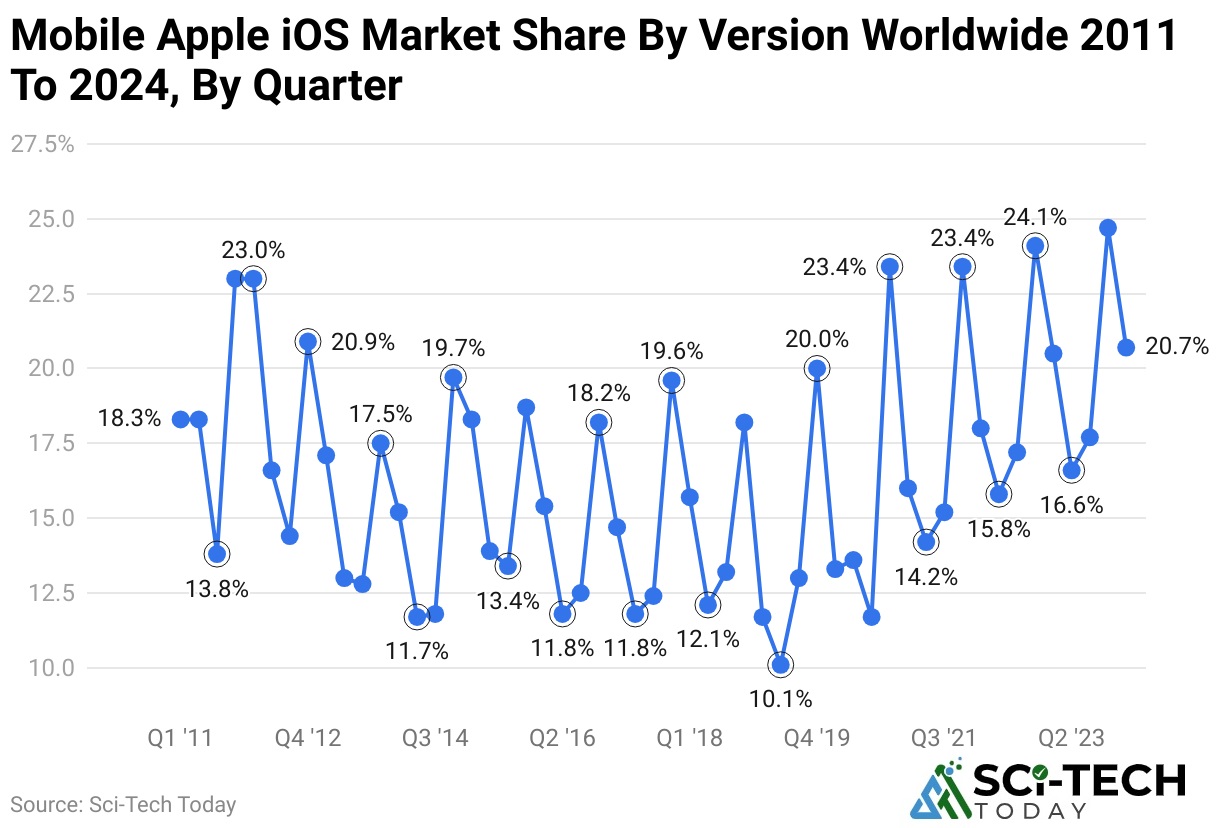
- In the first quarter of 2025, Apple’s iOS mobile operating system held approximately 23% of the global smartphone market share.
- Similarly, in 2023, the mobile Apple iOS market share by version worldwide by quarter was Q1 (20.5%), Q2 (16.6%), Q3 (17.7%) and Q4 (24.7%).
Google Play by Number of Available Apps
(Reference: statista.com)
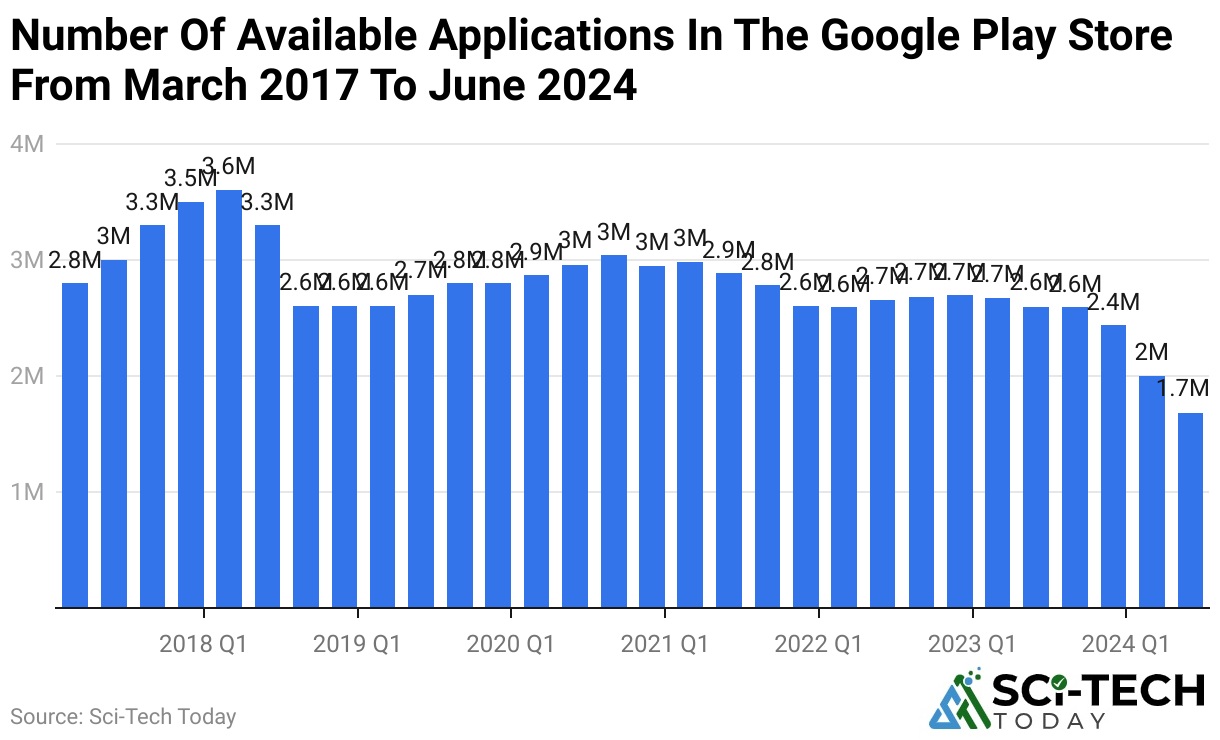
- The graph taken from a Statista report analysis shows that in the first quarter of 2024, the total number of applications available in the Google Play Store was above 2.0 million.
- By September 2025, Google Play had approximately 1.58 million active apps, replacing the previous August 2024 figure of 1.68 million.
Apple App Store by Number of Apps Available
- In 2025, Apple’s App Store had approximately 2.42 million apps and games, including around 304,000 games.
- In 2024, the number of apps on Apple’s App Store stands at 1.81 million, with 472,000 of those categorized as games.
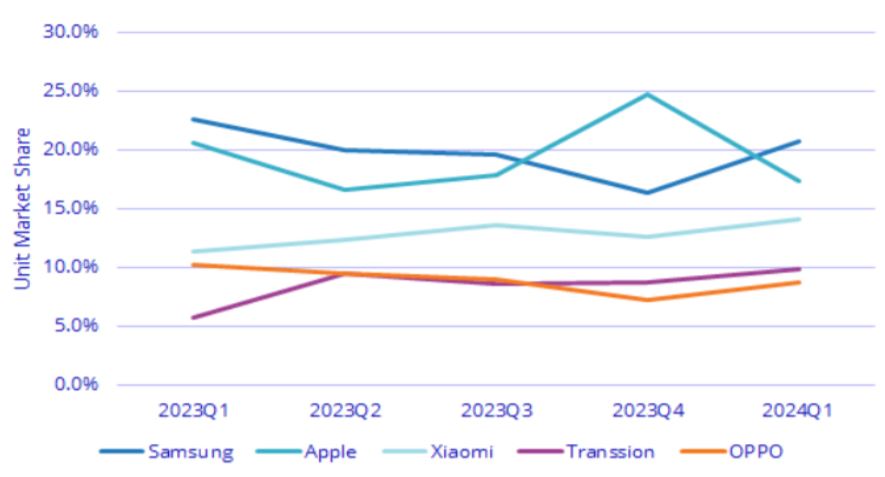
Android vs iOS Devices by Top Five Companies, in Q1 2024
(Source: idc.com)
|
Company | Market Share | Shipments
(in a million units) |
YoY Growth Rate |
|
Total | 100.0% | 289.4 | +7.8% |
| Samsung | 20.8% | 60.1 |
-0.7% |
|
Apple | 17.3% | 50.1 | -9.6% |
| Xiaomi | 14.1% | 40.8 |
+33.8% |
|
Transsion | 9.9% | 28.5 | +84.9% |
| OPPO | 8.7% | 25.2 |
-8.5% |
|
Others | 29.3% | 84.7 |
+7.2% |
Android Vendor Market Share Statistics
(Reference: enterpriseappstoday.com)
- In 2025, Samsung held approximately 19% of global smartphone shipments, making it the leading Android smartphone manufacturer; it ranked second overall behind Apple.
- Xiaomi held around 13% of global smartphone shipments in 2025, maintaining third place worldwide.
- OPPO accounted for approximately 8% of global smartphone shipments in 2025.
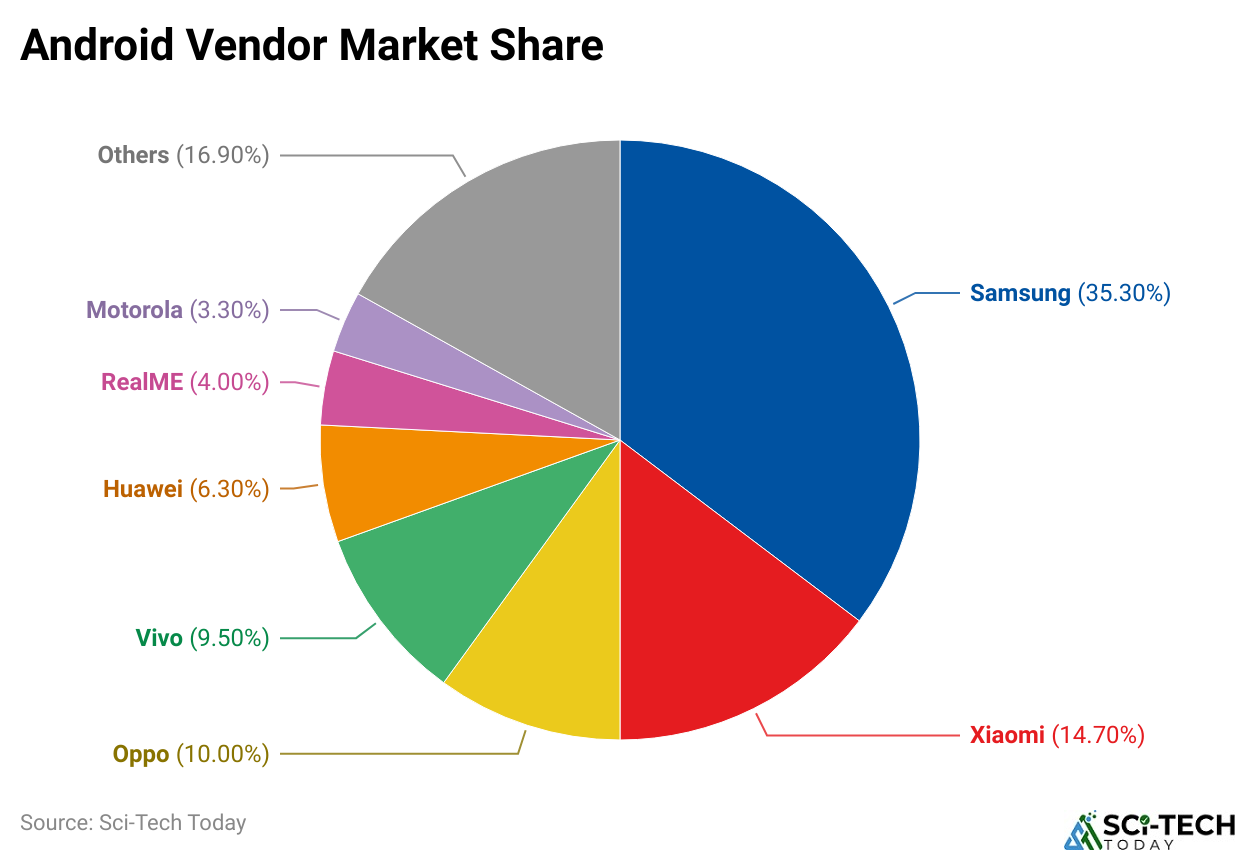
- Furthermore, other Android vendors’ market share is followed by Vivo (9.50%), Huawei (6.30%), RealMe (4%), Motorola (3.30%), and others (16.90%).
Top Apps Ranking by Google Play Store
In the United States (September 13, 2024)
| Store Rank | Application Name |
| 1 | Google One |
| 2 | MONOPOLY GO! |
| 3 | TikTok |
| 4 | Royal Match |
| 5 | Amazon Shopping |
| 6 | Candy Crush Saga |
| 7 | Last War: Survival Game |
| 8 | Peacock TV: Stream TV & Movies |
| 9 | Max: Stream HBO, TV, & Movies |
| 10 | Disney+ |
(Source: similarweb.com)
By Apple App Store
| Store Rank | Application Name |
| 1 | TikTok |
| 2 | TouTube: Watch, Listen, Stream |
| 3 | MONOPOLY GO! |
| 4 | Royal Match |
| 5 | Max: Stream HBO, TV, & Movies |
| 6 | Tinder Dating App: Chat & Date |
| 7 | Audible: Audio Entertainment |
| 8 | Disney+ |
| 9 | Candy Crush Saga |
| 10 | Last War: Survival |
(Source: similarweb.com)
Android vs iOS by Website Traffic Comparison
| android.com | apple.com |
| As of August 2024, the total number of website visits had reached 34.1 million (+5.71%) from last month. | 466 million (+1.24%) |
| Bounce rate: 71.98% | 53.11% |
| In the past three months, the global ranking improved from 2,417 to 2,326. | Changed from 90 to 87 |
| Desktop traffic: Went up by 5.71% | Increased by 1.24% from last month |
Android vs iOS Website Traffic Statistics By Country
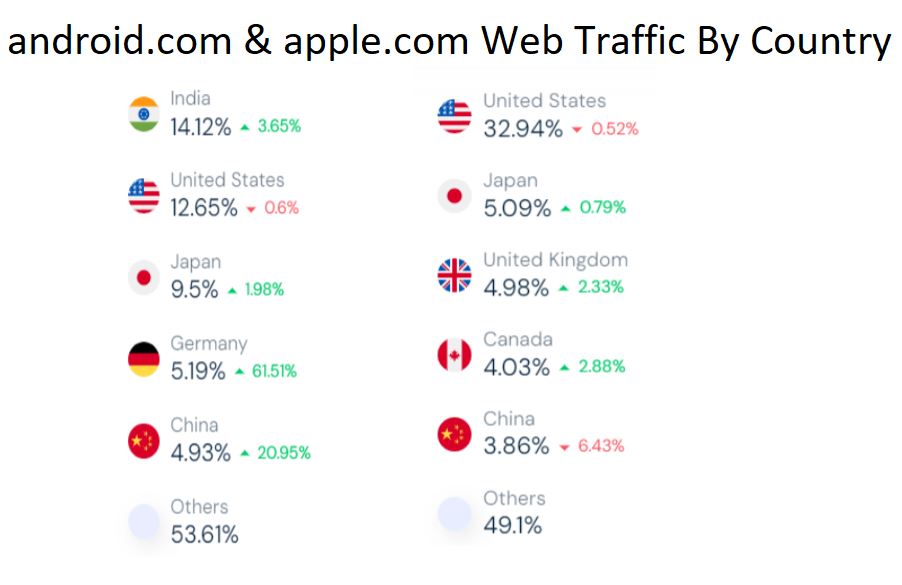
(Reference: similarweb.com)
| android.com | apple.com |
| India: 14.12% (+3.65%) | United States: 32.94% (+0.52%) |
| United States: 12.65% (-0.6%) | Japan: 5.09% (+0.79%) |
| Japan: 9.5% (61.51%) | United Kingdom: 4.98% (+2.33%) |
| China: 4.93% (+20.95%) | Canada: 4.03% (+2.88%) |
| Others: 53.61% | Others: 49.1% |
By Demographics
| Age Group (years) | android.com | apple.com |
| 18-24 | 20.87% | 19.11% |
| 25-34 | 33.70% | 32.07% |
| 35-44 | 21.18% | 20.41% |
| 45-54 | 12.98% | 14.10% |
| 55-64 | 7.09% | 8.89% |
| 65+ | 4.18% | 5.42% |
By Traffic Source
| Marketing Channel Distribution | android.com | apple.com |
| Direct | 32.03% | 42.53% |
| Referrals | 4.65% | 10.31% |
| Organic Search | 60.60% | 42.82% |
| Paid Search | 1.17% | 2.38% |
| Social | 1.01% | 1.41% |
| 0.03% | 0.11% | |
| Display | 0.51% | 0.44% |
By Social Media Referral Statistics
| android.com | apple.com |
| YouTube (66.36%) | YouTube (24.14%) |
| Reddit (21.93%) | Reddit (20.02%) |
| LinkedIn (4.41%) | Twitter (10.47%) |
| Stack Overall (2.02%) | LinkedIn (9.64%) |
| Twitter (1.59%) | Facebook (8.59%) |
| Others (3.69%) | Others (27.13%) |
Most Popular Apple App Store Categories in 2025
- Games take up the top spot at 21.8% of the entire active apps in the App Store due to the popularity of mobile games among users.
- The category called “business” represents 10.2% of the total number of applications in the App Store.
- Apps in the “education” category are represented by 8.9% of the overall content available on the App Store.
- Lifestyle apps account for 8.5% of the total share.
- Utilities apps make up 6.6% of the total share of applications in the App Store.
- Among apps related to entertainment in the App Store, we can find 6.0% of the total number of apps that provide media content such as music and video streaming.
- The category “health & fitness” accounts for 5.4% of the applications and continues growing due to the popularity of health tracking applications.
- The category “photo & video” occupies 4.3% and is still one of the most popular categories of the App Store due to multimedia content.
- The category of shopping apps represents 3.9% of the App Store.
- Social Networking applications make up 2.8% of applications in the App Store.
Most Popular Google App Store Categories Statistics In 2025
- Games: The largest category on Google Play, making up 40% of all downloads.
- Education: This category accounts for 10% of app downloads.
- Business: Business apps make up 9% of the total share.
- Entertainment: Responsible for around 8% of all downloads.
- Lifestyle: Lifestyle apps hold a share of about 7%.
- Tools: Tools account for 6% and are essential for tasks like file management, device optimization, and security.
- Health & Fitness: Health and fitness apps make up 5%.
- Social: Social apps represent 4% of downloads.
- Travel & Local: These apps contribute a share of 4%.
- Finance: Finance-related applications account for 3%.
- Shopping: Representing 3%, shopping apps are frequently used for e-commerce and retail.
Android vs iOS Statistics by Launches in 2025
| Names | Launch Date | Price (USD) | Specification |
| Samsung Galaxy S25 | January 22, 2025 | USD 799 | 6.2-inch 120Hz Dynamic AMOLED 2X display; Snapdragon 8 Elite; 12GB RAM; 50MP main, 12MP ultrawide, and 10MP 3x telephoto cameras; 4,000mAh battery; Android 15. |
| OnePlus 13 | January 10, 2025 | USD 899 | 6.82-inch QHD+ 120Hz LTPO AMOLED display; Snapdragon 8 Elite; 50MP triple rear cameras including a periscope telephoto; 6,000mAh battery; up to 100W wired charging; Android 15. |
| iPhone 16e | February 28, 2025 | USD 599 | 6.1-inch OLED display; A18 chip; 48MP Fusion rear camera; USB-C; Apple Intelligence support; iOS 18. |
| iPhone 17 | September 19, 2025 | USD 799 | 6.3-inch ProMotion display; A19 chip; 48MP main and 48MP ultrawide cameras; 18MP Center Stage front camera; 256GB base storage; iOS 26. |
| iPhone Air | September 19, 2025 | USD 999 | Ultra-thin iPhone model; 6.5-inch ProMotion display; A19 Pro chip; 48MP Fusion rear camera; 18MP Center Stage front camera; iOS 26. |
| iPhone 17 Pro | September 19, 2025 | USD 1,099 | A19 Pro chip; 6.3-inch ProMotion display; Pro camera system; 256GB base storage; iOS 26. |
| iPhone 17 Pro | September 19, 2025 | USD 1,099 | A19 Pro chip; 6.3-inch ProMotion display; Pro camera system; 256GB base storage; iOS 26. |
The End
Both Android and iOS will have their places in the market in 2025 as each of them attracts a certain type of user. The former is better with the variety of phones, from cheap to top-end models, where Samsung and Xiaomi are the major players. The latter ensures a premium experience characterized by great performance, security, and seamless interaction with other Apple products, such as Mac and iPad. Despite having fewer devices compared to Android, iOS has a dedicated community of customers due to the high-quality hardware and software that Apple makes. This is all about Android vs iOS Statistics.
FAQ
Compared to Android, iPhones have major drawbacks including a locked-down operating system with rigid design rules, higher baseline hardware costswithout budget options, less versatile notification management, and restricted file sharing or data management outside the Apple ecosystem.
Yes, the USB-C port and cable used on modern iPhones (iPhone 15 and newer) are the same physical standard used by Android phones. Any standard USB-C cable will physically fit and safely charge both an iPhone and an Android device.
Generally, third-party apps run smoother, look more refined, and receive developer updates faster on the iPhone.

Sources