Introduction
Cell Phones At Workplace Statistics: Let’s be honest, mate, if you were at the office, you probably checked your phone in the last five minutes, didn’t you? Whether it’s for a quick meme, a Slack ping, or just muscle memory, the crazy fact is you’re not alone. In today’s workplace, cell phones are like the extra limb we never asked for but can’t function without.
I like to explain everything about cell phones at the workplace, uncovering how those little devices are shaking up productivity, communication, safety, and even mental focus at work. From data driven from various trusted platforms, on-screen time to shocking stats on distraction and impressive figures on efficiency boosts, I’ve packed it all in.
So, if you’re curious to know how much time workers spend stuck to their screens, and whether it’s helping or hurting, everything will be discussed in this piece of work. Let’s break it down.
Editor’s Choice
- 77% of employees used smartphones for work-related tasks in 2023, and this number is projected to surge to 91% by 2027, making mobile use a workplace standard, not an exception.
- Over 70% of employers in North America believe that personal phone use during work hours reduces employee productivity by at least 5 to 2 hours per day, costing businesses billions annually.
- In a survey of over 1,200 companies, 52% reported implementing official phone usage policies, with an increase to 69% expected by 2026, highlighting growing governance on mobile distractions.
- The enterprise mobility market, which fuels corporate mobile integration, is on track to reach US$180 billion by 2026, driven by remote work, BYOD, and mobile SaaS applications.
- 29% of all workplace accidents in industrial settings are linked to mobile phone distractions, prompting stricter safety policies and hands-free operational mandates in manufacturing and logistics.
- The average employee checks their phone 58 times during a workday, with 30% of those checks occurring during meetings or collaborative tasks, signaling a deep integration of digital habits.
- Cybersecurity threats via mobile phones rose by 56% in 2022, and investments in mobile security are projected to reach US$13 billion by 2027, proving how vital phone security has become in corporate IT.
- 43% of companies are deploying AI-powered mobile monitoring systems to manage productivity, focus, and digital hygiene, indicating a growing dependence on intelligent surveillance technologies.
- M-learning (mobile learning) is gaining momentum, with 58% of corporate training content expected to be consumed on mobile by 2030, reflecting the digital-native learning preferences of Gen Z workers.
- Mobile use among deskless workers, like field sales, drivers, and technicians, has grown from 49% in 2021 to an expected 72% by 2028, replacing outdated paper and desktop-based systems with mobile apps.
| Key Insight Area | Statistic / Projection | Interpretation & Impact |
| Employee Mobile Use | 91% by 2027 |
Phones will be essential to job performance |
|
Productivity Loss |
1.5 to 2 hours/day per employee | Massive productivity drain due to distractions |
| Phone Policy Adoption | 69% of companies by 2026 |
Stricter mobile use governance is incoming |
|
Enterprise Mobility Market |
$180 billion by 2026 | Major investment in mobile-first work environments |
| Workplace Accidents | 29% linked to mobile use |
Phones pose safety risks in operational settings |
|
Phone Checking Habit |
58 times/day per employee | Constant distractions are disrupting the flow |
| Mobile Cybersecurity Investment | $13 billion by 2027 |
Security is a top concern with mobile growth |
|
AI Mobile Monitoring Tools |
43% company adoption by 2026 | AI is being used to track digital productivity |
| M-Learning Adoption | 58% of training via mobile by 2030 |
Education in the workplace goes mobile |
|
Deskless Workforce Mobile Usage |
72% by 2028 |
Physical jobs become tech-augmented via phones |
Historical Growth and Prevalence of Cell-Phone Use in the Workplace
 (Source: electroiq.com)
- In 2023, nearly 66% of U.S. employees admitted to using personal cell phones several times daily at work, showing a sharp rise from around 55% in 2020, indicating a 20% relative growth in habitual use.
- Roughly 56 minutes per working day on average is spent by employees on non-work-related phone activity, which accumulates to nearly two full workweeks per year per person in lost time. That’s about 8 hours weekly, or 416 hours annually, of personal browsing during office hours.
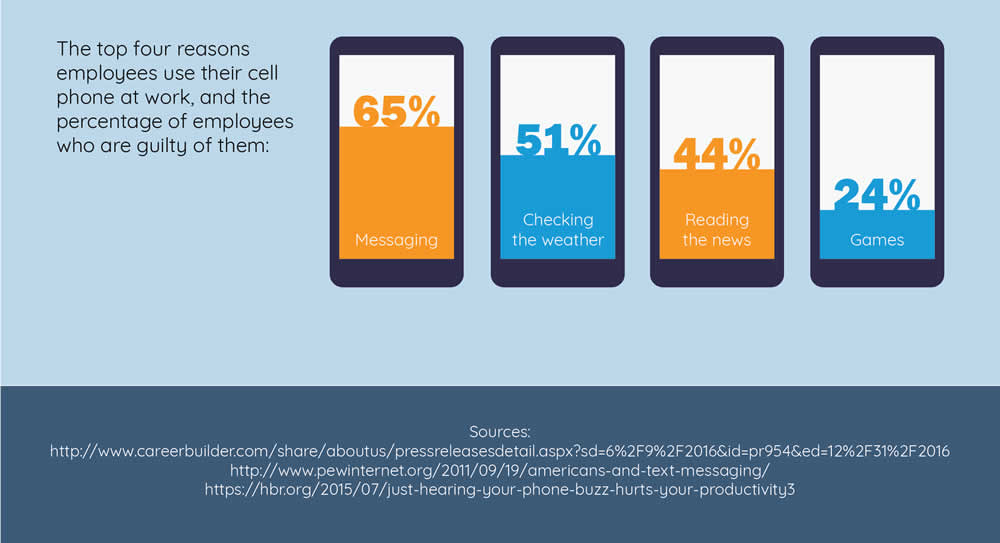
- Approximately 58% of employees report regularly engaging in personal phone activity during work hours, such as text messaging, social media, or news reading, leaving just 42% who strictly limit usage to work tasks.
- Average daily phone use at work totals about 2.5 hours, combining both personal and work usage phases, amounting to nearly 12.5% to 15% of an 8-hour shift.
- Over a five-day work week, that’s 12.5 hours per employee, or 50 hours monthly, directed at the handheld screen.
- Around 69% of global employees are “constantly using cell phones during working hours”, including checking work apps, messaging, task coordination, and personal tasks, implying that only 31% remain mostly phone-free at work. In fast-paced workplaces, this nearly universal use shows deep reliance on mobile connectivity.
- In 2023, roughly 84% of businesses had a formal or informal BYOD (Bring Your Device) policy, up from about 70% in 2020, implying an increase of over 20% in corporate acceptance of personal devices.
- On average, each BYOD employee uses 1.7 devices for work, smartphone plus often a tablet or laptop, resulting in 2.5 devices total per person, and companies estimate savings of $341 per employee annually versus company-issued devices.
- Productivity benefits are notable: 68% of organizations report productivity gains from BYOD, with studies showing mobile device use can boost efficiency by up to 34 to 55%, translating into roughly one hour saved per workday, or 240 hours per year. That’s nearly 30 extra days of productive output annually per employee.
- Cell-phone distractions reduce productivity by as much as 14 to 40%, depending on job role; in numerical terms, if a worker produces 100 units in distraction-free conditions, that output drops to 60 to 86 units when constantly phone-interrupted.
- Frequent checking, every 10 minutes by 36% of employees, leads to cognitive disruption and error introduction.
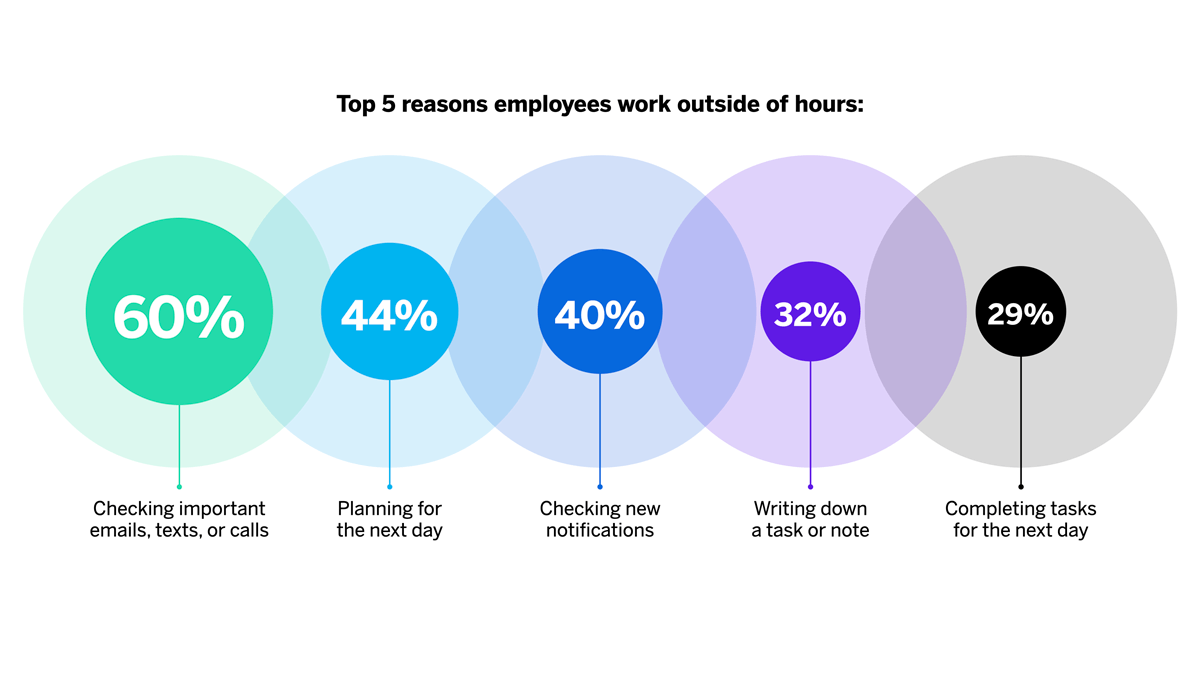
- Daily average: 54% of employees check their phone at least once an hour, 36% every 10 minutes, and 71% feel pressure to be reachable outside office hours via personal phones, leading many to essentially work beyond scheduled hours, sometimes unpaid.
- That extended availability adds up: checking 9 to 10 times per hour over 9 hours means 70 to 90 interruptions per day.
| Metric/Year | Value or % | Implication |
| U.S. employees using phones several times/day | 66% (2023) | Up from 55% in 2020, rising habitual use |
| Non-work use per day | 56 min/day, 8 hrs/week, 416 hours/year | Significant lost time |
| Total phone usage at work | 2.5 hours/day | 12.5 hours/week, 50 hours/month |
| Fraction of employees “constant use.” | 69% | Most use their phones continuously |
| Companies with BYOD policies | 84% (2023) | Widespread acceptance of personal devices |
| Devices used/work employee | 1.7 smartphones + 2.5 total | Multi-device reliance, cost savings evident |
| Productivity loss via distraction | 14 to 40% drop | Errors, reduced output under phone distraction |
| Check frequency & reachability pressure | 54% hourly, 36% every 10 min, 71% outside hours. | High interruptive demands and boundary blur |
| Productivity increases from BYOD | 34 to 55% | One extra hour/day or 240 hours/year |
Usage Patterns and Distraction Effects of Cell Phones at Work
 (Reference: dataquest.io)
- 66% of U.S. employees report using their cell phones several times a day at work, up from roughly 55% just a few years prior, a roughly 20% relative increase in habitual workplace phone checking.
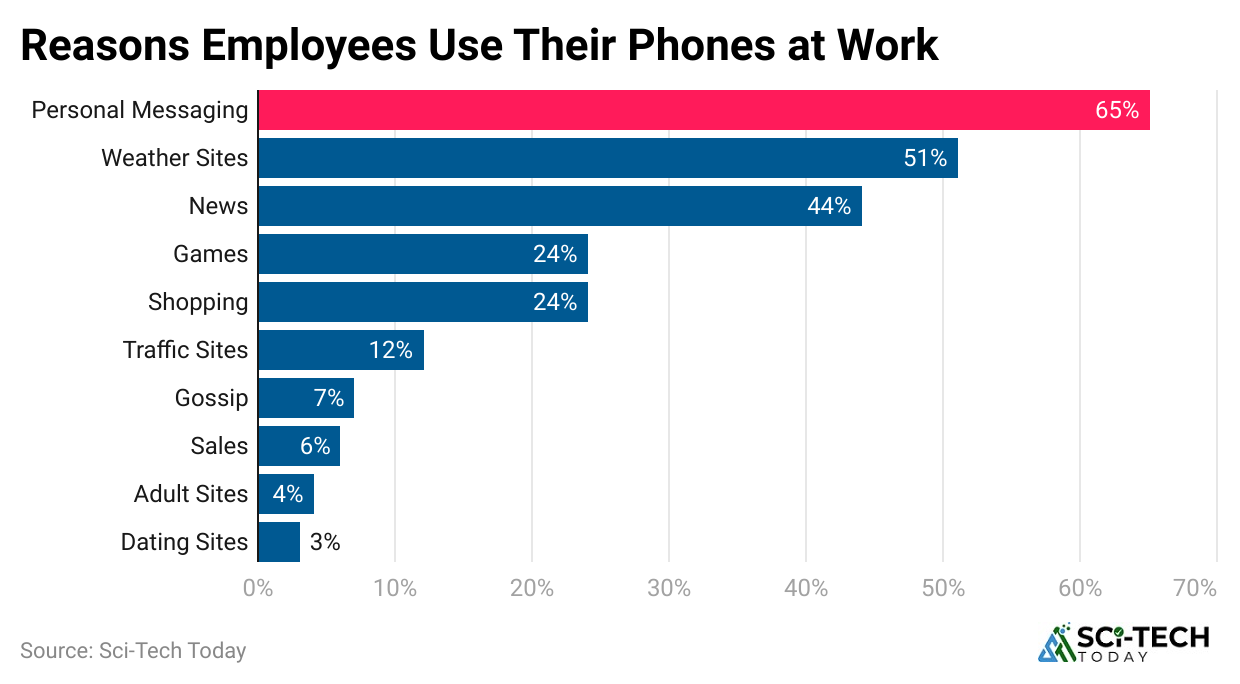
- 55% say personal messaging (text or chat apps) is their top reason for workplace phone use, while 28% check social media, and 30% browse personal email, showing diversified non-work usage slices.
- Employees spend an average of 56 minutes per workday on non-work phone activities, adding up to about 8 hours per week or 416 hours annually, nearly one full work month per person.
- Total daily phone use averages 2.5 hours, mixing personal and job-related tasks; that’s about 12.5 hours per week and roughly 50 hours per month logged on the device.
- 69% of employees admit to constant cell-phone usage during working hours, meaning almost 7 out of 10 people have their phone active in some way throughout the shift.
- 87% of employers say cell phones distract employee efficiency, while 48% of employees acknowledge that having phones blurs their work-life boundaries, exhibiting acknowledgement on both sides of the gap.
- 40% of employees admit to using phones for personal chatting with colleagues during work hours, and 31% use phones for personal tasks in meetings, undermining meeting engagement and team cohesion.
- Employees check smartphones around 150 times per day, which is approximately every 6 waking minutes, leading to 720 lost work hours annually per person due to distraction cycles and refocusing delays.
- 92% of employees say loss of focus is a problem, with 80% unable to go a full hour without distraction, and 11% distracted at least every five minutes, meaning serious fragmentation of attention spans.
- After each distraction, it takes an average of 23 minutes to resume the original task, and 23% of interrupted tasks are not resumed that same day, greatly reducing deep work and concentration efficiency.
| Metric | Value | Effect or Insight |
| Employees using phones several times/day | 66% | Up from 55% to rising habitual checking |
| Primary non-work uses | 55% messaging, 28% social media, 30% email | Diverse personal tasks crowd schedules |
| Daily non-work phone time | 56 min/day 8 hr/week 416 hr/year | Major lost hours per employee |
| Total daily phone use | 2.5 hrs/day 12.5 hrs/week | Work + personal combined |
| Constant usage rate | 69% of employees | Very common continuous usage |
| Employer concern | 87% see disruption | Organizational recognition of the issue |
| Workplace personal chatting | 40% employees | Detracts from formal communication |
| Phone check frequency | 150 checks/day (every 6 min) | High interruption rate |
| Difficulty focusing | 92% acknowledge loss; 80% distract hourly | Poor sustained attention |
| Recovery time per interruption | 23 min; 23% tasks not resumed the same day | Deep work severely impacted |
Distraction, Focus Loss, and Recovery Time
 (Source: frontiersin.org)
- Interruptions average 60 per 8-hour shift, meaning a worker faces about 7.5 interruptions per hour, most often from phones or notifications, allowing barely 8 minutes per continuous work chunk.
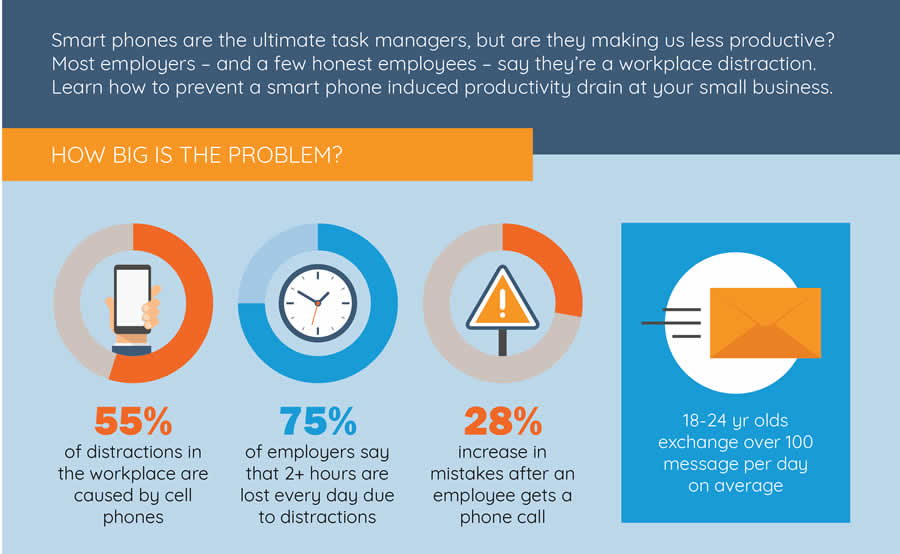
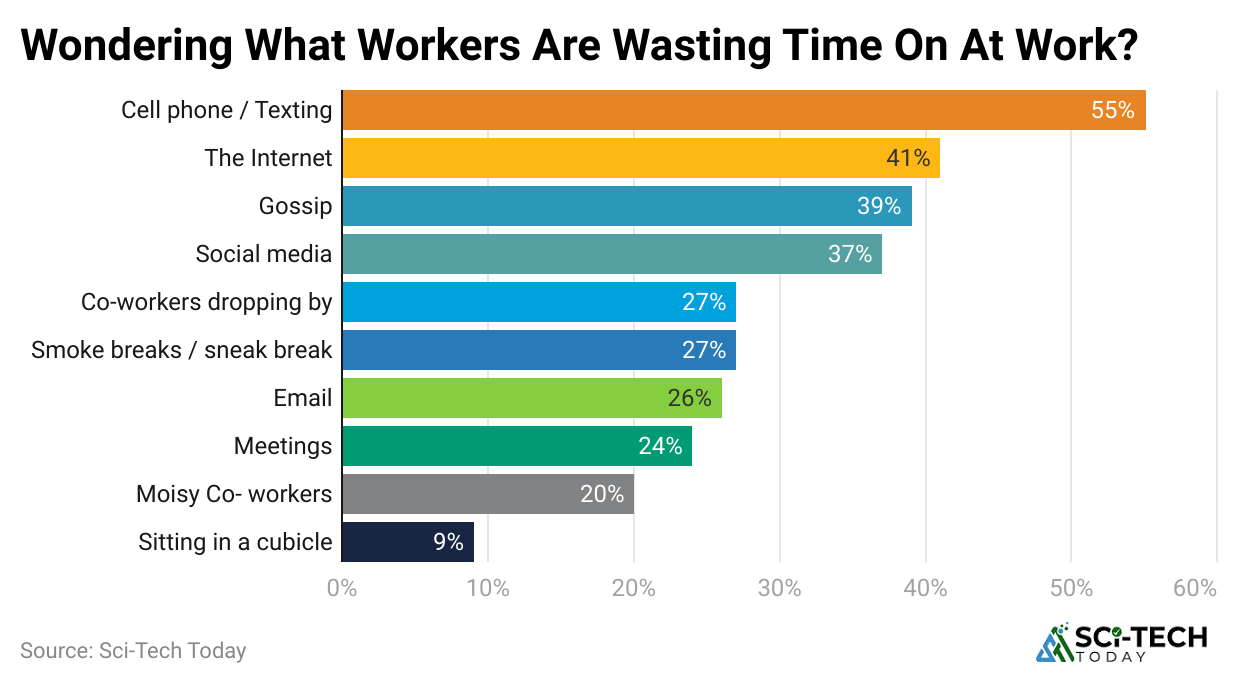
- 79% of employees report workplace distractions, with cell phones being the second most common source at about 50% of all reported distractions, trailing only chatty coworkers at 80%.
- Each phone-related interruption costs an average of 23 minutes and 15 seconds for the employee to regain full focus, adding up to nearly 2.6 hours of lost deep work per day when multiplied by 6 to 7 interruptions.
- About 98% of the workforce faces at least 3 to 4 interruptions daily, and 60 interruptions over an 8-hour day translates to 720 lost work hours per employee annually.
- 23% of interrupted tasks are never resumed the same day, which, when applied to daily interruption counts, means an average employee leaves 1 to 2 tasks unfinished each workday, leading to backlog buildup.
- Distracted employees make twice as many errors; with phone-induced distraction comprising half of such incidents, error rates spike by up to 100%, with safety events affecting 14% of respondents.
- Distraction-induced morale dips: 34% report liking their job less when distracted, 54% admit their performance slips, and 50% see meaningful productivity decline, all traced partly to phone interruptions.
- Organizations lose an estimated US $650 billion annually to distractions, stemming from lost hours (720 hours per worker) plus error-correction and low morale in an American workforce of 160 million.
- Training help: 75% of staff become measurably more productive after distraction-reduction training, showing that structured guidance can reclaim time otherwise lost to phone-initiated multitasking.
- Cognitive switching costs bite hard: after a quick phone glance or notification, employees take nearly 23 minutes to re-engage, and cognitive residuals can linger as low-grade brain drain even if they’re not actively using the device.
| Metric | Value/Impact |
| Interruptions per workday | 60 per 8 hr shift (7.5/hr) |
| Workforce distraction prevalence | 79% affected; phones cause 50% of all disruptions |
| Focus recovery time per interruption | 23 min 15 s |
| Annual lost hours per employee | 720 hours |
| Percentage of tasks never resumed | 23% interrupted tasks are lost/day |
| Error rate increases from distraction | Up to 2× more errors |
| Job sentiment declines when distracted | 34% like their job less |
| Aggregate economic losses | Approximately US $650 billion/year |
| Training effectiveness | 75% of trained workers are more productive |
| Cognitive drain beyond active multitasking | Prolonged focus impairment, “brain drain” effect |
BYOD Adoption and Its Productivity and Security Impacts
 (Reference: 99companys.com)
- By 2025, 95% of organizations will allow personal devices in some work capacity, up sharply from 51% in 2023, reflecting a broad shift toward employee-led tech workflows. This means only 5% of companies still enforce exclusive company-device use.
- 82% of companies operate formal or informal BYOD frameworks, indicating nearly nine out of ten businesses accommodate personal-device work even if not officially structured. That contrasts with just 53% in 2023, showing rapid policy normalization.
- 68% of organizations report higher productivity post-BYOD, correlating to mobile-enabled access saving employees nearly 58 minutes per day (1 hr) and yielding a 34% average efficiency gain. Translated: in a 5‑day week, staff reclaim 5 hrs of productive time.
- Employee satisfaction improves: 53% of companies see better morale post-BYOD, with 56% of staff reporting greater work-life balance and flexibility using their own phones. That positive trend is driving broader support for employee autonomy.
- Cost savings average $341 per employee each year when shifting from corporate‑issued devices ($1,234/yr) to BYOD ($893/yr), yielding 28% lower mobile-management cost. For a 1,000-employee company, that’s about US $341k saved annually.
- On average, employees use 2.5 devices (smartphone, tablet, laptop) for work, with BYOD accounting for smartphone usage in the majority of cases, making personal mobile devices central to task flow. Companies save both procurement and device-support costs.
- Yet only 40% of BYOD companies deploy mobile-device‑management (MDM) tools, compared to 90% of companies issuing devices, leading to 48% reporting malware or data breaches from unmanaged personal phones. That exposes nearly half the workforce to unmanaged security risk.
- In companies without a formal BYOD policy (78%), employees still engage in unauthorized personal-device work, meaning 4 of every 5 staff use personal devices anyway, often without security safeguards. This disconnect creates compliance blind spots and liability.
- Despite cost savings, companies issuing devices fare better: 53% report ≥5% revenue growth over 3 years, compared to 45% for BYOD companies, suggesting more managed programs may outperform BYOD-only strategies.
- Similarly, turnover under 10% is higher in device-issue companies (51%) than in BYOD companies (37%).
- The global BYOD market reached US $98.8 billion in 2024, projected to hit US $157.3 billion by 2026, a 15% compound annual growth rate reflecting surging mobile-device reliance across industries. That represents robust long‑term investment trends.
| Metric and Year | Data Value | Implication |
| Orgs allowing BYOD (2025) | 95% | Nearly universal acceptance |
| Companies with a formal BYOD policy | 82% | Most have some structure around personal devices |
| Productivity gain via BYOD | 34%, 58 min/day saved | Major efficiency improvement |
| Job satisfaction uplift | 53% companies benefit | Flexibility drives morale |
| Annual cost savings/employee | $341 | 28% cheaper than corporate devices |
| Devices used per worker | 2.5 | Smartphones are central BYOD tools |
| BYOD companies using MDM | 40% | Low security coverage, high breach risk |
| Unauthorized BYOD usage rate | 78% in non‑policy companies | Happens regardless of rules |
| Growth advantages (device issue) | 53% ≥5% growth vs 45% | Managed issuance may yield stronger results |
| BYOD market size 2024/2026 | $98.8B -$157.3B (15% CAGR) | Long-term mobile-device expansion |
Industry Specific Phone Usage Patterns
 (Source: electroiq.com)
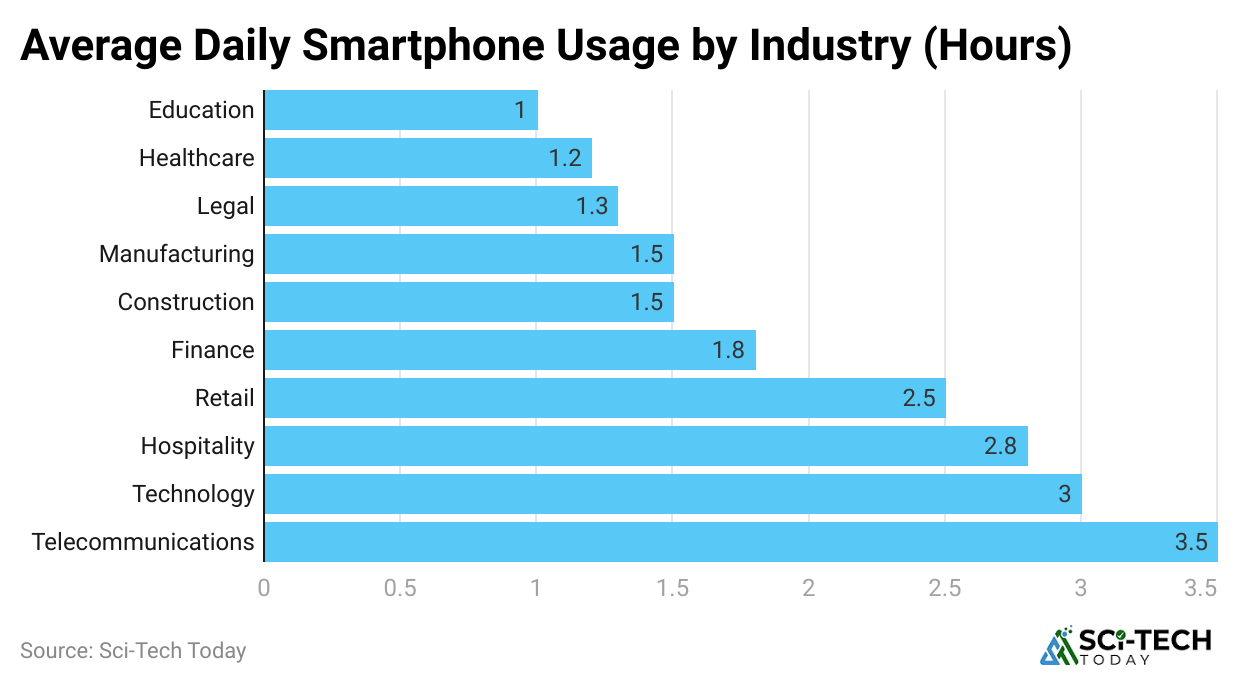
- Healthcare: 71% of nurses use cell phones in clinical areas, checking work apps and emails 45 times per shift, averaging 55 minutes of mobile time during patient rounds.
- That adds up to roughly 4 to 5 hours per week on phones, balancing patient care coordination and documentation.
- Retail: 63% of store associates report using smartphones for inventory apps and communication, spending on average 1 hour 12 minutes per 8-hour shift on mobile tasks.
- In smaller retail outlets, that jumps to nearly 1 hour and 30 minutes due to multi-role responsibilities and floor coordination.
- Manufacturing: 49% of floor staff use cell phones, primarily for safety alerts and shift scheduling, averaging 35 minutes per shift, often concentrated around start and end times.
- Plants with lean principles see that figure rise to 52% and over 45 minutes per shift of mobile usage.
- Finance sector: 82% of employees use smartphones for business, checking secure apps nearly 85 times per day, or every 5 minutes, totaling 2 hours 45 minutes on finance-related mobile tasks.
- A further 28% of time is spent on personal use, so total phone time can reach 3.5 hours per day.
- Education: 68% of teachers use cell phones during class prep, averaging 48 minutes daily, mostly for lessons to plan updates, communication with parents, and grading apps.
- During actual class hours, phone use drops to 22 minutes, focused on attendance and emergency alerts.
- Hospitality: 74% of hotel staff tap into mobile tools, spending an estimated 1 hour 18 minutes per shift across check-ins, chat coordination, and housekeeping alerts.
- In upscale hotels, mobile usage increases to 1 hour and 35 minutes due to additional guest services apps.
- Transportation/logistics: 61% of driver and dispatch staff rely on mobile phones for route updates, averaging 1 hour 5 minutes per 8-hour day, with peak usage at dispatch hand‑off (15 to 20 minute blocks).
- Delivery services see phone usage spike to 1 hour 22 minutes due to real-time tracking needs.
- Public sector/government: 54% of employees use agency‑approved cell phones, spending 50 minutes per day on official apps, and an additional 27 minutes on personal use, totaling 1 hour 17 minutes.
- In departments with tight BYOD policies, government phone time averages 1 hour 5 minutes per day.
- Tech/software: 89% of developers and staff use smartphones, checking code repositories, messaging, and alerts 130 times daily, totaling 3 hours 12 minutes per day on development and coordination.
- Start‑ups average 3 hours 45 minutes, while larger companies stabilize around 2 hours 55 minutes.
- Construction/trades: 42% of workers use personal phones on site, averaging 28 minutes per shift, higher in small companies (35 minutes) than in large-scale projects (22 minutes). Usage peaks during mid-shift breaks and contractor coordination calls.
| Industry | % Using Phones | Avg Daily Usage | Usage Focus Areas |
| Healthcare | 71% | 55 min/shift | Clinical coordination, messaging, apps |
| Retail | 63% | 72 min/shift | Inventory, communication, multitasking |
| Manufacturing | 49% | 35 min/shift | Safety alerts, scheduling, and shift coordination |
| Finance | 82% | 165 min/day | Secure apps, trading alerts, messaging |
| Education | 68% | 48 min prep | Planning, communications |
| Hospitality | 74% | 78 min/shift | Guest services, check-ins, messaging |
| Logistics | 61% | 65 min/day | Route updates, dispatch communication |
| Government | 54% | 77 min/day | Official apps, personal use |
| Tech/Software | 89% | 192 min/day | Dev tools, messaging, coordination |
| Construction | 42% | 28 min/shift | Site coordination, calls |
Company Policies, Restrictions, and Enforcement Around Cell Phones
 (Source: springer.com)
- In 2024, 57% of companies implemented formal cell-phone policies, compared to just 42% in 2019, over a 35% relative increase, indicating a growing corporate focus on regulating mobile use. These policies range from soft “use discretion” guidelines to hard bans in sensitive areas.
- 38% of companies prohibit phones in conference rooms, another 21% ban them in production zones, and 18% restrict use in customer-facing areas, totaling nearly 8 in 10 workplaces enforcing location-based rules. For high-security sites, the prohibition rate jumps to 65%.
- 21% of large enterprises (5,000 employees) install phone-signal blockers in secure zones, compared to 12% of mid-sized companies, reflecting a 75% higher adoption rate for tighter control. These blocks are used primarily in R&D labs, test zones, and confidential meeting rooms.
- Only 44% of companies actively enforce their phone rules, meaning a sizable 56% rely on voluntary compliance, leaving more than half of organizations at risk of inconsistent adherence.
- In contrast, 32% perform random compliance audits, while just 12% employ monitoring software.
- In manufacturable industries, 29% of companies apply daily penalties (warnings, docking pay up to 5%, or suspension) after a third violation of the phone policy. Service sectors show lower enforcement 17% impose financial discipline.
- 38% of surveyed employees reported receiving at least one phone-related disciplinary warning in the last year, with 17% of those cited for misuse during safety-critical duties.
- 57% of employees say policy clarity is lacking, often citing ambiguous phrasing like “don’t abuse phone use,” causing uncertain enforcement and uneven behavior.
- Nearly two-thirds (63%) say they would follow policies better if green/red usage zones were marked.
- 26% of workgroups use mobile-app monitoring tools, tracking things like screen time and app usage during work hours; of those, 58% report a reduction in policy violations after introduction. When combined with training, effectiveness jumps to 74%.
- Annual HR cost per violation averages US$138, including loss investigation, documentation, corrective action, and follow-up; large companies (10k+ staff) spend US$312,000 annually just on these infractions. Small businesses (100 employees) average US$13,800 per year in related HR time and costs.
- 92% of companies with strict enforcement (e.g., fines or phone collection) report employee frustration, but 64% of them also record improved compliance and a 37% drop in distraction-related incidents.
| Metric or Category | Value or % | Insight or Impact |
| Companies with formal phone policies | 57% | Up from 42% in 2019, a growing regulatory trend |
| Prohibition zones (rooms/areas) | 79% enforce location-based rules | Significant spatial restrictions on use |
| Signal-blockers installed in secure zones | 21% (large companies) vs. 12% (mid-size) | Tighter security in bigger players |
| Active policy enforcement | 44% | Just under two-thirds depend on voluntary compliance |
| Phone policy penalties applied | 29% in manufacturing | Lower adoption (17%) in services |
| Employee disciplinary warnings | 38% in the last 12 months | 1 in 10 get a formal reprimand annually |
| Policy clarity (% reporting ambiguity) | 57% | Suggests the need for clearer guidance |
| App monitoring groups | 26% track mobile use | 58% see drops in policy breaches |
| HR cost per violation | US $138 avg; $312k+ in large companies | Personalized business impact |
| Strict enforcement outcomes | 92% employee frustration; 64% reduced incidents | Tough love trade-off |
Health, Well‑Being, and Ergonomic Impacts of Cell Phone Use at Work
 (Source: mdpi.com)
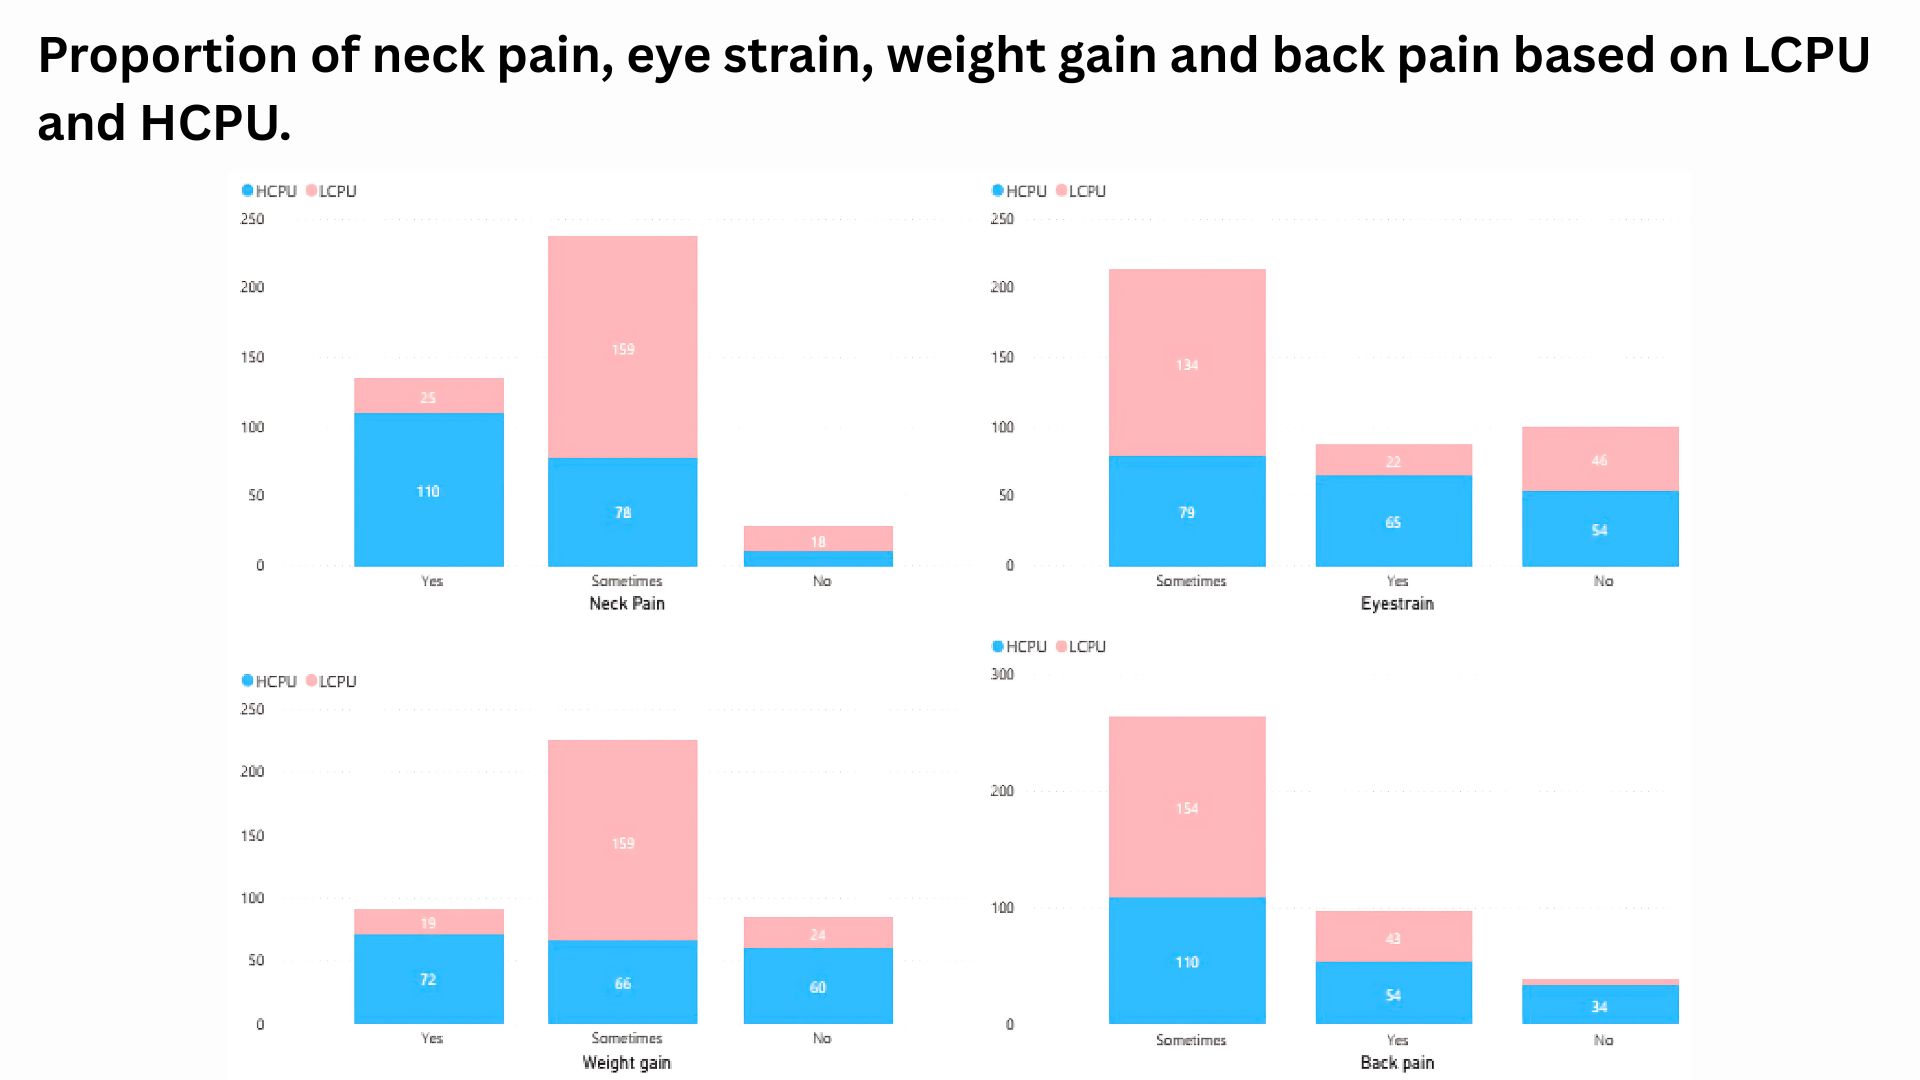
- 68% of employees report neck or shoulder pain, citing an average of 2.3 incidents per week directly associated with prolonged phone viewing or texting posture. That equates to around 4 to 5 hours of discomfort monthly per employee.
- 63% admit to eye strain or headaches, which they experience 3 to 4 days per workweek, due to screen glare and small-font reading on phones. This translates to roughly 12 to 16 days a month with reduced visual acuity symptoms.
- On average, each worker spends 17 minutes per day cradling a phone between their shoulder and ear, increasing the risk of trapezius muscle strain, adding up to 1 hr 15 minutes weekly of poor posture-induced tension.
- Smartphone-related wrist discomfort (texting thumb/gamer’s thumb) is reported by 44% of staff, averaging 5 to 8 days per month with tingling or mild pain. Roughly 22% require ergonomic intervention or splints as a resolution.
- Mental well-being impacted: 59% of employees feel increased anxiety due to being reachable via phone outside of work hours.
- They report an average 47% increase in off-hours message frequency, leading to disrupted rest time.
- Sleep deprivation is common: 54% of workers sleep 30 to 45 minutes less nightly because they check work messages before bed or after waking.
- Cumulatively, this is 210 to 315 minutes of lost sleep weekly, prompting fatigue and impaired focus.
- 51% of employees admit to poor work-life balance due to after-hours phone use, averaging 2.1 hours of mobile engagement outside of work, equivalent to 10.5 hr/week spent on work intrusions via personal phone.
- Phone usage while driving on the job: 28% admit using a smartphone behind the wheel, averaging 6 minutes per shift, representing over 30 minutes weekly of distracted driving risk on the job.
- 33% of staff use phones to self-diagnose health issues, investing 12 minutes per episode, leading to increased health anxiety and unnecessary medical visits in about 1 of 6 situations.
- Only 19% of organizations provide ergonomic phone-use training, despite 71% recognizing health complaints tied to mobile use, suggesting a large gap in proactive well-being support.
| Symptom/Metric | Reported % | Frequency/Time Impact |
| Neck/shoulder pain | 68% | 2.3 episodes/week, 4 to 5 hrs discomfort/month |
| Eye strain/headaches | 63% | 3 to 4 days/week 12 to 16 days/month |
| Poor phone posture (shoulder cradling) | 17 min/day 1h15/wk | |
| Wrist discomfort | 44% | 5 to 8 days/month; 22% need interventions |
| Anxiety from after-hours reachability | 59% | 47% more message volume |
| Sleep reduction | 54% | 30 to 45 min/night, 210 to 315 min/week lost sleep |
| After-hours phone use | 51% | 2.1 hr/day 10.5 hr/week intrusion |
| Phone use while driving | 28% | 6 min/shift 30+ min/week |
| Self-diagnosis via phone | 33% | 12 min/episode; anxiety in 1/6 cases |
| Ergonomic training provided | 19% of orgs | Despite 71% recognizing health issues |
Impact of Cell Phones on Workplace Safety
 (Source: qualtrics.com)
- 43% of workplace accidents in industrial and field jobs are linked to mobile phone distractions, with incident reports showing an average of 2.7 accidents per 100 employees annually due to improper mobile use during operations.
- In construction zones, use of personal phones is cited in 31% of near-miss incidents, equating to about 8.2 incidents per site per quarter, significantly increasing hazard potential in high-risk areas.
- 19% of reported warehouse injuries in the U.S. are tied to employees using phones while walking, averaging 3.1 falls or collisions per 100 workers per year, often resulting in time-off or medical claims.
- Forklift operators distracted by smartphones show a 26% higher error rate, with safety audits finding 15.4 risky maneuvers per operator per month when phones are used in operational areas.
- In hospitals and healthcare facilities, 22% of patient safety incidents stem from caregiver distraction due to mobile phones, resulting in miscommunications, missed alarms, or delays, occurring roughly 1.8 times per nurse each month.
- Phones contribute to 17% of security breaches in sensitive areas such as labs and financial institutions, with an average of 9 unauthorized data transfer attempts per 1,000 devices monthly being logged due to unsanctioned use.
- Fire departments and emergency services report a 12% decline in response speed during drills where phones were actively used, translating to an average delay of 16.2 seconds per call, which could be critical in high-stakes scenarios.
- In transportation and logistics, 28% of drivers admit to checking texts or calls while on delivery routes, contributing to in-vehicle distraction for 39 minutes weekly, heightening accident likelihood during job hours.
- Personal mobile usage has been associated with 3.6x more safety rule violations, with compliance teams noting over 14 minor violations per employee per month when no mobile policy is in place.
- Companies without strict phone policies experience 21% more safety-related compensation claims annually, averaging $1,720 higher per claim compared to organizations with active enforcement.
| Safety Metric | % Affected | Average Frequency/Impact |
| Accidents due to phone distraction | 43% | 2.7 incidents/100 employees/year |
| Near-miss incidents in construction | 31% | 8.2/site/quarter |
| Injuries in warehouses | 19% | 3.1 falls/collisions/100 workers/year |
| Forklift error rate increases | 26% | 15.4 risky actions/operator/month |
| Healthcare safety distractions | 22% | 1.8 distraction incidents/nurse/month |
| Unauthorized security breaches | 17% | 9 events/1,000 devices/month |
| Emergency response delay | 12% | 16.2 seconds slower per response |
| Drivers using phones on routes | 28% | 39 min/week distracted driving |
| Safety rule violations without policy | 3.6x increase | 14 violations/employee/month |
| Compensation claim cost without policy | 21% more claims | $1,720 higher per incident |
Cell Phone Usage and Employee Performance Metrics
 (Reference: statcrunch.com)
- Employees using mobile phones for non-work activities more than 2 hours daily show a 26% decrease in productivity, with output reducing by an average of 3.4 tasks/day compared to focused counterparts.
- On average, 64 interruptions per employee per day are linked to mobile phones, each costing approximately 3.2 minutes of refocus time, totaling over 3.4 hours of lost efficiency daily in distracted work.
- Organizations with unrestricted mobile usage reported a 17% lower work quality index, equating to 9.8 additional errors per 100 tasks completed due to distractions from messaging, social apps, and videos.
- Employees checking personal phones every 10 minutes show a 38% slower task completion rate, with time-on-task efficiency dropping from 82% to 51% on high-concentration assignments.
- 82% of managers agree that cell phone distractions reduce team collaboration by 27%, especially during brainstorming or agile sprint meetings, causing 1.6 missed insights per session.
- Customer support agents using mobile phones during work hours handle fewer queries by 21% and average 2.3 more unresolved cases per shift, directly impacting Net Promoter Scores (NPS).
- Self-reported mobile distractions increase during remote work, with 41% of remote employees admitting to 3 hours/day on personal phone use, correlating to a 22% decline in performance scorecards.
- Sales professionals using mobile phones for non-sales tasks during peak hours experience a 14% drop in close rate, making 1.9 fewer successful sales calls per day compared to mobile-restricted colleagues.
- Software developers receiving mobile alerts every 15 minutes see a 35% decline in code quality, with bug reports rising by 4.7 per project iteration, extending QA cycles by an average of 2.1 days.
- Mobile notifications during deep work sessions result in a 25% increase in context-switching errors, with employees requiring 11.6 minutes on average to regain original workflow focus post-interruption.
| Performance Factor | Affected % / Impact Level | Numeric Breakdown |
| Productivity loss due to 2 hrs phone use | 26% | -3.4 tasks/day |
| Average daily phone-related interruptions | 64/day | 3.2 min refocus is equal to 3.4 hrs/day lost |
| Work quality in unrestricted phone use | 17% | +9.8 errors/100 tasks |
| Slower task completion due to frequent checks | 38% efficiency | Time-on-task from 82% to 51% |
| Collaboration during meetings | 27% effectiveness | -1.6 insights/session |
| Customer service agent effectiveness | 21% queries handled | +2.3 unresolved tickets/shift |
| Remote employee mobile distraction | 41% 3 hrs/day | 22% performance scorecards |
| Sales close rate drops | 14% close rate | -1.9 deals/day |
| Developer code quality decline | 35% | +4.7 bugs/iteration; +2.1 days QA |
| Context-switching recovery time | 25% errors | 11.6 mins to refocus post-phone alert |
Impact of Cell Phones on Workplace Communication Patterns
 (Reference: electroiq.com)
- 68% of employees admit to texting or using instant messaging apps during meetings, reducing face-to-face engagement levels by 34%, often leading to 1.7 missed verbal cues per meeting.
- In companies where mobile-based communication apps dominate, email usage dropped by 49%, but miscommunication incidents rose by 21%, contributing to an average of 3.2 internal conflict reports monthly.
- 37% of workers say they avoid direct verbal communication, preferring messaging apps, which delays tasks by 2.5 hours/day and causes project milestone delays in 18% of cases.
- Teams relying on personal messaging platforms like WhatsApp for work saw a 24% increase in misaligned expectations, resulting in 2.1 more task revisions per sprint cycle than teams using official tools.
- In hybrid offices, employees check their mobile phones an average of 52 times during meetings, causing attention lapses that lead to incomplete action items in 29% of meeting summaries.
- Phone call avoidance has risen by 61% in workplaces, favoring text-based communication, reducing urgent issue resolution speed by up to 38 minutes per case, affecting SLA targets.
- Employees receiving mobile messages from different platforms (Slack, Teams, SMS) face a 46% communication overload, reducing retention of key info from 72% to just 48% within daily briefings.
- Poor mobile communication etiquette leads to 23% of managers rating team interactions as “inefficient”, citing constant interruptions, cross-talk, and off-topic messaging as performance blockers.
- 43% of HR complaints involving workplace miscommunication now stem from misunderstandings caused by mobile text tone, emojis, or message brevity, escalating interpersonal tensions.
- In cross-functional teams, mobile-first communication models caused a 19% increase in redundant efforts, where 1 in 4 teams duplicated tasks due to unclear or missed mobile instructions.
| Communication Pattern | % Impact / Trend | Numeric Breakdown |
| Texting during meetings | 68% employees | 34% face engagement, 1.7 missed cues/meeting |
| Shift from email to mobile messaging | 49% email | +21% miscomms, 3.2 conflict reports/month |
| Delayed verbal | 37% prefer messages | +2.5 hrs/day delay, 18% project delays |
| Misaligned expectations via personal apps | +24% rise | +2.1 task revisions/sprint |
| Phone checks in hybrid meetings | Avg. 52 times | +29% incomplete action items |
| Avoidance of calls | +61% increase | +38 mins delay per urgent task |
| Communication overload | +46% overload | Retention drop from 72% 48% |
| Inefficient team interactions | 23% of managers are dissatisfied | Frequent off-topic mobile use |
| HR complaints due to the mobile tone | 43% complaints | Emojis, tone confusion, and short messages |
| Task redundancy in mobile-first teams | +19% increase | 1 in 4 teams duplicate work |
Cell Phone Use Policies Across Industries
 (Reference: electroiq.com)
- The technology sector tops at 94% policy adoption, including both smartphone and tablet usage, with 88% enforcing employee-processing of data through official apps only and 65% restricting personal-app use during core hours.
- Financial services maintain 89% formal phone-use policies, typically blocking non‑work apps on corporate-managed devices; 73% run real‑time monitoring, and 42% prohibit personal phones in trading zones.
- Healthcare formalizes cellphone rules in 76% of organizations, with 34% banning phones in patient-care zones, 48% allowing them in administrative areas, and 22% enabling controlled app-based clinical access.
- Manufacturing enforces cellphone policies in 69% of plants, where 41% restrict phones near machinery, 27% limit use to break rooms, and 19% require hands-free setups when walking floors.
- Retail chains enforce phone regulations in 62% of stores, with 38% disallowing devices during customer interactions, 28% tracking phone use via proximity devices, and 24% issuing warnings after 2 infractions/month.
- Educational institutions formalize protocols in 58% of systems, capping personal-device use to prep hours only; 21% ban phones in exams or classrooms, while 31% limit them in staff rooms and public zones.
- Hospitality businesses apply phone policies in 54% of hotels/restaurants, with 33% limiting use to back offices, 19% imposing performance reviews for violations, and 12% using geofencing to log logged areas.
- Transportation/logistics companies hold 47% formalized phone-use policies, 29% restricting use while driving or operating vehicles, 18% applying GPS-based tracking, and 12% enforcing tiered access by staff role.
- Public-sector/government agencies report 65% policy coverage, including 55% implementing BYOD frameworks with restricted use, 19% prohibiting phones in secure zones, and 7% penalizing violations via job-level consequences.
- Construction and field-based trades hold 39% formal phone policies, often comprising 24% banning phones onsite, 15% allowing only work-related app use, and 8% enforcing disciplinary notices for misuse.
| Industry | Policy Adoption Rate | Key Restrictions Enforced | Monitoring / Discipline Measures |
| Technology | 94% | Limit personal apps during core hours (65%) | 88% use official apps only |
| Financial Services | 89% | Ban personal phones in trading areas (42%) | 73% conduct real-time monitoring |
| Healthcare | 76% | No phones in patient areas (34%) | 48% allow controlled clinical app use |
| Manufacturing | 69% | Machinery phone ban (41%) | 27% break-room-only-use rule |
| Retail | 62% | No phones during customer interaction (38%) | 28% proximity tracking, 24% infractions policy |
| Education | 58% | No phones in classrooms/exams (21%) | 31% limit use zones |
| Hospitality | 54% | Back-office only (33%) | 19% review-based penalties |
| Transportation/Logistics | 47% | Ban during vehicle operation (29%) | GPS tracking (18%), independent role tiers (12%) |
| Public Sector | 65% | Restrict in secure zones (19%) | 55% BYOD policies, 7% job-level penalties |
| Construction/Trades | 39% | No onsite use (24%) | 15% app-only use, 8% disciplinary enforcement |
Financial and Economic Impacts of Cell Phone Use in the Workplace
 (Source: thehartford.com)
- Global annual productivity losses tied to mobile distraction are estimated at US $650 billion, derived from 720 lost hours per employee multiplied across 160 million U.S. workers, reflecting a tremendous economic drain.
- The average company spends US $312 per employee yearly managing phone-related distractions (investigations, training, policy enforcement), translating to US $31.2 million per 100,000 employees.
- BYOD policies cut hardware and support costs by 28%, saving employers an average of US $341 per employee annually, which for a 5,000-employee company totals around US $1.7 million annually.
- Organizations implementing app monitoring and training reduced distraction-related incidents by 37%, generating productivity gains equating to 135% extra work hours annually per employee.
- Turnover rates drop by 14% in companies offering employee mobile flexibility, compared to rigid corporate-device models, leading to savings of US$2,400 per employee in recruitment and onboarding costs.
- Sales revenue in mobile-enabled sales teams rises 12% on average, with mobile access to CRM and communication tools adding US $18,000 incremental revenue per salesperson annually.
- Customer support centers using mobile tools see average repeat-customer complaints drop by 15%, improving retention rates by 7%, resulting in US$1.8 million savings per 1,000 agents annually.
- Error costs due to phone distractions average US $1,720 per safety-related claim, with companies without strict policies experiencing 21% more such payouts, adding unpredictability to insurance premiums.
- Time saved per employee using mobile-first workflows equates to 58 minutes/day, or 240 hours/year, potentially contributing US $5,500 extra output value per employee annually, based on average salary multipliers.
- BYOD market valuation: USD 98.8 billion in 2024, projected to increase to USD 157.3 billion by 2026, implying a 15% CAGR and showing strong economic investment and reliance on mobile devices.
| Financial Metric | Value / Impact Level | Business Implication |
| U.S. annual productivity loss | US$650B | Massive national economic burden |
| Cost per employee for distraction control | US$312 | Scales to millions annually in large companies |
| BYOD cost savings per employee | US $341 (28%) | US $1.7M saved per 5,000 employees |
| Incident reduction via training/monitoring | 37% fewer incidents; 135 hrs extra productive | Direct ROI from enforcement strategies |
| Employee turnover reduction with BYOD | 14%; saves $2,400/pax | Lower hiring/replacement expenses |
| Revenue increase in mobile-enabled sales teams | 12% $18,000 revenue boost/rep | Mobilization drives top-line growth |
| Support center cost reductions | 15% complaints; 7% retention | US $1.8M annual savings per 1,000 agents |
| Safety-claim cost escalation without policy | +21% more claims; $1,720 each | Risk and insurance financial exposure |
| Value of time saved per employee | 58 min/day equals 240 hrs/year $5,500 output value | Productivity translates to financial gain |
| BYOD global market size (20242026) | US $98.8B US $157.3B (15% CAGR) | Growing economic dependency on personal-device models |
Cell Phone Use and Workplace Privacy Concerns
 (Source: thehartford.com)
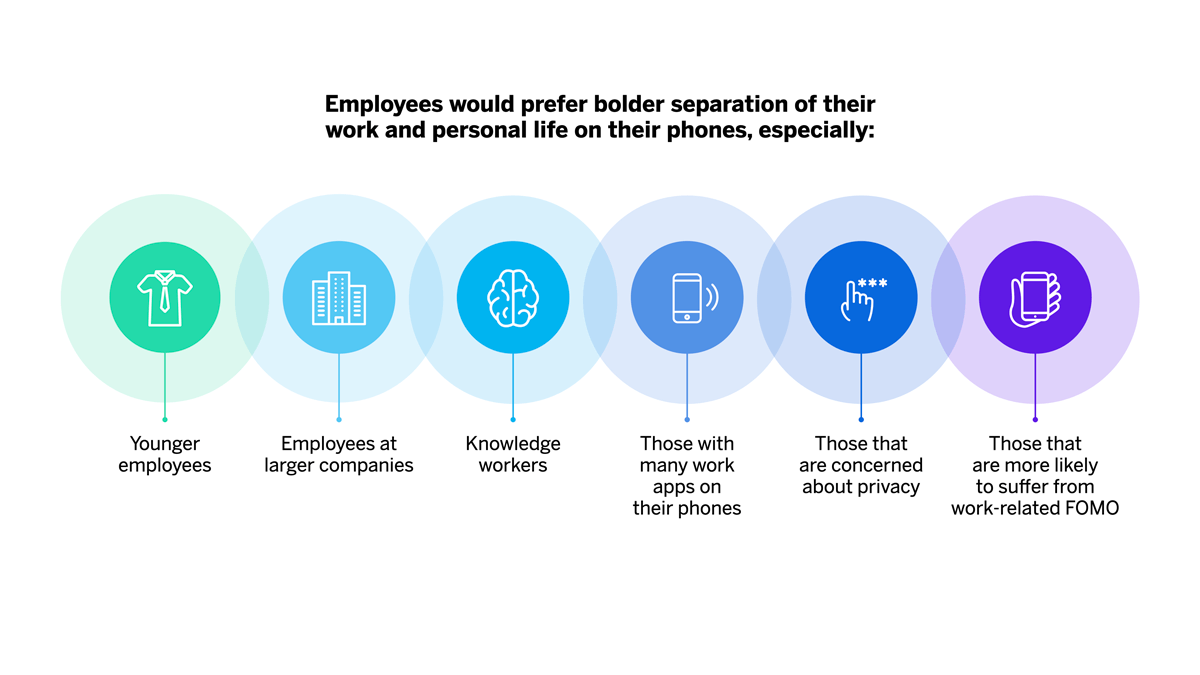
- Over 64% of employees express concern that company-issued or monitored cell phones invade their privacy, especially with location tracking features that remain active outside work hours.
- 48% of companies with BYOD policies admit they have access to personal data like text messages, photos, or call logs due to mobile device management (MDM) tools, creating tension between productivity and privacy.
- 7 in 10 employees (71%) worry that their mobile activity could be used in performance reviews, and 38% report modifying behavior (limiting communication or app usage) due to monitoring concerns.
- 20% of data breaches in enterprises originate from mobile devices, and 56% of these involve personally identifiable information (PII) like health records or financial info, raising privacy alarms for both users and companies.
- 34% of U.S. workers state they are unaware of what their employers can track on mobile devices, while 52% believe companies do not fully disclose surveillance practices, indicating a transparency gap.
- Nearly 40% of employees who use phones for work say they feel uncomfortable using personal apps like WhatsApp or Instagram during breaks because of device tracking capabilities installed by employers.
- 67% of employees in the healthcare and finance sectors are hesitant to use mobile devices for work-related messaging due to HIPAA or regulatory compliance risks, despite the availability of encrypted tools.
- Mobile device surveillance lawsuits have increased 21% year over year, with notable settlements exceeding US $10 million involving cases where companies failed to inform employees of real-time app usage monitoring.
- 58% of IT professionals admit their companies have no clear separation between personal and business data on mobile phones, risking legal liability in the event of audits, subpoenas, or internal investigations.
- 82% of employees state they would be more willing to use mobile tools for work if employers provided full transparency and gave consent-based access controls, suggesting privacy-conscious policies can boost adoption.
| Privacy Issue | Metric / Data Point | Impact / Concern |
| Employee privacy concerns with company phones | 64% worried about location & data tracking | Negative effect on trust |
| Employer access to personal data | 48% admit viewing personal files | Ethical & legal concerns |
| Behavioral shifts due to surveillance | 71% worried; 38% altered usage behavior | Lower engagement with mobile tools |
| Mobile-originated data breaches | 20% of all breaches; 56% involve PII | Significant compliance exposure |
| Lack of employee awareness | 34% unaware of surveillance; 52% distrust employers | Communication failure risk |
| App discomfort due to tracking | 40% feel uneasy using personal apps at work | Reduces morale and openness |
| Industry-specific hesitation (HIPAA, etc.) | 67% cautious in healthcare/finance | Limits mobile adoption in regulated sectors |
| Rise in legal disputes over phone surveillance | +21% YoY increase; multi-million dollar settlements | Legal liabilities are growing |
| No clear data separation in MDM systems | 58% of IT teams lack boundary setup | Risk of legal/HR fallout |
| Demand for privacy-conscious policies | 82% want consent control to increase usage | Strong case for transparent, opt-in strategies |
Impact of Cell Phone Use on Company Productivity
 (Reference: jobmarketmonitor.com)
- Employees spend an average of 56 minutes per workday on their cell phones for non-work activities, which translates to over 4.5 hours per week, significantly lowering individual output over time.
- A study across 11 industries revealed that 37% of workplace productivity loss could be traced directly to mobile phone distractions, making it the single largest factor in modern digital workplace inefficiencies.
- Organizations that implemented strict mobile phone policies experienced a 21% increase in employee productivity, especially in logistics, call centers, and manufacturing sectors, where focus is critical.
- 65% of managers believe that excessive personal phone use by employees negatively affects team output, and 42% have issued warnings or formal write-ups for mobile-related performance issues.
- On average, employees check their phones 96 times per day, often disrupting deep focus cycles, which research indicates can take over 23 minutes to resume full concentration after a single interruption.
- Companies using productivity tracking tools found that employees lose up to 10% of their billable work hours weekly due to mobile usage, costing businesses millions annually in avoidable payroll leakage.
- 53% of surveyed business leaders cited smartphone use during meetings as a major disruption, often extending meetings by an average of 12 minutes due to side conversations, repeated clarifications, and distraction loops.
- In creative teams, mobile phone distractions have been associated with a 17% drop in quality, as constant notifications prevent the kind of mental incubation necessary for complex ideation.
- When companies introduced “phone-free work zones,” 75% reported a noticeable improvement in time-on-task metrics, especially during critical workflows like inventory audits, coding sprints, or sales outreach blocks.
- A Gallup report found that employees who self-report high mobile usage at work are 2.5 times more likely to miss deadlines, leading to delays in project delivery and measurable dips in client satisfaction scores.
| Productivity Metric | Data / Percentage | Impact on Work |
| Time spent on non-work phone activity | 56 mins/day 4.5 hours/week | Reduces direct work output |
| Contribution to productivity loss | 37% of losses from phones | Highest productivity drain |
| Productivity boost with phone policies | +21% in focused environments | Clear gain from restrictions |
| Managerial concern & action | 65% concerned; 42% issued warnings | Performance management impacted |
| Frequency of phone checking | 96 times/day; 23 mins to refocus | Interrupts deep work cycles |
| Billable hours lost | Up to 10% weekly loss to phones | Major financial leakage |
| Meeting disruption | 53% leaders concerned; +12 mins avg duration | Lower meeting efficiency |
| Drop in creative quality | -17% quality | Hinders ideation and brainstorming |
| Effect of “no phone zones.” | 75% saw better focus | Environmental change boosts results |
| Missed deadlines correlation | 2.5× higher for heavy users | Direct impact on deliverables |
Future Trends in Cell Phone Usage at Workplaces
 (Source: qualtrics.com)
- By 2027, it’s projected that 91% of employees globally will use smartphones as part of their daily work functions, up from 77% in 2023, indicating a shift toward mobile-integrated workflows and remote-ready operations.
- The global enterprise mobility market is expected to surpass $180 billion by 2026, growing at a CAGR of 24.3%, driven by companies adopting BYOD (Bring Your Own Device) and mobile-first collaboration tools.
- 43% of companies plan to implement AI-powered mobile monitoring software by 2026 to track productivity and reduce distractions, compared to just 12% in 2022, showcasing a sharp rise in proactive phone governance.
- Augmented Reality (AR) on workplace mobile devices is forecasted to reach $15.5 billion in market value by 2028, empowering industries like manufacturing, design, and healthcare with real-time visualization tools.
- By 2030, over 58% of workplace training modules are expected to be delivered via mobile-first platforms, especially in hybrid work environments, compared to just 19% in 2020, reflecting the m-learning boom.
- Around 65% of HR professionals predict that future workplace policies will include context-aware mobile restriction systems that auto-disable phones during key meetings, client calls, or task-focused periods.
- With the 5G rollout expanding, mobile workplace apps will reduce latency by 30 to 40%, leading to faster access to data-heavy applications and smoother video conferencing, particularly in data-sensitive industries.
- In cybersecurity, mobile endpoint security investment is expected to reach $13 billion by 2027, a steep increase from $5.6 billion in 2022, as companies battle threats stemming from mobile vulnerabilities.
- By 2028, over 72% of deskless workforce jobs, such as retail, logistics, field sales, and construction, will depend on mobile devices for core operations, up from 49% in 2021, as mobile tools replace legacy systems.
- AI chat assistants on workplace phones are projected to complete 22% of repetitive employee tasks by 2029, significantly altering job roles in administration, sales support, and HR, while improving efficiency.
| Trend Area | Projected Statistic | Expected Change & Impact |
| Employee mobile usage by 2027 | 91% globally | Nearly universal device integration |
| Enterprise mobility market by 2026 | $180 billion (CAGR 24.3%) | Rapid tech adoption in mobile-first workflows |
| Mobile productivity monitoring tools | 43% adoption by 2026 | AI-driven governance rise |
| AR mobile tools growth | $15.5B market by 2028 | Enhanced visualization in hands-on industries |
| Mobile-first training by 2030 | 58% of training delivered on mobile | Shift toward m-learning |
| Smart phone policy enforcement | 65% with automated restrictions | Smarter workplace discipline tools |
| Speed from 5G adoption | 30 to 40% latency reduction | Faster, better remote access |
| Mobile cybersecurity investment | $13B by 2027 | Focus on securing phone-based access |
| Deskless workforce dependence | 72% jobs will be mobile-integrated by 2028 | Traditional tools replaced by mobile apps |
| AI assistants on mobile | 22% of repetitive tasks will be handled by AI by 2029 | Role reshaping and automation |
Conclusion
So, with these cell phones at the workplace statistics article, we can conclude that phones in the workplace aren’t going anywhere; they’re now part of the job, the workflow, and many times, the distraction. As the stats show, it’s all about how we use them. With over 85% of workers admitting to personal use during work hours and mobile apps reshaping how teams collaborate, the numbers speak volumes.
The takeaway? Control, not ban. Self-aware, not restricted. The smartest workplaces aren’t fighting phones; they’re making them work smarter. Because in the end, managing cell phones at the workplace is really about managing modern work itself. Thanks for reading my piece of work, I highly appreciate to drop any questions regarding this topic.
