






Introduction
Digital Signage Statistics: Digital signage converts electronic posters into a data-driven form of communication and marketing that shows up everywhere, such as retail, hospitality, healthcare, transport, schools, corporate spaces, banking, and public areas. In 2026, the global digital signage market is projected to reach $34.7 billion (from $31.8 billion in 2025), and it’s estimated to climb to $52.7 billion by 2033, with an 8.2% CAGR.
Moreover, the installed base for connected digital signage screens is expected to grow too, from 91.5 million units in 2023 to 149.4 million by 2028. The market is expected to undergo a bigger change with fewer static messages and more dynamic, remotely steered, and sort of smarter displays. Retail is still a big piece of the puzzle, while AI cloud CMS platforms, 4K screens, interactive kiosks and digital out-of-home advertising keep opening up new chances for measurable customer engagement.
This article will show the recent digital signage statistics, which include market growth, industry benchmarks, screen time, and ROI in 2026.
Featured Selection
- In 2026, the global digital signage market is projected at $34.7 billion and expected to reach $52.7 billion by 2033.
- North America held 37.2% of the market in 2024, while Asia-Pacific logged the top regional CAGR at 9.3%.
- 95% of businesses manage five or fewer screens.
- 67% of measured screens run through web browsers, with Chrome alone making up 41%.
- After adopting digital signage, about 80% of brands’ sales gains, up to 33%.
- Businesses report an average 31.8% rise in sales volume, and 15%–30% is the sales lift of featured products.
- Digital signage gets 400% more views than traditional static displays, and the recall rate hits 83% when content is dynamic.
- Because digital signage attracts their interest, around 76% of consumers enter a store, indicating measurable influence on foot traffic.
- With static visual content the most common signage format, 94% of businesses use images on their screens.
- 46.2% of surveyed operators plan to try AI within one year, compared with current adoption of just 8.3%.
Digital Signage Market Size Forecast
(Source: market.us)
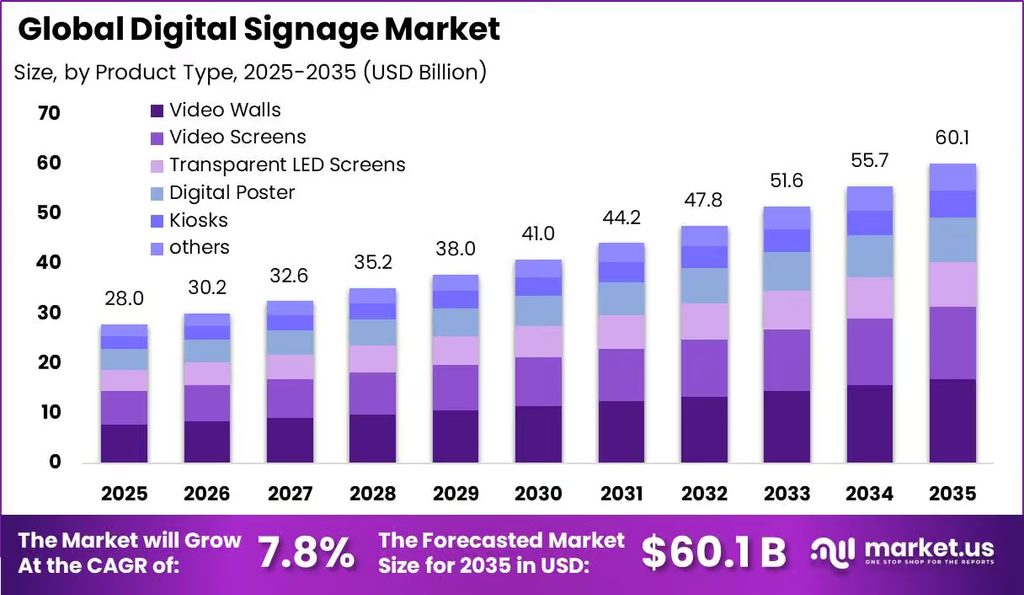
According to Market.us, the global digital signage market is positioned for steady expansion through 2035, supported by rising adoption of digital advertising networks, interactive displays, retail media platforms, and advanced screen technologies.
- Global Market Size: The global digital signage market was valued at approximately USD 28.0 billion in 2025.
- Market Forecast: The market is projected to reach nearly USD 60.1 billion by 2035, expanding at a compound annual growth rate (CAGR) of 7.8% from 2026 to 2035.
- Product Type Analysis: The video walls segment held the leading position in 2025, accounting for approximately 28.2% of the global market share. Growing deployment across control rooms, retail stores, transportation facilities, corporate environments, and entertainment venues has supported segment demand.
- Component Analysis: The hardware segment dominated the market with a share of approximately 56.0% in 2025. Demand has been supported by continued investment in display panels, media players, mounting systems, networking equipment, and other physical infrastructure required for digital signage installations.
- Technology Analysis: The LED segment captured approximately 46.5% of the global market share. Its strong position can be attributed to higher brightness, energy efficiency, longer operating life, improved image quality, and increasing use in both indoor and outdoor signage applications.
- Screen Size Analysis: Displays measuring 32 to 52 inches represented the largest screen-size category, accounting for approximately 44.0% of the market share. These displays are widely used across retail outlets, restaurants, corporate offices, educational institutions, and public facilities.
- Content Category Analysis: The broadcast content segment dominated the digital signage market with approximately 81.0% share in 2025. Its leadership has been supported by the growing use of digital screens for advertisements, promotional videos, live information, branded communication, and entertainment content.
- Location Analysis: The indoor segment accounted for approximately 66.0% of total market revenue. Indoor digital signage continues to be extensively deployed across shopping malls, airports, retail stores, hotels, healthcare facilities, restaurants, and corporate buildings.
- Application Analysis: The retail segment held the largest application share at approximately 22.0% in 2025. Retailers are increasingly deploying digital displays for promotions, product discovery, price communication, brand engagement, digital shelves, and in-store advertising.
- Regional Analysis: North America remained the leading regional market in 2025, accounting for approximately 34.6% of global revenue, equivalent to nearly USD 9.68 billion. The region’s leadership has been supported by advanced advertising infrastructure, strong retail media investment, widespread adoption of digital-out-of-home advertising, and early deployment of innovative display technologies.
- Digital-Out-of-Home Advertising Growth: Market expansion is being supported by increasing investment in digital-out-of-home (DOOH) advertising. U.S. out-of-home advertising revenue reached approximately USD 9.46 billion in 2025, with digital formats representing around 36.3% of total spending.
- Strong DOOH Growth Rate: Digital-out-of-home advertising revenue has been expanding at more than 10% year over year, reflecting the continued movement of advertising budgets from traditional static billboards and printed materials toward dynamic and data-driven digital displays.
- Retail Media Expansion: Global retail media advertising spending is estimated to reach approximately USD 165.9 billion in 2025, compared with around USD 50.7 billion in 2019. This represents more than a threefold increase within six years and is creating additional demand for digital displays and in-store advertising networks.
- U.S. Retail Media Opportunity: Retail media spending in the United States is expected to increase by approximately 20% in 2025, significantly exceeding growth across the broader advertising industry. This trend is supporting greater installation of digital shelf displays, end-cap screens, promotional displays, and connected in-store media networks.
- Key Market Growth Factor: The continued transition from static advertising formats toward dynamic, targeted, and centrally managed digital content is expected to remain an important growth factor. Increased deployment across malls, transportation hubs, roadside locations, retail outlets, hospitality environments, and public venues is generating demand for displays, media players, content management platforms, and supporting software solutions.
- Market Outlook: The digital signage industry is expected to benefit from the convergence of retail media, programmatic advertising, LED technology, cloud-based content management, audience analytics, and interactive customer experiences. These developments are expected to support sustained market expansion through 2035.
Digital Signage Regional Markets
| Region | 2024 Market Share | Growth Outlook |
| North America | 37.2% | Steady growth, mature market |
| Europe | 26.8% | Retail and transportation driving growth |
| Asia-Pacific | 24.5% | Highest CAGR (9.3%), rapid urbanization |
| Latin America | 6.2% | Emerging market, 11.3% CAGR |
| Middle East & Africa | 5.3% | Smart city investments driving adoption |
(Source: digitalsignage.com)
Digital Signage Benchmarks By Industry
| Industry | Freshness (median days) | Active 90d | Median screens (mean) | Recycled >1yr |
| Education | 49.3 | 78.40% | 1 (3.6) | 26% |
| Healthcare | 43.1 | 83.00% | 1 (3.9) | 25% |
| Technology | 29.9 | 80.00% | 1 (3.1) | 19% |
| Real Estate | 26.2 | 100.00% | 1 (4.0) | 27% |
| Retail | 24.5 | 88.50% | 1.5 (5.8) | 20% |
| Manufacturing | 20.1 | 89.30% | 2 (2.5) | 34% |
| Other | 14.6 | 74.70% | 2 (4.4) | 34% |
| Finance & Banking | 10.7 | 68.10% | 2.5 (8.4) | 29% |
| Media & Ent. | 9.5 | 96.30% | 2 (2.6) | 26% |
| Government | 7.5 | 87.30% | 5 (5.0) | 28% |
| Non-Profit | 7.3 | 90.10% | 1 (2.6) | 32% |
| Hospitality | 3.9 | 88.10% | 1 (2.1) | 26% |
(Source: kitcast.tv)
Digital Signage Impact Across Key Industries
Retail
| Metric | Value |
| Retail share of digital signage market | 40% (largest segment) |
| Sales increase for featured products | 32% |
| Repeat buyers after digital signage exposure | 33% |
| Increase in unplanned purchases | 19.8% |
| Customers influenced by digital displays | 68% |
| In-store digital signage recall | 47.7% |
Restaurants & QSR
| Metric | Value |
| Sales increase from digital menu boards | 30%+ |
| Decrease in perceived wait time | 35% |
| Customers who notice menu board content | 74% |
| Upsell success rate improvement | 2-3x |
| Drive-thru order accuracy improvement | 15% |
Healthcare
| Metric | Value |
| Healthcare institutions improved by digital signage | 92% |
| Patients influenced by digital communication | 40% |
| Reduction in perceived wait time | 33% |
| Patient satisfaction improvement | 25% |
| Staff time saved on wayfinding questions | 40-60% |
Banking and Financial Services
| Metric | Value |
| Banks seeing ROI within 18 months | 95% |
| New account openings increase | 10% |
| Cross-sell rate improvement | 46% |
| Customer satisfaction improvement | 21% |
| Branch efficiency improvement | 15% |
Education
| Metric | Value |
| Student engagement improvement | 34% |
| Emergency communication effectiveness | 89% |
| Campus wayfinding satisfaction | 45% improvement |
| Event attendance increase | 30% |
| Administrative time savings | 15-20 hours/month |
(Source: digitalsignage.com)
- Digital signage is spreading business value across retail, restaurants, healthcare, banking, and education.
- The retail industry is leading in the market with around a 40% share, and when featured products are displayed, sales can jump by 32%.
- Digital displays reach about 68% of customers, 33% of them end up coming back again, and unplanned purchases rise roughly 19.8%.
- In restaurants and QSRs, digital menu boards can drive over 30% higher sales, make the wait feel 35% shorter, and boost upselling by something like 2–3 times. Even the accuracy of drive-thru orders can get better by 15%.
- In the healthcare industry, about 92% of institutions report improvements after switching to digital signage.
- Patient satisfaction climbs by 25%, while staff save 40–60% of their time on wayfinding questions, so yeah, fewer interruptions.
- Banking also tends to be strong, with 95% of banks seeing ROI within 18 months. There’s also a 46% uplift in cross-selling and a 21% higher customer satisfaction score.
- In the education industry, student engagement improves by 34%, emergency communication effectiveness lands at 89%, and event attendance goes up by 30%.
- Digital signage can back up sales, efficiency, communication, and overall customer experience across a bunch of different sectors.
Digital Signage Deployments Remain Mostly Small-Scale
(Source: juuno.co)
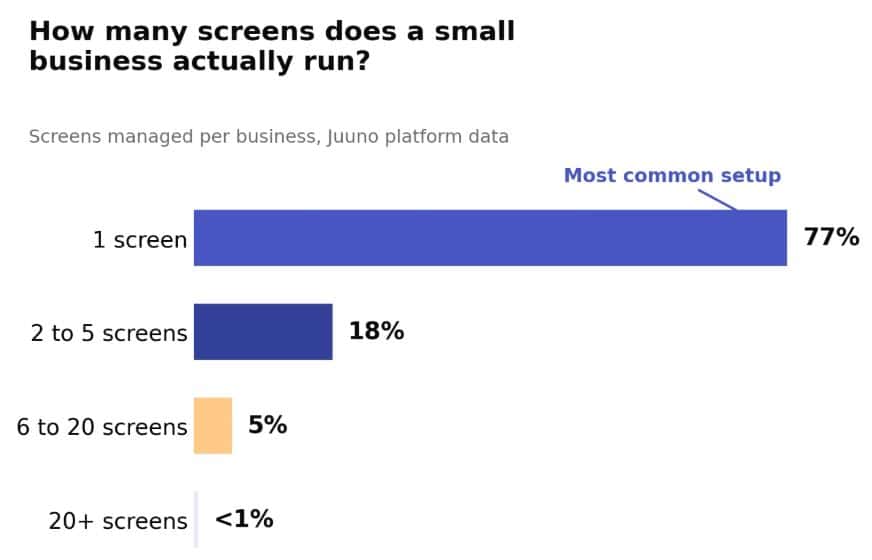
- Digital signage adoption is still mostly limited to smaller rollouts rather than large-scale networks.
- 77% of businesses manage just one screen, so single-screen setups end up as the main configuration.
- Another 18% run somewhere between 2 and 5 screens, which makes those modest multi-screen arrangements.
- Only 5% of businesses handle 6 to 20 screens, while under 1% operate 20 or more screens through the platform.
- 95% of businesses are managing five screens or less.
- As of June 2026, anonymized platform activity from more than 5,000 active businesses. It has become a useful look at real screen-management patterns.
- Lots of businesses are using digital signage for targeted, local communication instead of steering large display networks.
- The concentration presents a strong chance to build straightforward, low-cost solutions for vendors that fit smaller operators, while the larger deployments stay a more limited part of the overall market.
Digital Signage Hardware Browser Screen Time
(Source: juuno.co)
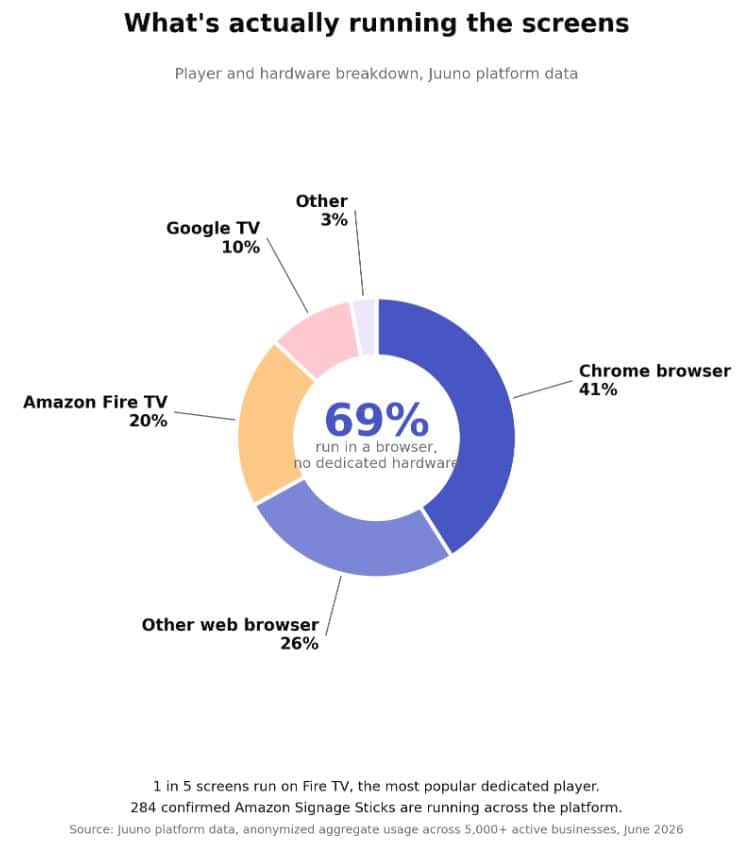
- Digital signage is becoming more like a software-driven market, and browsers are doing a lot of heavy lifting for the screens.
- Chrome stands at 41% of the deployments for the most used platform.
- Other web browsers add another 26%, and 69% of all screens run through browsers without any dedicated hardware behind them.
- Amazon Fire TV is at 20% of screens, so it’s the top dedicated digital signage player, and it looks like about one in five screens in the measured dataset.
- Google TV lands at 10%, so it has about half the share of Amazon Fire TV, but it’s still clearly there.
- Everything else, only 3% total, including other players and hardware choices; the whole operation revolves around a few main platforms.
- Companies are moving ahead with browser-based solutions rather than signage hardware.
- Moreover, Amazon Fire TV and Google TV show that budget-friendly, consumer-oriented devices keep a real spot in digital signage deployments.
Digital Signage Sales Impact and ROI
- Digital signage has measurable impact on retail sales, customer conduct, and operating costs.
- Brands that use digital signage: around 80% say they’re getting sales lifts, up to 33%.
- Many businesses report that as they adopt digital displays, there is around a 31.8% bump in total sales volumes.
- Retail operators can reach about 15–30% more sales for highlighted products, and those operators whose screens end up being quite good for focused promotions.
- Digital signage can cut recurring printing costs by 30–50%, on the cost side.
- In terms of people’s behaviour, well-placed displays bring about a 19.8% increase in impulse purchases, plus around 70% of customers say digital signage impacts their buying decisions.
- According to return on investment, the average payback period is somewhere between 6 and 18 months.
- Engaging content can increase repeat buyers by 32.8%, and customers tend to spend roughly 30% more time wandering or browsing in shops that have changing displays.
- Businesses use digital signage strategically, which makes it work best, instead of just installing screens everywhere.
- The real value of digital signage comes from mixing sales promotion, lower print outlay, stronger attention, and an improved in-store experience.
What Businesses Actually Put On Those Digital Signage Screens
- Digital signage content is becoming less complicated than many businesses think.
- According to Juuno’s platform-reported data, 94% of businesses display images, so static visuals end up being the big go-to option.
- Video shows up on 44% of screens, and 26% feature social media and another 26% just run announcements.
- Canva designs stand at 15%, YouTube is reached on 7% of business screens, and weather info sits at 6.5%. This suggests the business not always need high-budget video production to run the display smoothly.
- According to Social media, Instagram is used by 23% of businesses, while YouTube is only 7%, X is 2.6%, and Facebook lands at 2.4%. This indicates that one in four businesses uses social content on their screens most of the time.
- The uploaded file formats match the simple pattern run by digital signage.
- PNG files make up 43% of uploads, JPEG follows at 36%, MP4 video is 14%, and PDF is 2%. Effective digital signage does not really depend on complex content.
- Strong images are still the base layer, while video and social content work more like supporting materials.
Digital Signage Consumer Behavior and Engagement
- Digital signage is gradually changing consumers’ attention to hold it in memory, and then actually react to businesses.
- The digital displays get around 400% more views than usual static setups, and the more dynamic material tends to hit an 83% recall rate.
- Roughly 76% of people walk into a store because the digital signage grabs their interest.
- The average dwell time becomes 2.6 times longer than what you’d see with static signage, not just slightly but noticeably.
- These displays can cut the feeling of waiting time by as much as 35% at service areas, making the whole experience seem more convenient.
- About 68% of consumers say digital signage steers what they end up buying, and when it’s video, it creates 47% higher engagement than static images.
- More than 74% of mobile users take some action after they’ve seen digital out-of-home campaigns.
- Digital signage can bridge visibility into trackable customer behavior, and some businesses report an average 31.8% sales boost.
Digital Signage Market Developments In 2026
- The worldwide digital signage market is still accelerating because companies are investing money into better customer engagement and more intelligent display technology.
- By 2026, the market is expected to reach about $34.7 billion, and this indicates the same pattern of steady enterprise spending across retail, hospitality, transport, and public spaces too.
- The biggest moves by digital signage right now are AI-driven content personalization, where organizations use algorithmic tools to push more relevant messaging toward the right viewers.
- Smart city efforts are also feeding demand, especially around transit terminals and other public infrastructure. Cloud-managed signage is getting a lot more common, since it lets teams keep an eye on screens, plan what goes live, and update everything from a remote place without too much hassle.
- More advertisers are looking at 4K commercial displays because they want sharper visuals and a more engaging look, and energy-efficient LED-backlit screens are getting more attention as well. Meanwhile, DOOH advertising keeps expanding, which is opening up more ways to roll out screens in retail sites, hotels, transit areas, and urban corners.
- The automated content distribution and day-to-day operational control are becoming easier with IoT and AI working together; that is why digital signage is becoming more than a communication tool and a real technology platform.
Future Outlook and Trends For 2026–2027
- Digital signage is turning into more measurable, automated, and reliable operations.
- One notable shift is the growing emphasis on content freshness, where vendors are expected to monitor how old the displayed content is, kinda as a performance score.
- As per 46.2% of surveyed operators say they plan to try AI within one year, while current adoption is only 8.3% right now. This suggests that it is a big jump in usage, especially for practical tasks like scheduling and video tooling rather than image creation.
- Another expected movement is more attention to unused or half-forgotten displays, sometimes called “dark screens.”
- Hardware dependability is increasing as operators evaluate the total cost of ownership (TCO) for low-cost devices.
- Companies may consistently rely on hardware groups rather than cheaper alternatives that create haphazard operational activities.
- Most operators are expected to find no meaningful return from signage in 2027.
- Meanwhile, cloud-based CMS adoption is forecasted to climb to a high-80% level across networks, which reinforces the shift toward centralized administration and remote control.
Conclusion
In 2026, digital signage is starting to feel like a more linked-up and measurable communication channel across retail, hospitality, transportation, healthcare, education, and a bunch of other areas. Market projections say it could reach about $52.7 billion by 2033, and at the same time, small rollouts still rule how people actually use it today. Browser-based setups are also cutting down the need for dedicated hardware, which makes things easier to start and scale, in a way.
Consumer and sales indicators basically point to the same idea: if the displays are thought through properly, they can boost visibility, improve engagement, and even nudge purchasing behavior. AI, cloud CMS platforms, 4K screens, and DOOH advertising are all taking part in that shift. The major problem is not deployment anymore, as it’s showing steady ROI, with relevant content and trustworthy measurement.
FAQ
In 2026, the global digital signage market is estimated at $34.7 billion.
Roughly 95% of businesses operate five or fewer screens.
Companies commonly report an average 31.8% boost in sales volume after switching to digital signage.
Digital screens can get around 400% more views, and dynamic content delivers an 83% recall rate.
AI adoption is at 8.3%, and 46.2% of operators say they plan to test AI within one year.

Sources