
Introduction
Edtech Statistics: Educational technology, also known as edtech or edutech, means using computers, software, and smart teaching ideas together to help people learn and teach better. It brings technology and education together to make learning easier and more effective. Over the last few decades, the educational industry has transformed a lot due to the implementation of advanced technology, such as virtual classrooms, AI-driven tutoring, gamified learning, and mobile applications.
EdTech is bridging gaps between educational institutions and students for accessing, personalising instruction, and preparing students for a technology-driven future. The online educational platform evolved mainly after COVID-19; now, Edtech is driving innovation, equity, and global collaboration in both formal and informal learning environments.
Editor’s Choice
- According to the market.us reports analysis, the global market size of Edtech is estimated to reach USD 266.1 billion by the end of 2025.
- In 2024, North America led the EdTech and Digital Literacy market with a 36.2% share, generating about USD 44.3 billion in revenue.
- During the same period, the Learning Management Systems (LMS) segment also took the lead, holding more than 36.4% of the market.
- The K-12 segment had a strong position, with a 42.7% share.
- Additionally, the Subscription-Based segment dominated, making up over 62.6% of the market.
- Holon IQ states that in July 2025, Duolingo, a language learning company based in the USA, will have reached a market valuation of USD 15 billion.
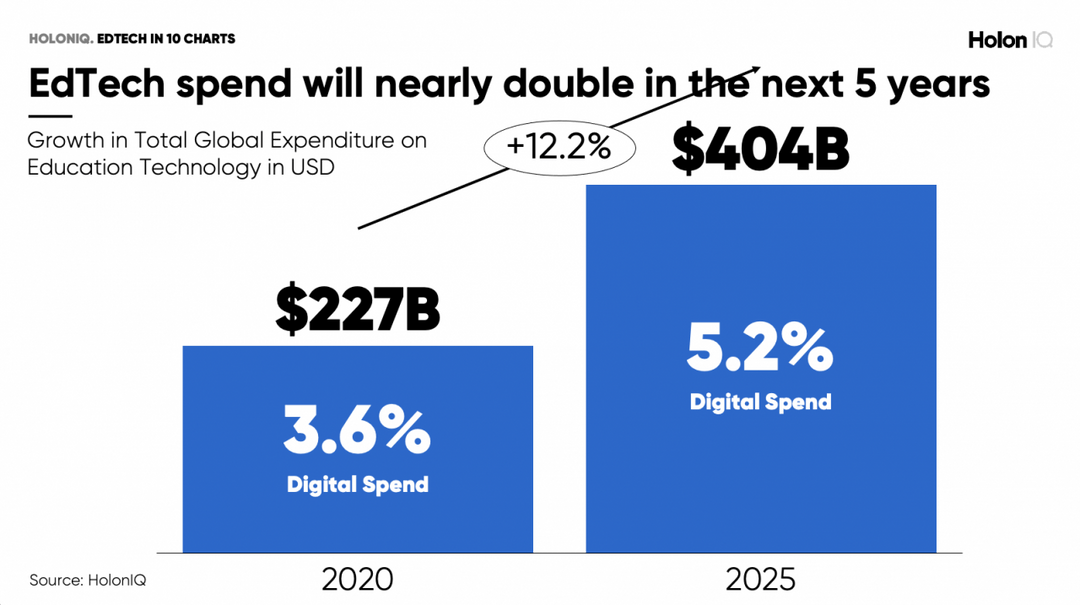
- Education lags in digital investment, with under 4% of total spending directed towards technology.
 (Source: website-files.com)
- In 2020, education spent USD 227B on digital, expected to reach USD 404B by 2025, but still under 5% overall.
- Venture capital investments play a key role; as of 2015, there were 10 education companies with market caps over USD 1 billion.
- It’s expected that by 2025, more than 100 education companies will be publicly listed and valued at over USD 1 billion.
- cdn.prod.website-files.com shows that in Q1 2025, EdTech funding reached USD 410 million, a sharp decline of 72% from USD 3.0 billion in 2023.
General Edtech Market Statistics
 (Source: shortpixel.ai)
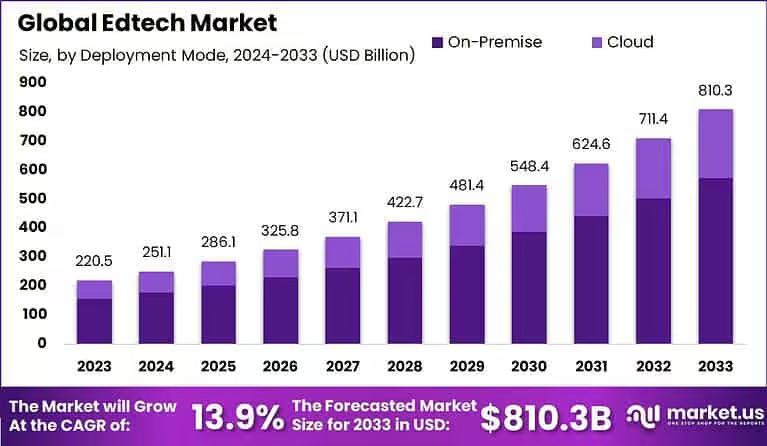
- The global market valuation of Edtech is estimated to reach USD 266.1 billion by the end of 2025, up from USD 251.1 billion in 2024.
- The market will grow at a CAGR of 13.9% from 2024 to 2033 and will reach up to USD 810.3 billion by 2033.
 (Source: valuates.com)
- As of 2024, the global market size of corporate e-learning accounted for USD 25,220 million and is estimated to reach around USD 57,050 million by 2031.
- The compound annual growth rate (CAGR) of 12.6% from 2025 to 2031.
- Exploding Topics further reports that the adaptive learning market is expected to grow and reach USD 9.11 billion by 2028.
 (Source: prnewswire.com)
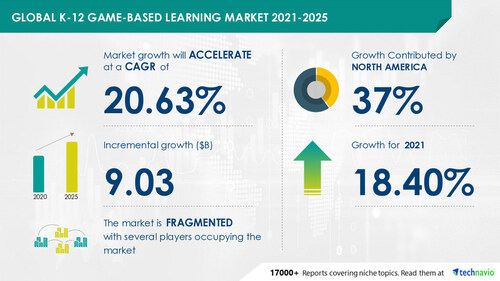
- The K-12 game-based learning market will grow by USD 9.03 billion between 2020 and 2025, with an annual growth rate of 20.63% CAGR.
- The market.us website further depicts that global spending on education is expected to hit USD 10 trillion by 2030.
- In the first nine months of 2024, the EdTech sector raised USD 278 million, showing a small 3% increase compared to USD 269 million in 2023.
- In the U.S., students who use devices for more than 60 minutes a week show better academic results.
- Research from Skillademia reveals that eLearning on EdTech platforms boosts information retention by 25% to 40%.
- Meanwhile, around 84% of learners engage more with gamified learning tools.
 (Reference: market.us)
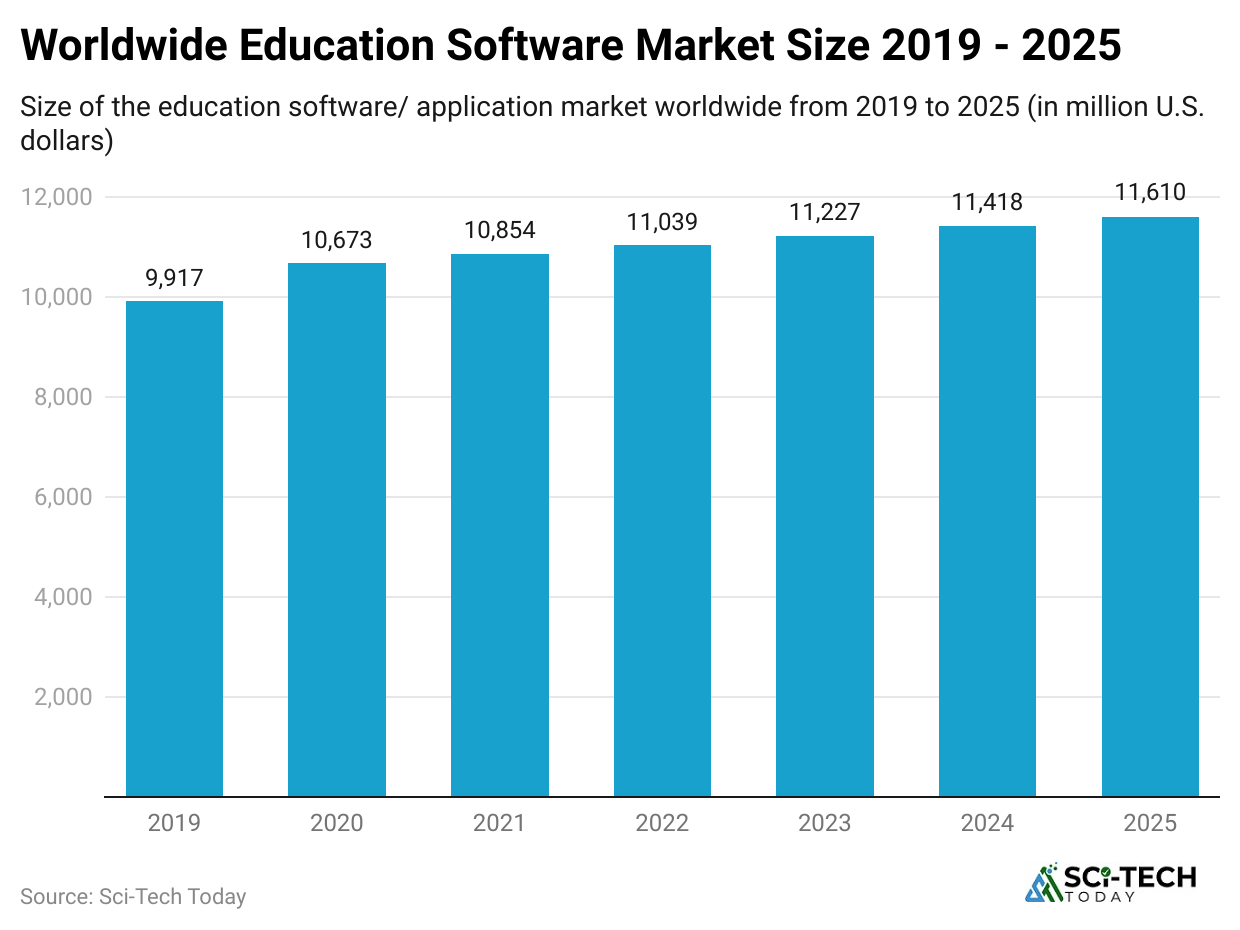
- The global market for education software and applications was valued at USD 11,418 million in 2024.
- By the end of 2025, it is expected to reach a revenue of USD 11,610 million.
United States Edtech Market Statistics
 (Reference: shortpixel.ai)
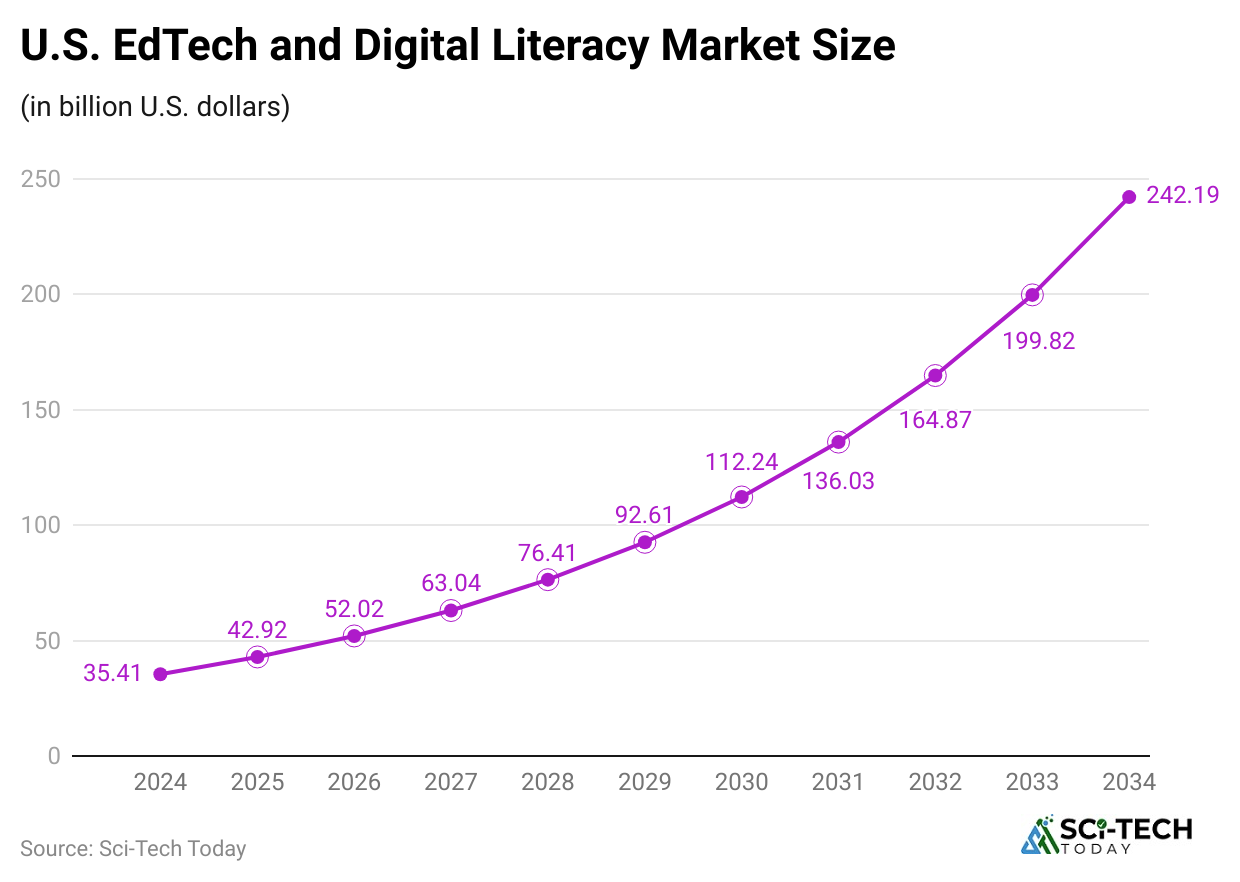
- As of 2024, the market size of the U.S. Edtech market is estimated to reach USD 35.41 billion and is estimated to reach up to USD 42.92 billion by the end of 2025.
- The growth rate of the market will reach a CAGR of 21.1% from 2025 to 2034, resulting in USD 242.19 billion by 2034.
- Furthermore, other market size of the United States in the coming years are followed as 2026 (USD 52.02 billion), 2027 (USD 63.04 billion), 2028 (USD 76.41 billion), 2029 (USD 92.61 billion), 2030 (USD 112.24 billion), 2031 (USD 136.03 billion), 2032 (USD 164.87 billion), and 2033 (USD 199.82 million).
Top 10 Features of EdTech Apps in 2025
- AI-powered personalised learning experiences
- Gamification features to increase student engagement
- Advanced analytics and performance tracking dashboards
- Microlearning modules for quick, focused learning
- Multilingual and inclusive learning options
- Offline access with smooth cloud syncing
- AR and VR to create immersive learning environments
- Integration with Learning Management Systems (LMS) and collaboration tools
- Strong privacy and security protections
- Freemium and flexible pricing options are available
Edtech Market Statistics by Sectors
- GII Global Information also states that K-12 leads the market with around 45.2% of market share in 2024.
- In the same duration, the higher education segment accounts for approximately 25% of the market, followed by corporate training, representing about 15%.
- Preschool and others comprise the remaining 15%, with increasing adoption of early learning tools and specialised educational content.
- A report published by Bluetree Digital shows that the global K-12 EdTech market is expected to grow to USD 123.2 billion by 2028, with a 16.3% annual growth rate.
- More than 70% of colleges plan to introduce online undergraduate programs within the next three years.
- The global EdTech market for higher education is projected to grow at a rate of 16.5% annually from 2021 to 2028, which is expected to reach USD 73.4 billion by 2028.
- The global corporate EdTech market is projected to grow to USD 123.6 billion by 2028, with a yearly growth rate of 15.2%.
- Currently valued at USD 27.5 billion, it is expected to double in the next five years.
By Type
 (Reference: bluetree.digital)
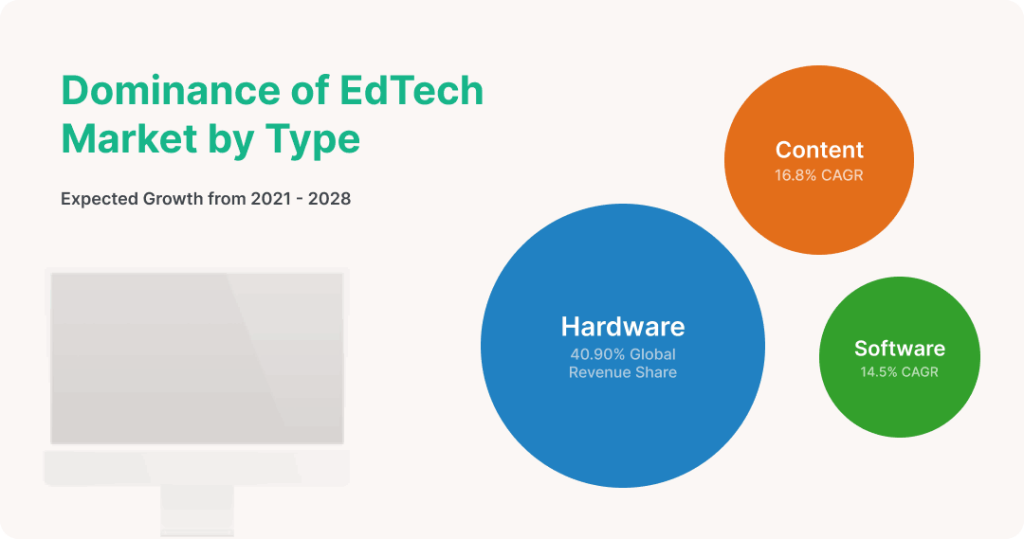
- Edtech Statistics shows that the hardware dominated the EdTech market, contributing over 40.90% to global revenue from 2021 to 2028.
- The software and content sectors are projected to grow at annual rates of 14.5% and 16.8%, respectively, in the same period.
By Development
 (Source: bluetree.digital)
- The cloud deployment sector is projected to expand at a rate of 16.2% annually from 2021 to 2028.
- Meanwhile, the on-premises deployment sector is expected to grow by 14.5% annually.
By Regions
- According to Cognitive Market Research, by the end of 2025, the North American region’s Etech market revenue will account for the highest sales, resulting in USD 80.536 billion.
- The market is estimated to reach around USD 250.879 billion by the end of 2033, with a growth rate of 15.3% from 2024 to 2033
Other regional analyses are mentioned in the table below:
| Region | 2025 (USD billion) | 2033 (USD billion) | CAGR (from 2025 to 2033) |
| Europe | 49.19 | 151.509 |
15.1% |
|
Asia Pacific |
40.018 | 131.49 | 16% |
| South America | 9.65 | 27.69 |
14.1% |
|
Middle East |
8.943 | 29.579 | 16.1% |
| Africa | 4.564 | 19.777 |
20.1% |
By Country
- The United States of Edtech market will account for the highest revenue sales of USD 64.39 billion by the end of 2025.
- The market is estimated to grow at a CAGR of 15% from 2025 to 2033, resulting in USD 196.571 billion by the end of 2033.
Furthermore, other countries’ expected revenue sales are stated in the table below:
| Country | 2025 (USD billion) | 2033 (USD billion) | CAGR (from 2025 to 2033) |
| Canada | 8.908 | 28.884 | 15.8% |
| Mexico | 7.237 | 25.423 | 17% |
| United Kingdom | 8.995 | 29.077 | 15.8% |
| Germany | 11.821 | 37.641 | 15.6% |
| France | 6.371 | 18.944 | 14.6% |
| Italy | 4.547 | 13.718 | 14.8% |
| Russia | 3.828 | 11.227 | 14.4% |
| Spain | 3.103 | 8.788 | 13.9% |
| Sweden | 2.626 | 7.272 | 13.6% |
| Denmark | 1.722 | 4.762 | 13.6% |
| Switzerland | 1.773 | 4.848 | 13.4% |
| Luxembourg | 1.885 | 5.391 | 14% |
| Rest of Europe | 2.518 | 9.841 | 18.6% |
| China | 14.025 | 47.056 | 16.3% |
| Japan | 7.865 | 24.729 | 15.4% |
| India | 4.232 | 14.787 | 16.9% |
| South Korea | 3.116 | 10.115 | 15.9% |
| Australia | 3.04 | 9.632 | 15.5% |
| Singapore | 1.523 | 4.875 | 15.7% |
| South East Asia | 2.465 | 9.069 | 17.7% |
| Taiwan | 1.281 | 4.734 | 17.8% |
| Rest of APAC | 2.47 | 6.492 | 12.8% |
| Brazil | 4.221 | 12.302 | 14.3% |
| Argentina | 1.343 | 3.987 | 14.6% |
| Colombia | 0.972 | 2.907 | 14.7% |
| Peru | 0.83 | 2.265 | 13.4% |
| Chile | 0.729 | 2.043 | 13.7% |
| Rest of South America | 1.555 | 4.186 | 13.2% |
| Saudi Arabia | 3.437 | 11.107 | 15.8% |
| Turkey | 1.72 | 5.508 | 15.7% |
| UAE | 1.775 | 6.178 | 16.9% |
| Egypt | 1.008 | 3.285 | 15.9% |
| Qatar | 0.614 | 2.051 | 16.3% |
| Rest of the Middle East | 0.389 | 1.45 | 17.9% |
| Nigeria | 1.821 | 8.241 | 20.8% |
| South Africa | 2.11 | 9.66 | 20.9% |
| Rest of Africa | 0.633 | 1.876 | 14.5% |
Global EdTech Funding Statistics
 (Source: website-files.com)
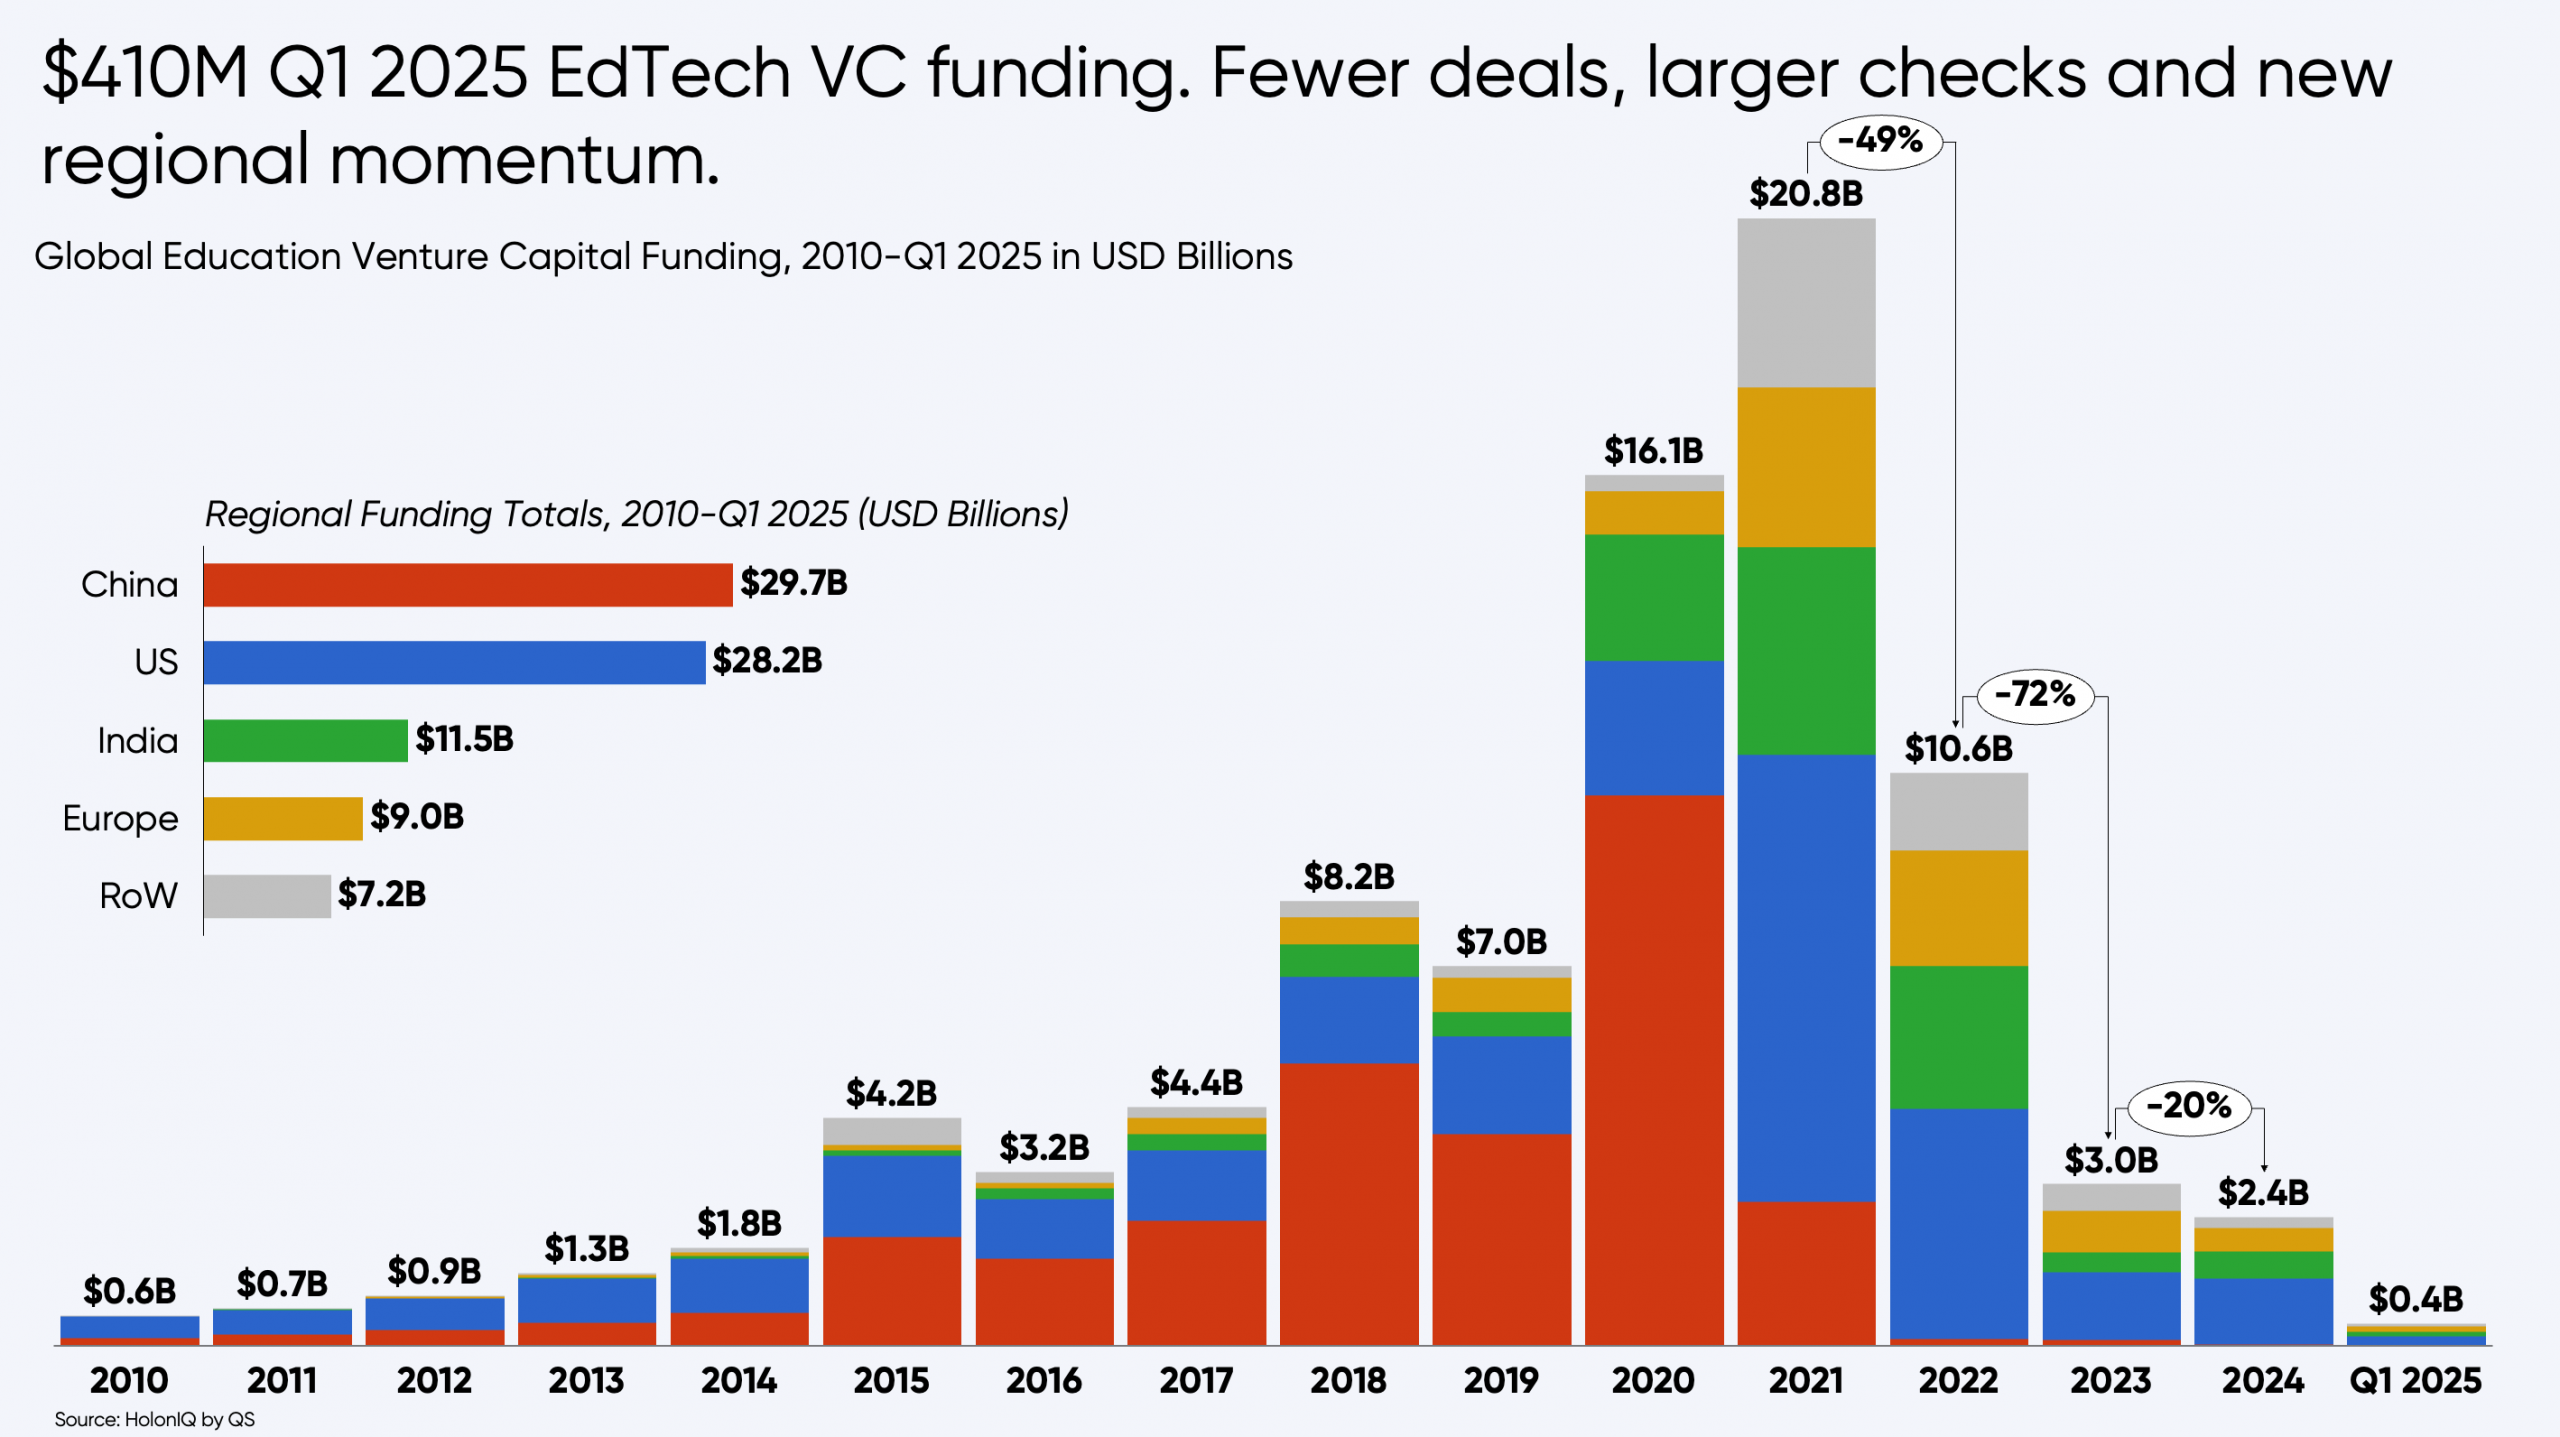
- In Q1 2025, EdTech funding reached USD 410 million, a sharp decline of 72% from USD 3.0 billion in 2023.
- From 2010 to Q1 2025, China has led in regional funding with USD 29.7 billion, followed closely by the U.S. at USD 28.2 billion.
- India secured USD 9.0 billion, while Europe and the Rest of the World (ROW) received USD 7.2 billion.
- A major boost occurred in 2021, when venture capital (VC) funding surged to USD 20.8 billion, showing a 49% growth from USD 16.1 billion in 2020.
E-Learning Market Statistics
- A report published by the classter.com website stated that the mobile learning market has secured around USD 88.12 billion in 2024, with a 28.9% increase from 2023.
- Moreover, by 2028, the market will reach USD 254.52 billion, growing at a CAGR of 30.4%.
- By 2028, the number of online learning users is expected to reach 1 billion.
- Countries like India, China, the Philippines, and Thailand are driving the growth, with more than 30% each year.
The table below includes the most popular study fields with shares of students using E-learning processes:
| Field of Study | Graduates | Undergraduates |
| Business | 23% | 21% |
| Health, nursing, & medicine | 19% | 20% |
| Computers & IT | 19% | 16% |
| Arts & Humanities | 9% | 11% |
| Science, Technology, Engineering, or Mathematics | 6% | 10% |
| Social Sciences, Criminal Justice, Law | 6% | 10% |
| Counselling, Human Services | 6% | 5% |
| Education & Teaching | 1% | 7% |
Edtech Use Cases Impacting Students’ Learning
 (Reference: elearningstats.education)
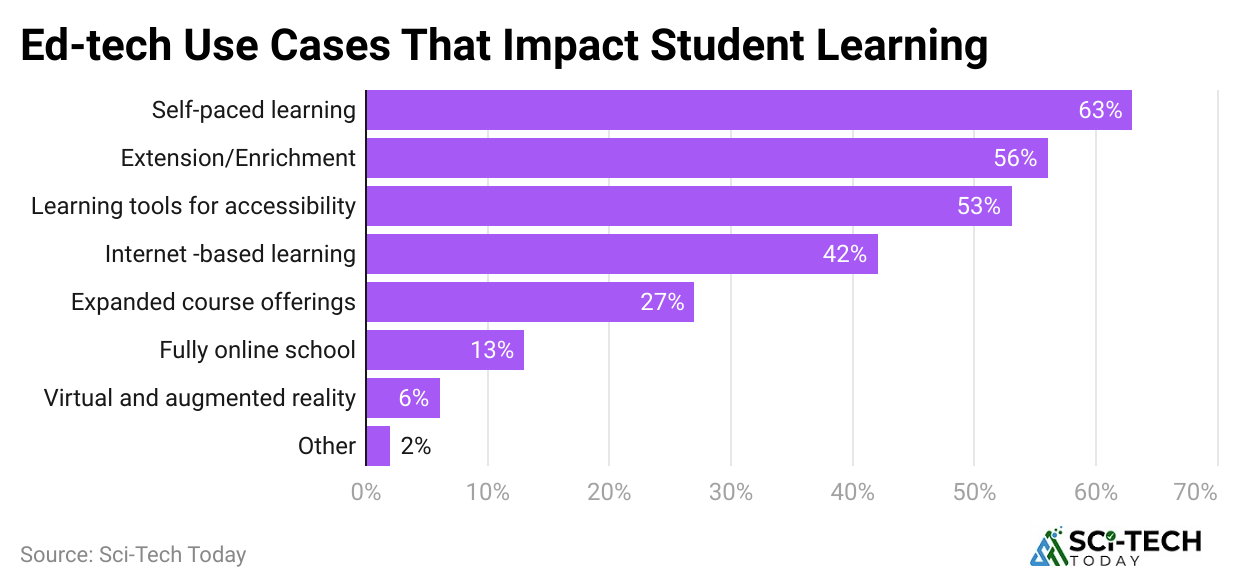
- As of 2024, in the United States, self-paced learning is the most popular, with 63% of students benefiting from it.
- Extension and enrichment tools follow closely, with 56% of students using them to deepen their learning.
- Learning tools designed for accessibility, such as those for visual or physical needs, are utilised by 53% of students.
- Internet-based learning is also common, affecting 42% of students.
- Additionally, 27% of students have access to expanded course offerings through EdTech.
- While only 13% of students are enrolled in fully online schools, virtual and augmented reality are still emerging, impacting 6% of learners.
- Finally, other EdTech applications are used by 2% of students.
Top Edtech Companies Statistics
- According to a report published by Holon IQ in December 2024, Speak, a language learning app, reached a valuation of USD 1 billion and joined the list.
- As of July 2025, Duolingo, a language learning company based in the USA, has reached a market valuation of USD 15 billion.
- In September 2024, Physics Wallah, an Indian EdTech platform, made a comeback with a valuation of USD 2.8 billion.
- Meanwhile, Byju’s had earned USD 22 billion in revenue, but was revalued to under USD 1 billion in January 2024.
The table below includes the total number of users/subscribers by different companies:
| Company | Users/Subscribers (million) |
| Coursera | 113 |
| Duolingo | 113.1 |
| Khan Academy | 18 |
| Chegg | 3.8 |
| Edmentum | 14 |
| Blackboard | 100 |
| BYJU’s | 150 |
| Google Classroom | 150 |
Edtech Statistics by Advanced Technology Adoption and Innovation
- According to Wifi Talents reports, more than 70% of college students regularly use EdTech tools.
- The use of AI-based learning platforms has grown by 50% over the last two years.
- Around 65% of K-12 students engage with EdTech daily.
- Over 70% of schools worldwide now use digital assessments. 55% of universities have added AI tools to their administration.
- Only 48% of online course providers offer mobile-friendly content.
- AI in assessments is expected to cut grading time by 50% by 2025.
 (Reference: website-files.com)
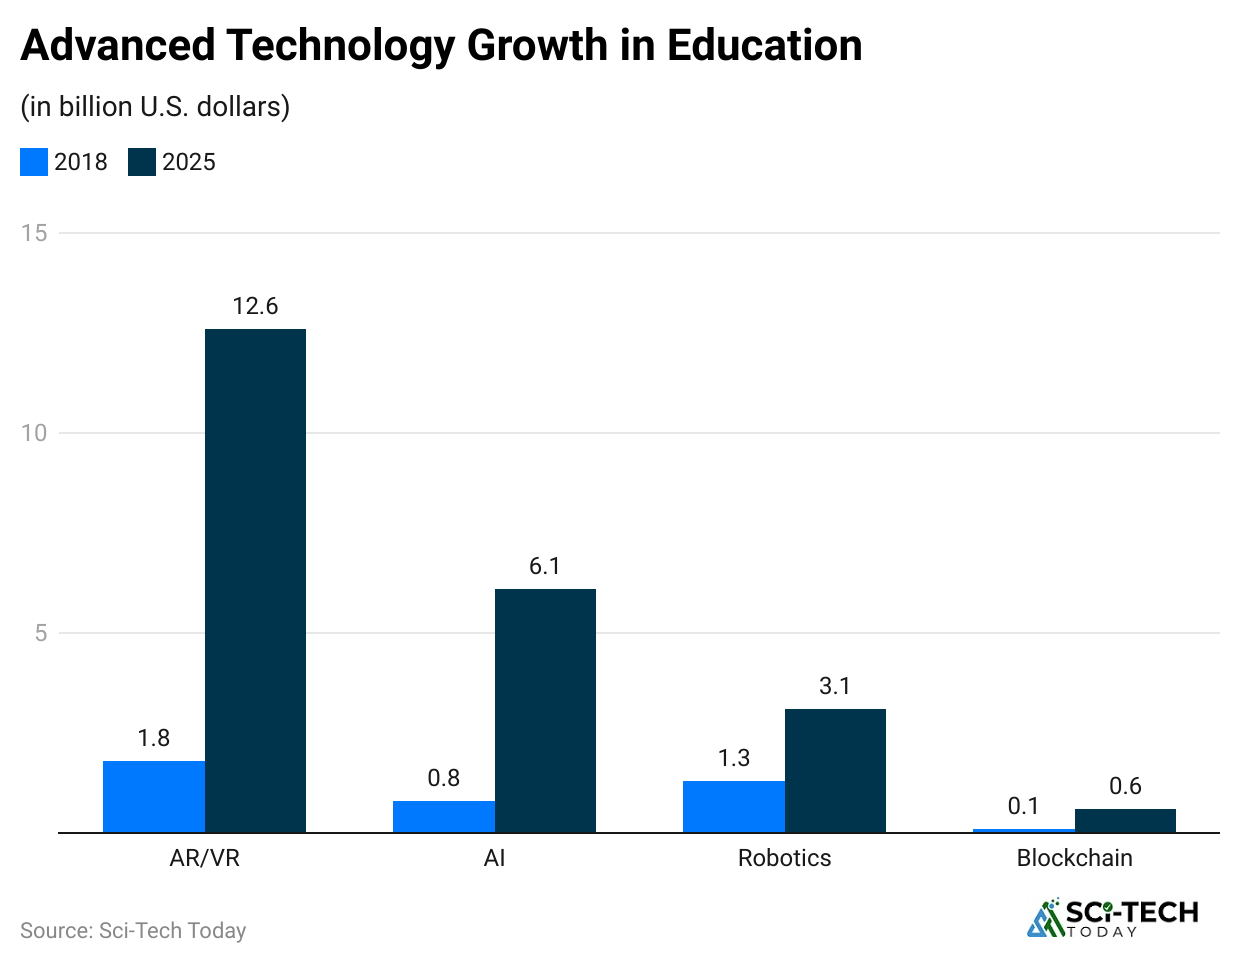
- The chart shows global education spending growth from 2018 to 2025, with Augmented Reality/Virtual Reality (AR/VR) leading from USD 1 billion to USD 12.6 billion.
- Artificial Intelligence (AI) follows with USD 0.8 billion in 2018 and is expected to grow to USD 6.1 billion by the end of 2025.
- Meanwhile, Robotics and Blockchain see smaller increases, reaching USD 3.1B and USD 0.6B, respectively, by the end of 2025.
By User Engagement and Satisfaction
- Wifi Talents reports further depict that around 85% of teachers think EdTech helps boost student engagement.
- Gamification in EdTech increases motivation by 30%, while online learning has a 25% retention rate, and traditional classrooms see 58%.
- Nearly 45% of students say EdTech makes tough subjects easier to learn.
- Edtech Statistics also show that almost 80% of students prefer personalised learning with EdTech, and 60% of teachers feel it improves their teaching.
- Education leaders cite cost reduction, engagement, and scalability as key reasons for adopting EdTech, with 78% supporting this.
- Around 60% of corporate workers use online learning for skill development.
Online Education Revenue Statistics
 (Reference: classter.com)
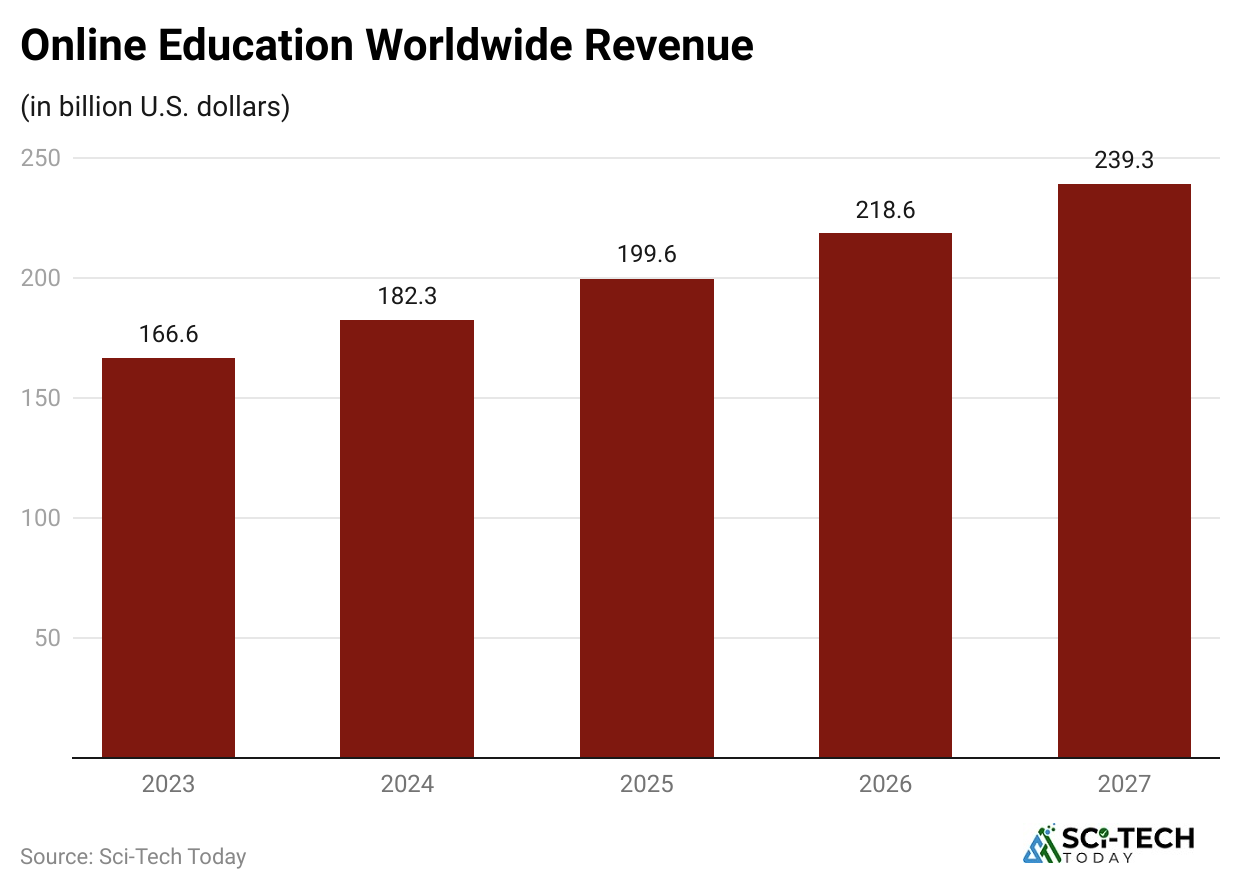
- The global online education revenue has resulted in USD 166.6 billion in 2023, and in 2024, the revenue accounted for USD 182.3 billion.
- In the coming years, the online education revenue is expected to reach USD 199.6 billion by 2025, followed by USD 218.8 billion (2026), and USD 239.3 billion (2027).
Edtech Website Traffic Analysis
 (Reference: similarweb.com)
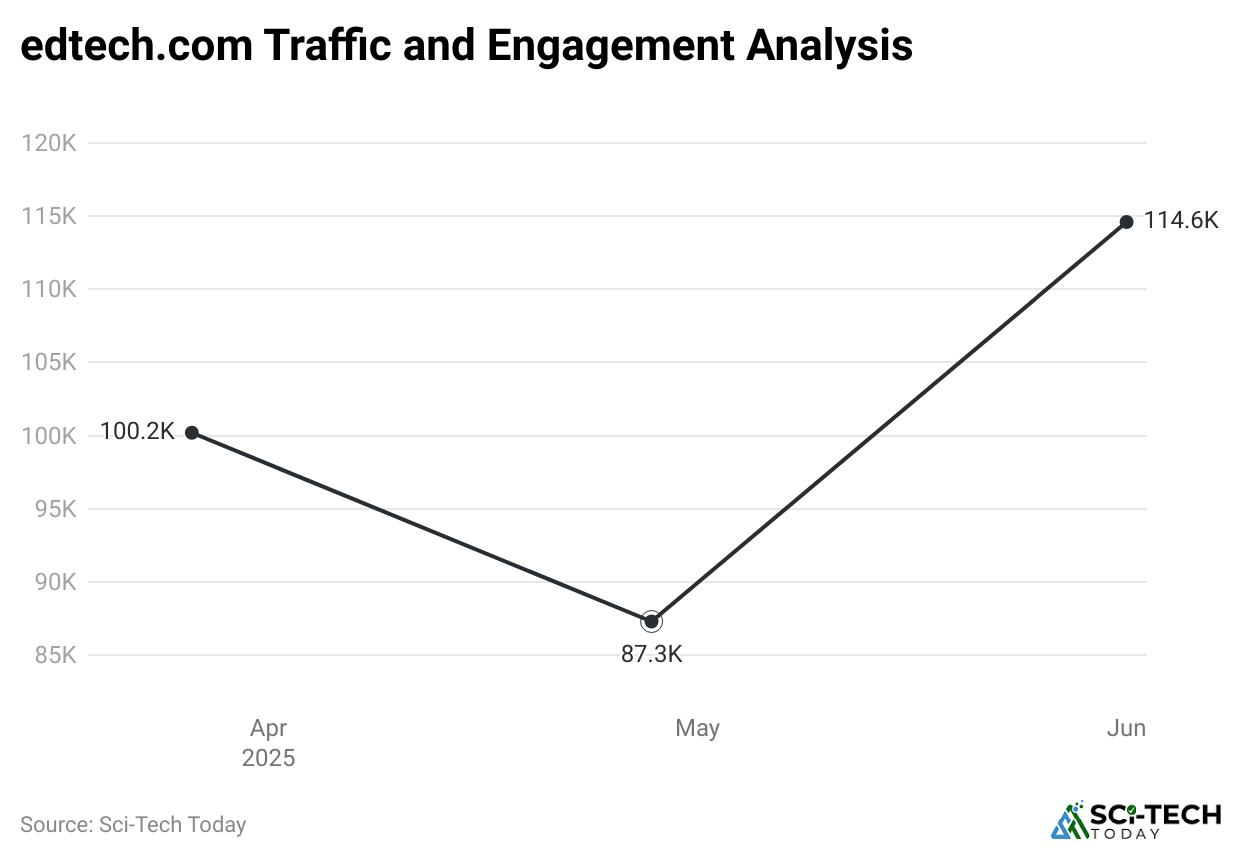
- edtech.com website holds a global rank of #224,770, with a country rank of #57,043 in the United States and category ranked #109.
- As of June 2025, this website has accounted for 114.6K visits (up by 31.23% from last month), with a relatively low bounce rate of 36.84%.
- Meanwhile, the website is viewed an average of 5.47 pages per visit and spends approximately 4 minutes and 42 seconds on the site during each visit.
By Country
 (Reference: similarweb.com)
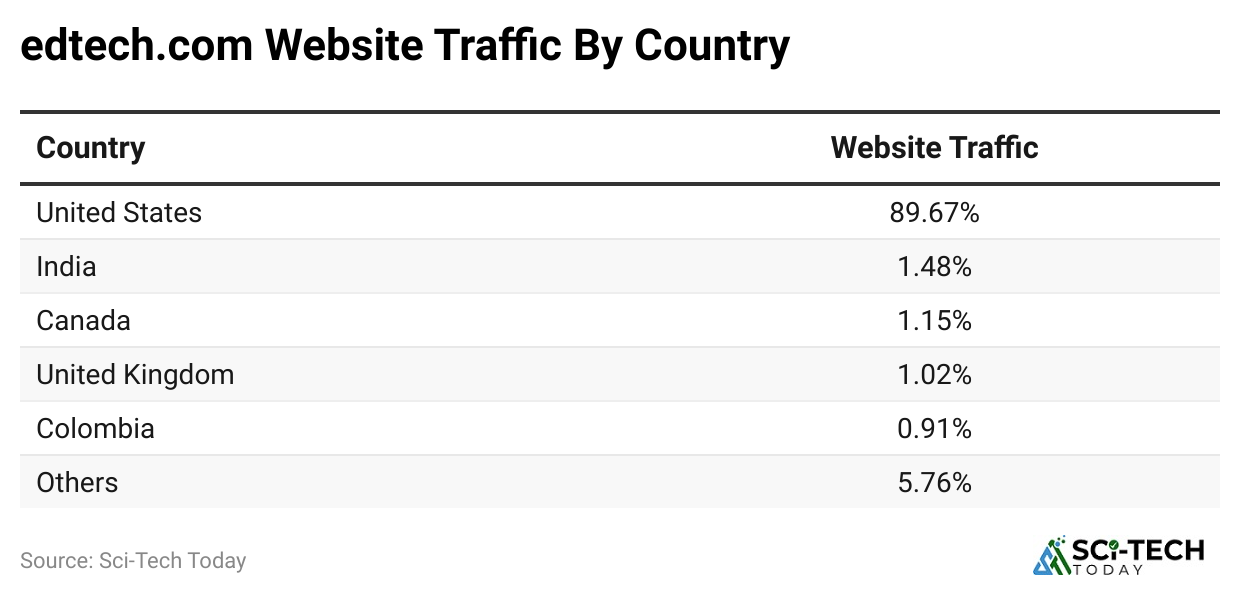
- In June 2025, the United States of America accounted for the largest traffic share on edtech.com, with 89.67%, an increase of 40.91% compared to the previous month.
- The next top four countries by website traffic share were: India with 1.48% (down by 21.19%), Canada at 1.15% (down by 11.45%), the United Kingdom at 1.02% (down by 16.59%), and Colombia at 0.91% (down by 21.51%).
- The remaining countries accounted for 5.76% of edtech.com’s website traffic.
By Demographics
 (Reference: similarweb.com)
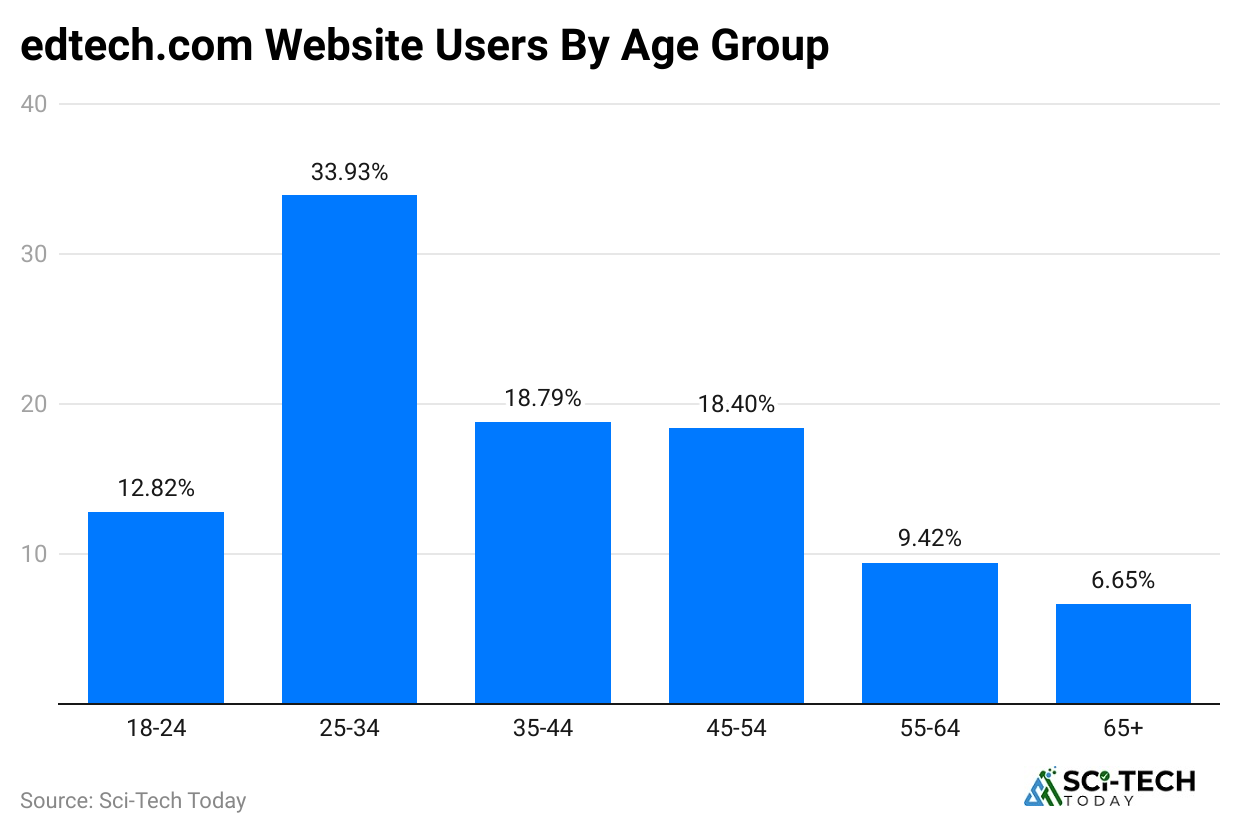
- In the same period, the largest group of edtech users was between 25 and 34 years old, making up 33.93% of users.
- Meanwhile, the second-largest group was 35 to 44 years old at 18.79%.
- The remaining age groups were: 45 to 54 years (18.4%), 18 to 24 years (12.82%), 55 to 64 years (9.42%), and 65+ years (6.65%).
- As of June 2025, almost 60.36% of Edtech users were male, while 39.64% were female.
By Marketing Channels Distribution
 (Reference: similarweb.com)
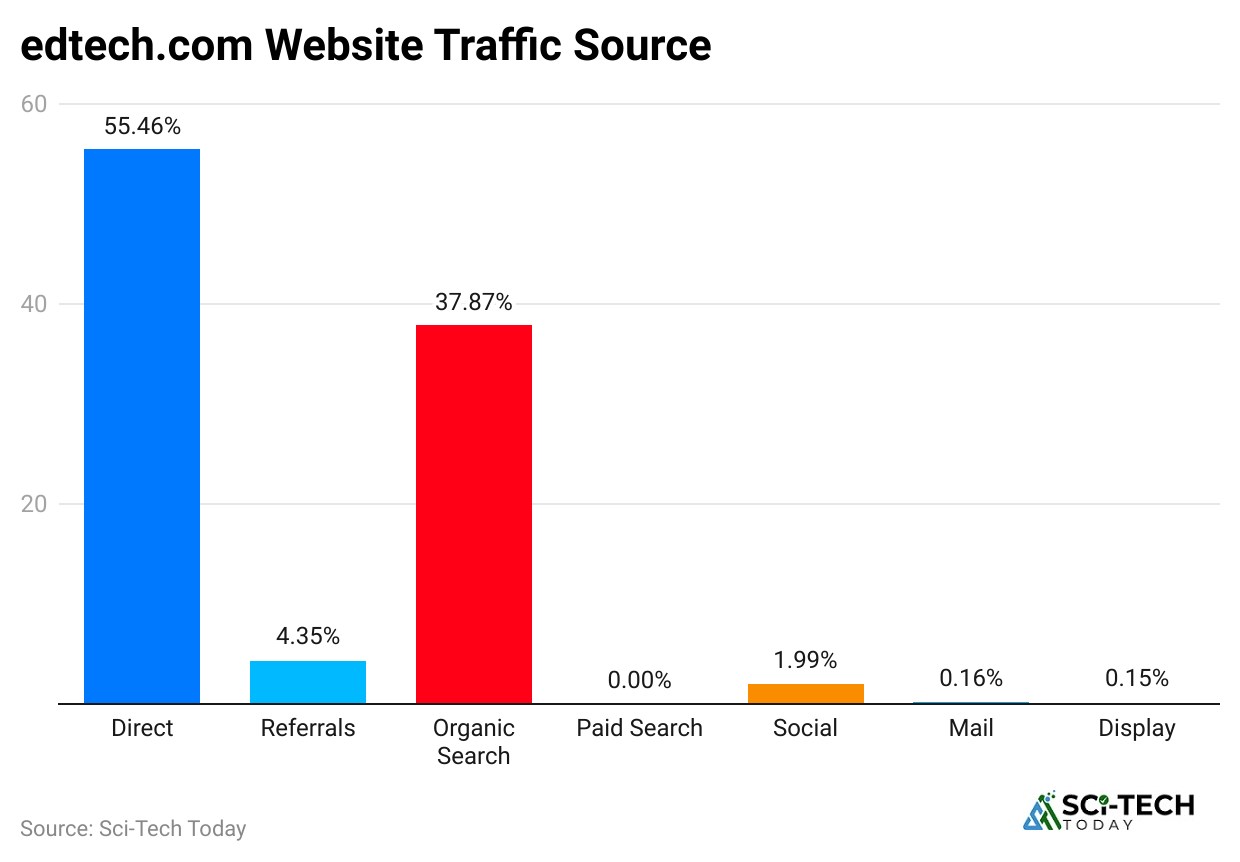
- The top traffic sources for the Edtech website were captured by direct search with a traffic share of 55.46%, followed by organic search (37.87%).
- Besides, Referrals and Social channels accounted for a traffic share of 4.35% and 1.99%, respectively.
- Lastly, other marketing channel distributions are followed by mail (0.16%) and display (0.15%).
By Social Media
 (Reference: similarweb.com)
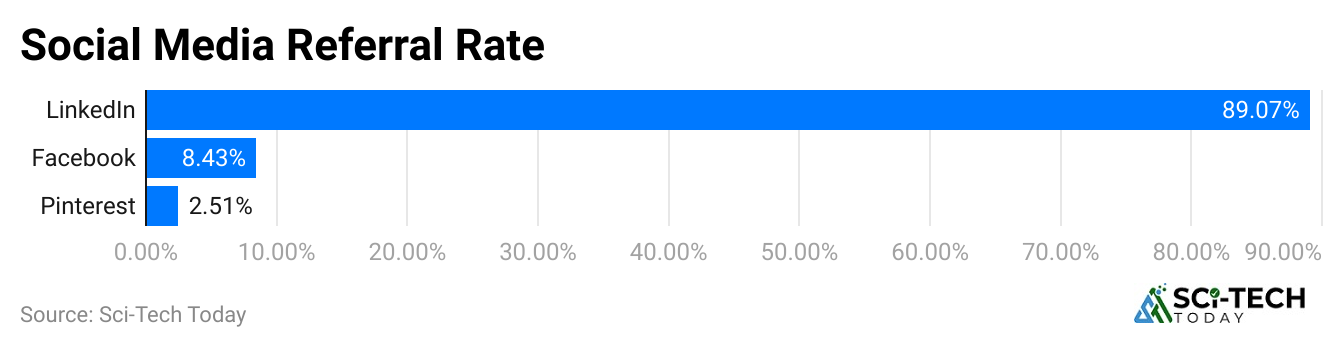
- As of June 2025, the social network traffic accounted for by edtech.com remained the highest on LinkedIn, holding shares of 89.07%.
- Other social media traffic sources include Facebook (8.43%) and Pinterest (2.51%)
World’s Top 10 EdTech Companies of 2025
- A TIME Magazine report published in 2025 states that around 350 of the best EdTech companies worldwide are reviewed, based on data from over 7,000 firms.
- The United States led the list with 138 top EdTech companies, making up 39.4% of the total.
- India followed with 33 companies, which were 9.4% of the list.
- China came in third, contributing 23 companies, or 6.6% of all those featured.
| Company (Headquarters) | Score |
| Codemao (China) | 99.8% |
| Youdao (China) | 98.7% |
| TAL Education (China) | 95.7% |
| Headway Inc (Cyprus) | 95.7% |
| Xiaohe (China) | 95.6% |
| Meishubao (China) | 95.5% |
| Aixuexi (China) | 95.2% |
| Ten Thousand Coffees (Canada) | 94.4% |
| Arduino (Italy) | 93.9% |
| Stepful (United States) | 93.8% |
K-12 EdTech Market Statistics
 (Source: shortpixel.ai)
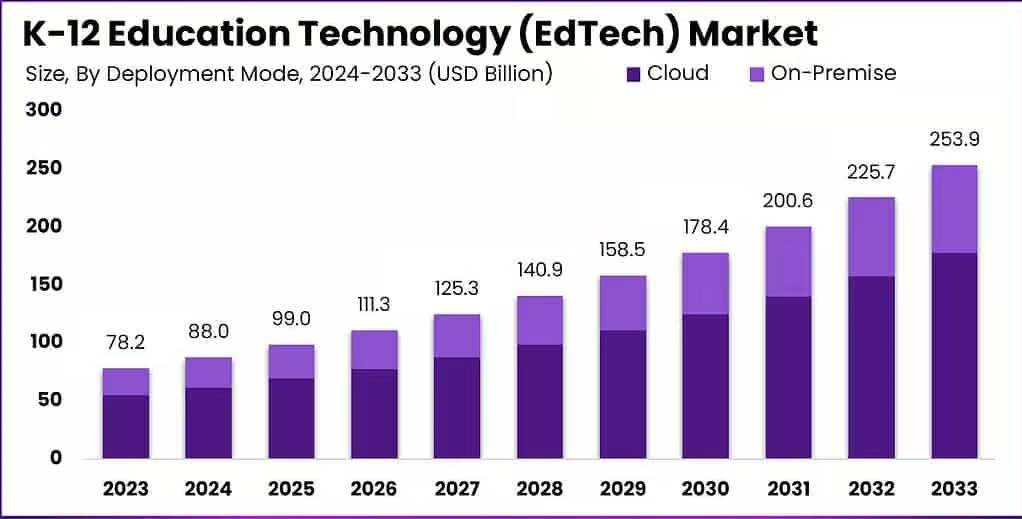
- The global market size of K-12 Educational Technology is estimated to reach around USD 99 billion by the end of 2025, increasing from USD 88 billion in 2024.
- By the end of 2033, it is estimated to reach around USD 253.9 billion, with a CAGR of 12.5% from 2024 to 2033.
Generative AI in Edtech Statistics
 (Source: market.us)
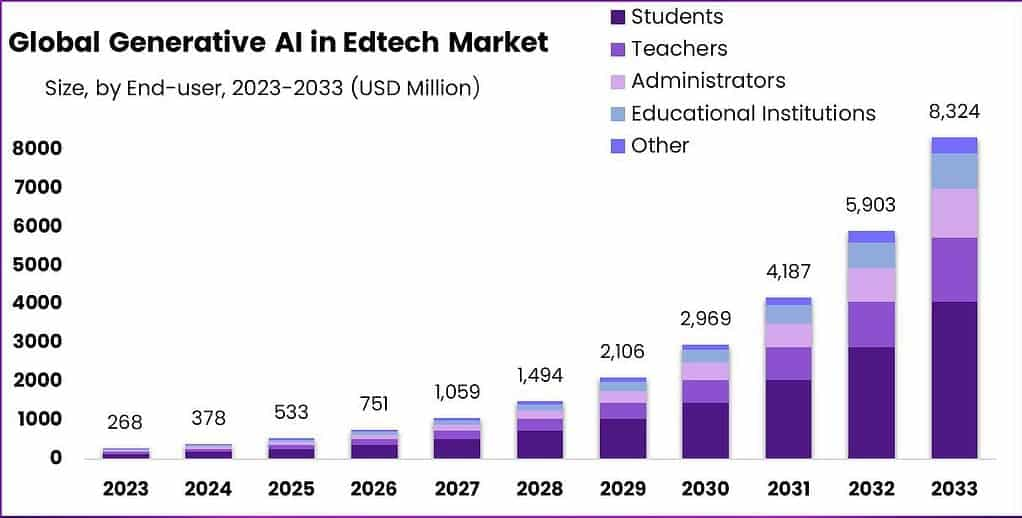
- The Global Generative AI in EdTech market is projected to reach USD 8,324 million by 2033, up from USD 378 million in 2024.
- By 2025, the market valuation is expected to make up around USD 533 million.
- This growth is expected at a rate of 41% CAGR between 2024 and 2033.
| Metrics | Market Share / Valuation |
| Market share of adaptive learning | 39% (2023) |
| Student market share | 49% (2023) |
| Generative AI market in North America | USD 39.1 million (2023) |
| Organisations boosting investment in Generative AI | 50% |
| Growth in personalised learning & adaptive tutoring | 32% (2023) |
| Reduction in content creation time & cost | 25% (2023) |
| Language learning & translation applications | 18% (2023) |
| VR/AR learning applications | 22% (2023) |
| Growth in grading & assessment applications | 15% (2023) |
| Growth in personalised career advice & Skill-building | 28% (2024) |
| Game-based learning applications | 20% (2023) |
| Institutions considering AI for admin tasks | 45% (2023) |
| EdTech companies adopting generative AI | 60% (2024) |
| Language Translation & Accessibility Features | 18% (2023) |
AI in Edtech Market Statistics
 (Source: shortpixel.ai)
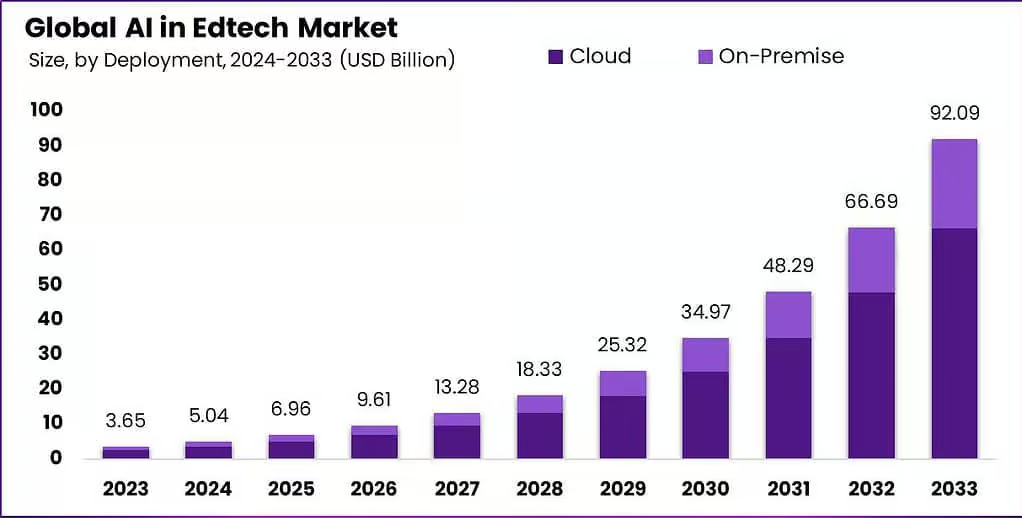
- The Global AI in EdTech Market is projected to reach USD 92.09 billion by the end of 2033, up from USD 6.96 billion in 2025.
- Meanwhile, the market is growing at an annual rate of 38.1% from 2024 to 2033.
| Metrics | Market Share / Valuation |
| Cloud segment | 72% (2023) |
| Personalised learning segment | 43% (2023) |
| Corporate training centres segment | 45% (2023) |
| North America | 37% (2023) |
| Schools & Universities Using AI | Over 50% (2023) |
| AI education market | USD 22 billion by 2029 |
| AR and VR in the Education Market | USD 75 billion by 2033 |
Edtech and Smart Classroom Market Statistics
 (Source: shortpixel.ai)
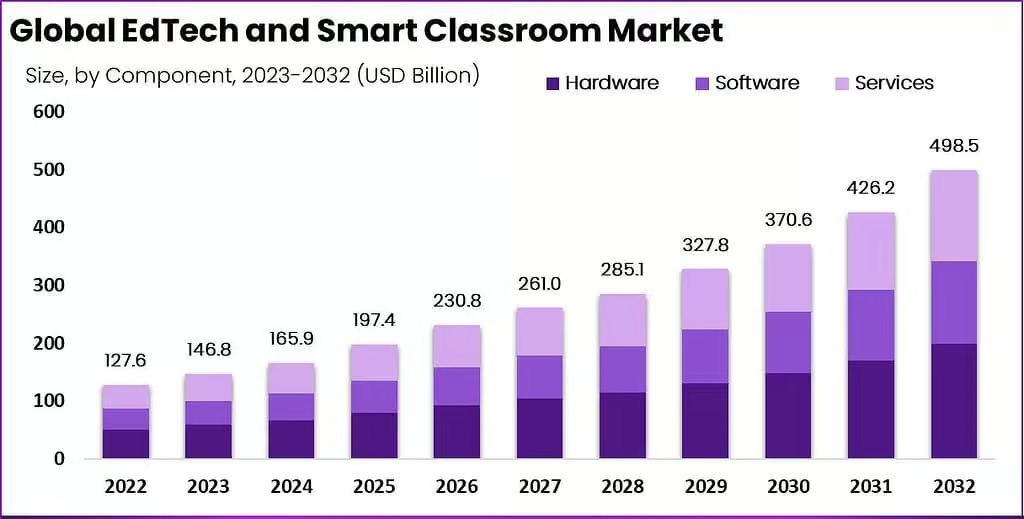
- By the end of 2025, the market size of Edtech and Smart Classroom is estimated to reach around USD 197.4 billion.
- It is also estimated that the market will grow to USD 498.5 billion by 2032, with a growth rate of 15% from 2022 to 2032.
| Metrics | Share / Valuation |
| Teachers who find EdTech important/essential | 86% |
| Teachers who believe EdTech boosts student engagement | 96% |
| College students who say digital learning improved their grades | 81% |
| Teachers see increased student interest in EdTech | 96% |
| Google Classroom users globally | 100 million |
| U.S. spending on remote learning devices & internet | USD 7 billion |
| Teachers in the UK are using EdTech apps/resources | 60% |
Effectiveness of Edtech Statistics by Technology
| Effectiveness | Respondents Share |
| On-the-job learning | 90% |
| Mentoring & coaching | 83% |
| Instructor-led training | 78% |
| Formal curriculum | 60% |
| Videos | 57% |
| Online simulation games | 54% |
| Virtual instructor-led training | 52% |
| e-Learning courses | 44% |
| Podcast | 35% |
| Augmented reality | 30% |
| Virtual reality | 29% |
| Social collaboration | 23% |
| Mobile device notifications | 20% |
Top 10 Benefits and Challenges Faced by Edtech
| Benefits | Challenges |
|
|
Conclusion
After completing the article on Edtech Statistics, EdTech is a transforming educational platform that allows for enhancing engagement, personalising learning, and improving teaching effectiveness. As technology is evolving with time, it is thus providing new opportunities for both students and educators to thrive.
The growing adoption of EdTech tools, driven by factors such as cost efficiency, scalability, and increased student motivation, signals a bright future for digital learning. In contrast, with continuous innovation and a focus on accessibility, EdTech has the potential to reshape the educational landscape and equip learners for success in the digital age.
