Quick Overview
Buy now, pay later statistics: The financial landscape is fundamentally changing, driven by a simple, often interest-free payment option: Buy now, pay later. To be precise, this is a system where consumers instantly split a purchase into four easy installments, typically over six weeks.
This model is rapidly replacing traditional credit for a new generation wary of high-interest debt, creating a change in spending. What began as a convenient e-commerce tool has now exploded into a global financial giant, expanding from clothing and electronics to everyday essentials.
In 2025, we are tracking a global market projected to process over USD 900 billion in transactions. However, this explosive growth has a catch. Beneath this convenience, significant risks are emerging regarding rising consumer debt and hidden loan stacking.
In this article, I’d like to discuss and deliver the essential data and provide the most current, detailed statistics on the buy now pay later feature, covering its true market size, user demographics, retail impact, and the critical figures on consumer delinquency and financial risk. I think I have talked enough. Without further ado, let’s get into the article.
Editor’s Top Selections
- The Global Gross Merchandise Volume (GMV) for BNPL is forecasted to reach USD 911.8 billion by 2030.
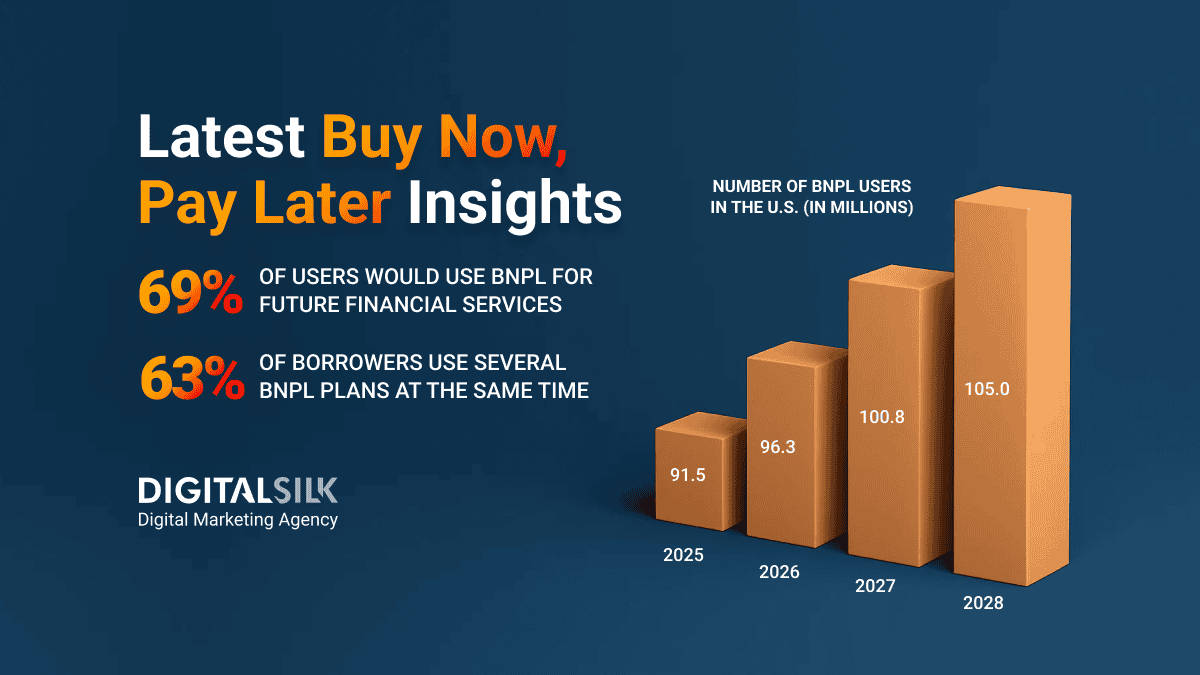
- An estimated 5 million Americans utilized BNPL services in 2024, with that number climbing toward 105 million by 2028.
- Retailers report an Average Order Value (AOV) uplift ranging from 15% to 40% when offering BNPL.
- A concerning 41% of users reported paying late on at least one BNPL loan in the past year, up from 34% the previous year.
- Approximately 50% of Millennials use the service, with Gen Z adoption projected to climb at a powerful 1% CAGR.
- 63% of BNPL borrowers are managing multiple simultaneous loans, demonstrating widespread loan stacking.
- A significant 61% of the U.S. BNPL borrowers fall into the subprime or deep subprime credit score categories.
- The online segment accounted for more than 59% of the BNPL market in 2025, showing that most consumers prefer using BNPL services for e-commerce purchases.
- The necessary market for BNPL Fraud Prevention (BNPLFP) is projected to surge more than 5x, growing from USD 4.5 billion in 2025 to an expected USD 25.9 billion by 2034.
The Evolution of Buy Now Pay Later
(Source: digitalsilk.com)
- The true historical roots of the BNPL model can be traced all the way back to the 1840s with Singer Sewing Machines, which pioneered the “dollar down, dollar a week” installment plan to make expensive items accessible to working-class consumers.
- The more traditional “layaway” model, popular from the 1930s to the 1990s, required consumers to pay in installments before receiving the product, a complete reversal from the instant gratification of today’s digital Buy Now Pay Later services.
- The modern era of BNPL was truly unlocked by digital fintech firms in the 2010s, moving the installment concept from the physical store to the frictionless environment of the online checkout.
- Before the rise of modern BNPL, consumers with thin credit files or lower credit scores faced limited options, which is a significant factor in why 61% of current U.S. BNPL borrowers fall into the subprime or deep subprime categories.
- The COVID-19 pandemic accelerated the adoption of Buy Now Pay Later, as global e-commerce grew rapidly, with a corresponding surge in demand for flexible, digital, and interest-free credit options for online shopping.
| Historical Precedent | 1840s (Singer Sewing Machines) |
| Market Trigger | From “layaway” (pay then receive) to BNPL (receive now, pay later) |
| Subprime Usage | 61% of U.S. users are in subprime/deep subprime credit score categories |
| Adoption Accelerator | The COVID-19 pandemic and subsequent e-commerce boom |
Buy Now Pay Later Market Size
(Source: market.us)
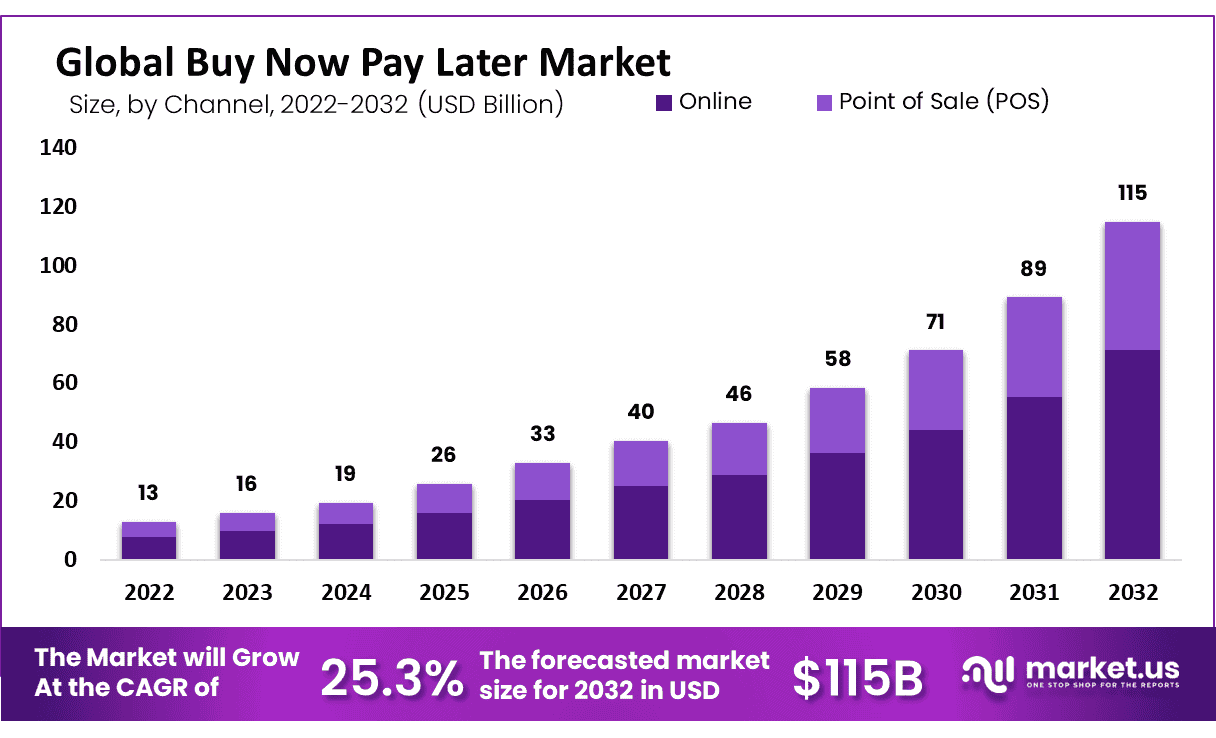
- The global Buy Now Pay Later market is projected to reach around USD 115 billion by 2032, rising from USD 16 billion in 2023, with a strong annual growth rate of 25.3% between 2023 and 2032.
- In 2022, North America led the market with more than a 32% share, recording revenues of about USD 4.6 billion from BNPL services.
- A February 2023 survey by Forbes Advisor revealed that only 9% of Americans still use cash for purchases, while 54% prefer debit and credit cards, showing a clear move toward digital payment methods.
- During the 2023 Amazon Prime Day Sale, Adobe Analytics data showed a 20% rise in the use of Buy Now Pay Later options compared with the previous year, indicating higher consumer interest in flexible payments.
- The U.S. Federal Reserve reported that credit card usage stands at 21%, and merging BNPL services with credit card systems could raise U.S. credit limits to nearly USD 1.28 trillion by 2025, providing banks with new opportunities.
- According to Bank of America Corp., the BNPL market could grow 10 to 15 times by 2025, reflecting strong confidence in the expansion of digital installment payment options.
- The online segment accounted for more than 59% of the BNPL market in 2025, showing that most consumers prefer using BNPL services for e-commerce purchases.
- Large enterprises held over 62% of the BNPL market share in 2025, as they increasingly adopted flexible payment plans to attract and retain customers.
- The retail sector represented more than 75% of the market in 2025, confirming that retailers are actively promoting BNPL options to increase sales and consumer affordability.
| Market Growth | $16 Billion to $115 Billion (2023 to 2032) |
| Dominant Channel | Online Segment: 59% Share (2022) |
| Leading Sector | Retail Segment: 75% Share (2022) |
| Leading Region | North America: 32% Share (2022) |
| Corporate Adoption | Large Enterprises: 62% Share (2022) |
| Consumer Shift | 9% of Americans use Cash (Feb 2023) |
| Growing Preference | 20% Increase in BNPL Use (2023) |
The Rise of Fraud and Security
(Source: market.us)
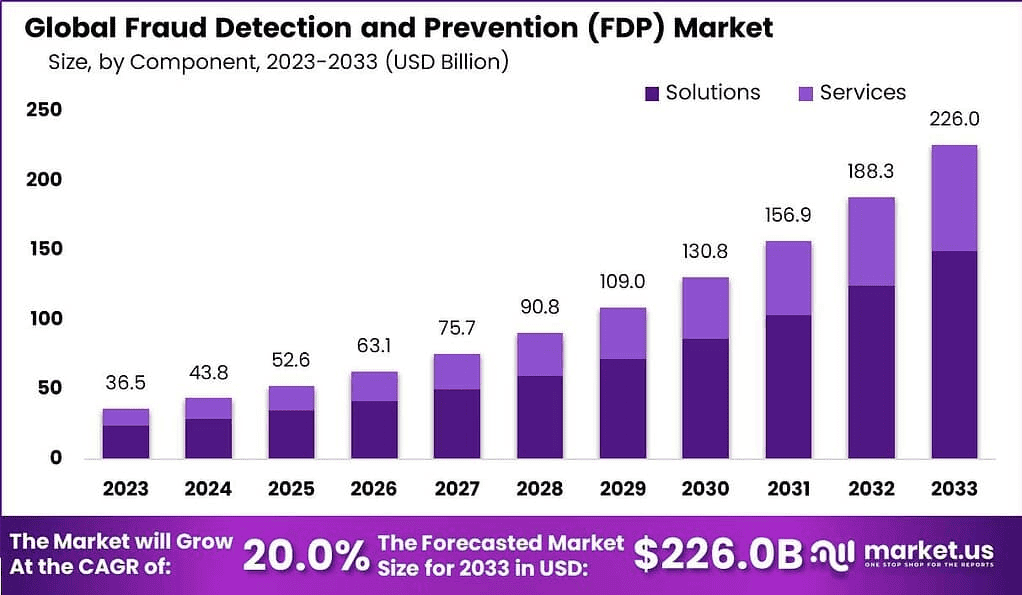
- The necessary market for BNPL Fraud Prevention (BNPLFP) is projected to surge more than 5x, growing from USD 4.5 billion in 2025 to an expected USD 25.9 billion by 2034.
- With its rapid adoption, North America accounted for 40.6% of the global BNPLFP market revenue in 2024 (approx. $1.5 billion).
- The highest risk area for BNPL providers in 2024 was new account abuse, which represented 28.8% of fraud prevention efforts.
- With a substantial 55.8% of Americans using BNPL services, roughly 181 million individuals are potential targets for fraud, making the security of these platforms a massive public concern.
- In 2024, the “solutions” segment (including AI monitoring and identity verification) held 70.5% of the fraud prevention market, demonstrating the technical complexity required for protection.
- A shocking 45% of BNPL users admit to reusing the same login credentials, effectively handing fraudsters the keys to their accounts across multiple platforms.
- 22% of users reported unknowingly signing up for fraudulent BNPL accounts.
- While 20% experienced an account takeover, highlighting the success of sophisticated phishing and identity theft scams.
| Market Growth | $4.5 Billion to $25.9 Billion (2025 to 2034) |
| Leading Region | North America: 40.6% Share (2024) |
| Dominant Solution | Solutions Segment: 70.5% Share (2024) |
| Deployment Preference | On-Premise: 57.3% Share (2024) |
| Top Fraud Risk | New Account Abuse: 28.8% Share (2024) |
| Consumer Exposure | 181 Million Individuals at Risk |
| User Risk Factor | 45% of Users Reuse Passwords |
Buy Now Pay Later User Adoption and Demographics
(Reference: scoop.market.us)
- By the end of 2027, the number of global Buy Now Pay Later users is projected to exceed 900 million, reflecting a massive surge of 157% from the approximately 360 million users recorded in 2022.
- In the U.S. alone, an estimated 86.5 million individuals utilized BNPL services in 2024, and this number is expected to climb to nearly 105 million users by 2028.
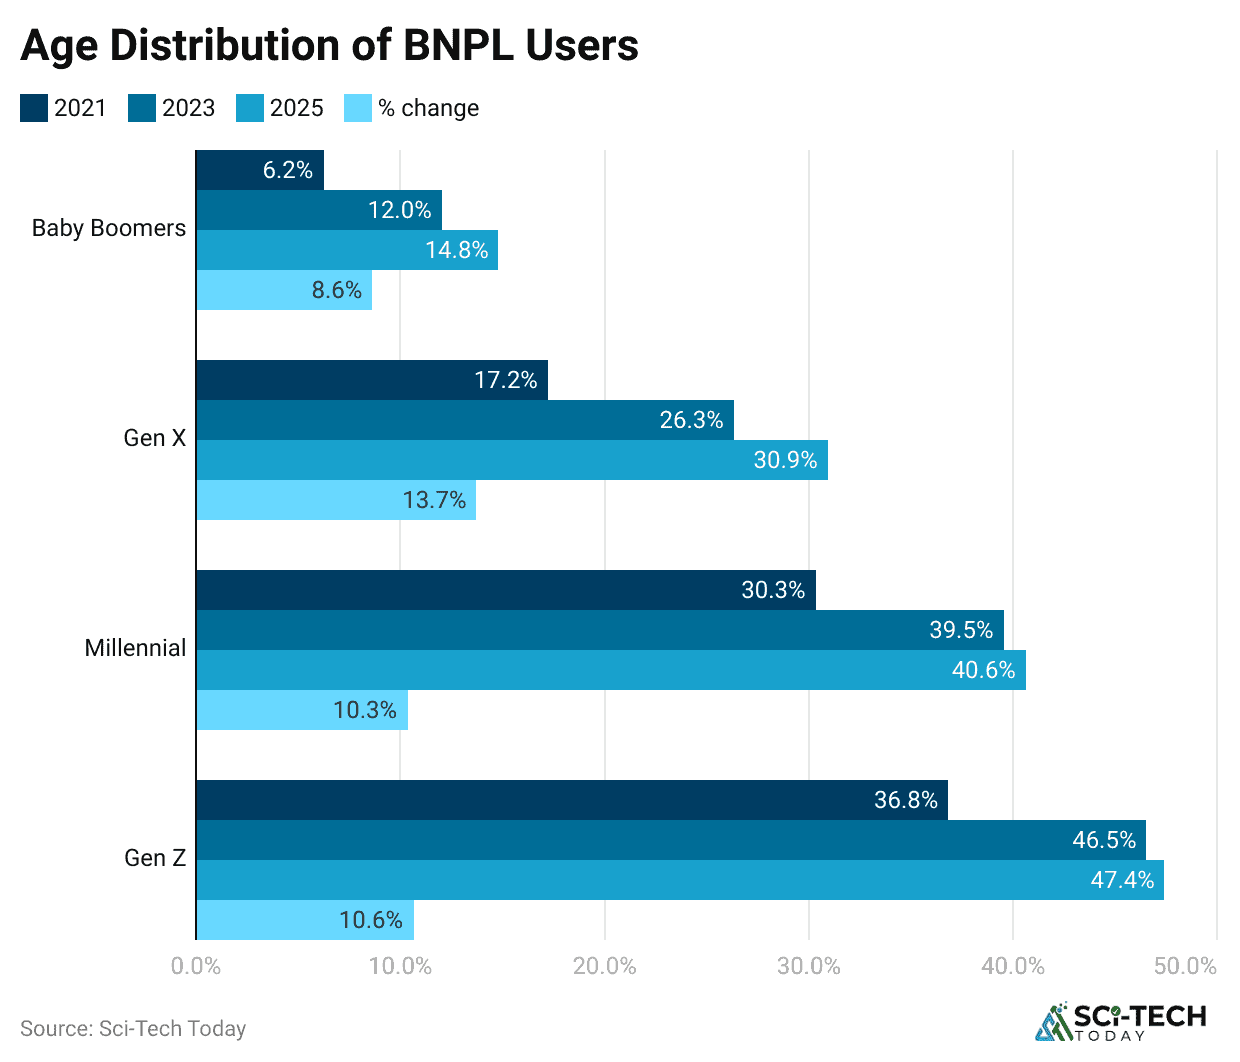
- Millennials (aged 29 to 44) demonstrate the highest usage rate of all demographics, with approximately 50% of this age group reporting that they have used a Buy Now Pay Later service.
- Gen Z (aged 18 to 28) is the most rapidly growing user segment, with their adoption rate projected to climb at a powerful 22.1% CAGR through 2030.
- Black and Hispanic consumers show a notably higher propensity to use Buy Now Pay Later, with Black consumers being an estimated 63% more likely to utilize the option compared to White consumers.
- 46% of users cited the overall convenience and ease of use as their primary reason for choosing the service, while 41% are primarily motivated by the benefit of zero interest on short-term installments.
| Global Users Forecast (2027) | Over 900 million users globally |
| U.S. Users (2024) | 86.5 million Americans used BNPL services |
| Highest Usage Rate | Millennials (approx. 50% usage rate) |
| Gen Z Growth | 22.1% annual growth in adoption |
| Primary Usage Reason | 46% cite convenience and ease of use |
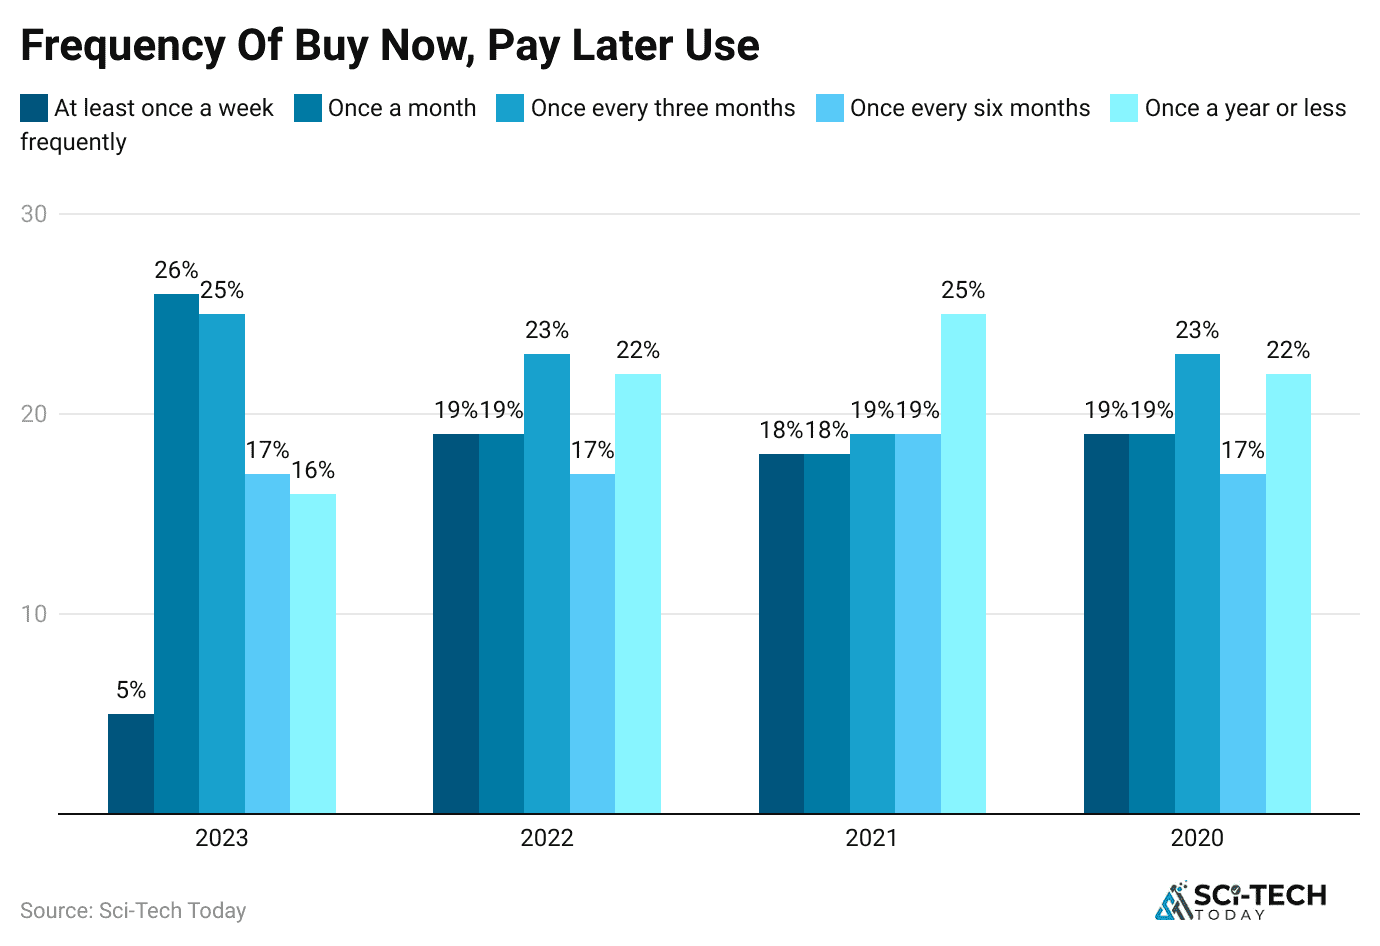
Buy Now Pay Later User Behaviour
- The main reasons for opting for BNPL services are spreading out payments (87%) and convenience (82%).
- Over 50% of Gen Z believe that BNPL enables them to manage money better.
- Almost 40% of Gen Z use BNPL weekly or more often than Baby Boomers (9%), Gen X (10%), and Millennials (28%).
- In 2024, almost 25% of people were late with BNPL payments versus 18% during the previous year, according to The Federal Reserve.
- Around 31% of those who use BNPL services have lost track of their payments.
- According to the Empower research, more than half of Millennials (53%) find it easier to manage large and unplanned expenses through BNPL.
Transactional Data and Retail Impact of Buy Now Pay Later
(Reference: market.us)
- BNPL integration can boost a merchant’s average order value (AOV) significantly, with many retailers reporting an AOV increase ranging from 15% to 40% when the option is presented at checkout.
- Research shows that Buy Now Pay Later omnichannel shoppers, those who use it both online and in-store, spend an average of 72% more per transaction compared to other standard online shoppers.
- Retailers often experience a substantial uplift in conversion rates, with some reports showing that integrating BNPL options can boost online checkout completion by up to 30% in certain product sectors.
- Up to 40% of sales finalized using a Buy Now Pay Later solution come from customers who are new to the specific retailer.
- The average transaction size for a Pay in 4 (four interest-free installments) plan is around USD 135 in the U.S., a stark contrast to the average traditional installment loan, which is typically closer to USD 800 over a much longer period.
- The share of Buy Now Pay Later transactions made via mobile devices during peak holiday seasons, like the 2024 holidays, reached an impressive 79.12%, underscoring its reliance on the mobile-first consumer experience.
| AOV Uplift | 15% to 40% increase for merchants |
| Omnichannel Spending | 72% more per transaction than other online shoppers |
| Conversion Rate Boost | Up to 30% increase in checkout completion |
| New Customer Acquisition | Up to 40% of sales from new customers |
| Average Pay in 4 Sizes | Approximately USD 135 per transaction |
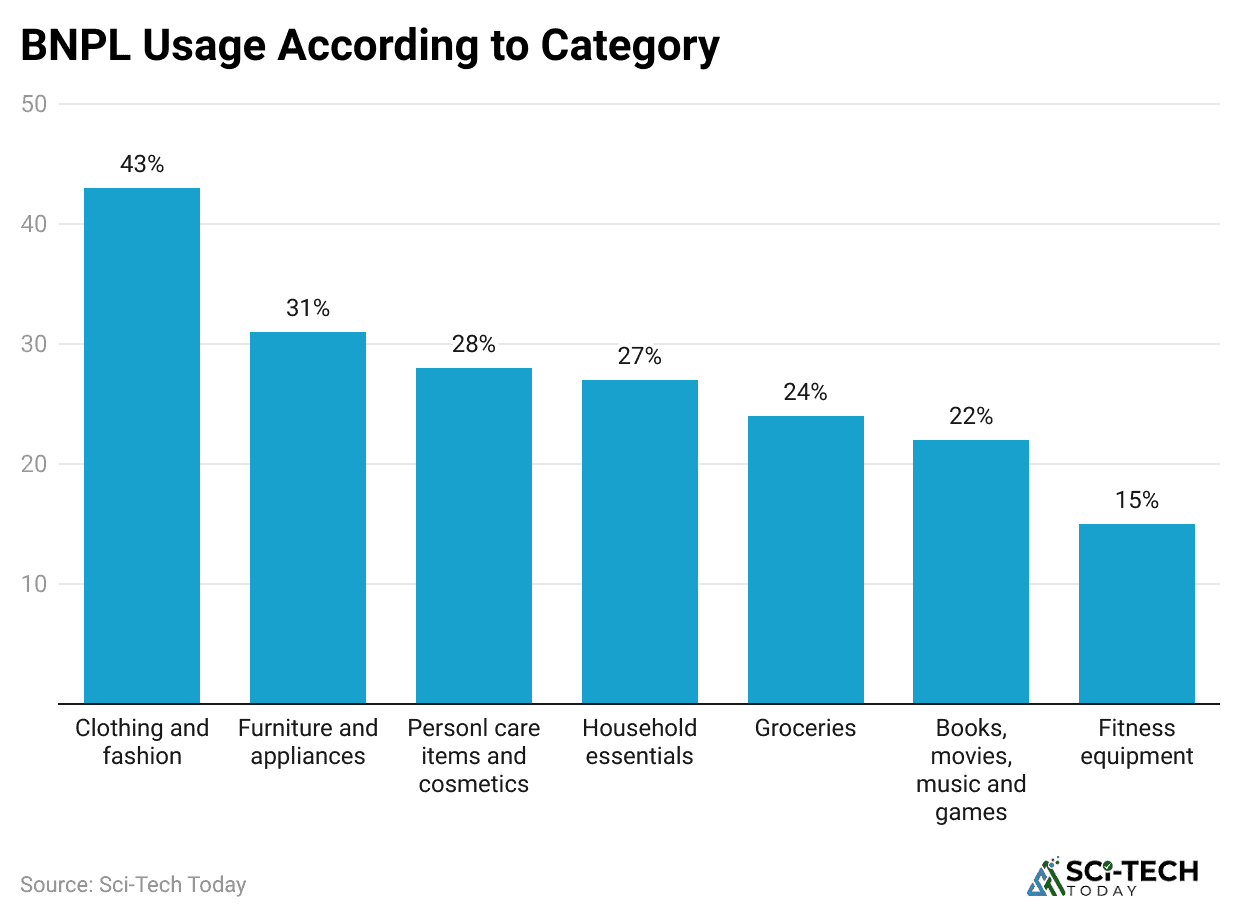
Buy Now Pay Later Product Category
(Reference: market.us)
- The Fashion and Apparel category, while still significant, accounted for a much lower percentage of payments in 2021 at 58.6%, and rose to roughly 63% of transaction value by 2023 as BNPL usage diversified into electronics, home, and everyday essentials.
- Consumer Electronics remains a leading category, with approximately 44% of BNPL consumers utilizing the service to fund these purchases.
- The Healthcare and Wellness sector is one of the fastest-growing verticals for BNPL, with an expected CAGR of 20.4% through 2030 in the U.S., driven by rising out-of-pocket medical and dental expenses.
- The Travel and Leisure segment has also seen a powerful jump, with BNPL booking volume increasing by an estimated 289% in 2024.
- Globally, the Retail sector still accounts for the overwhelming majority of BNPL revenue, making up roughly 73% of the industry’s total earnings and solidifying its primary use case.
| Consumer Electronics Usage | Percentage | Approximately 44% of BNPL users for this category |
| Healthcare & Wellness Growth | CAGR to 2030 | Projected 20.4% annual growth in the U.S. |
| Travel Booking Growth | Increase (2024) | An estimated 289% jump in booking volume |
| Fashion & Apparel Share | Percentage (2023) | 63% of payments, down from 58.6% in 2021 |
BNPL Debt and Delinquency Trends
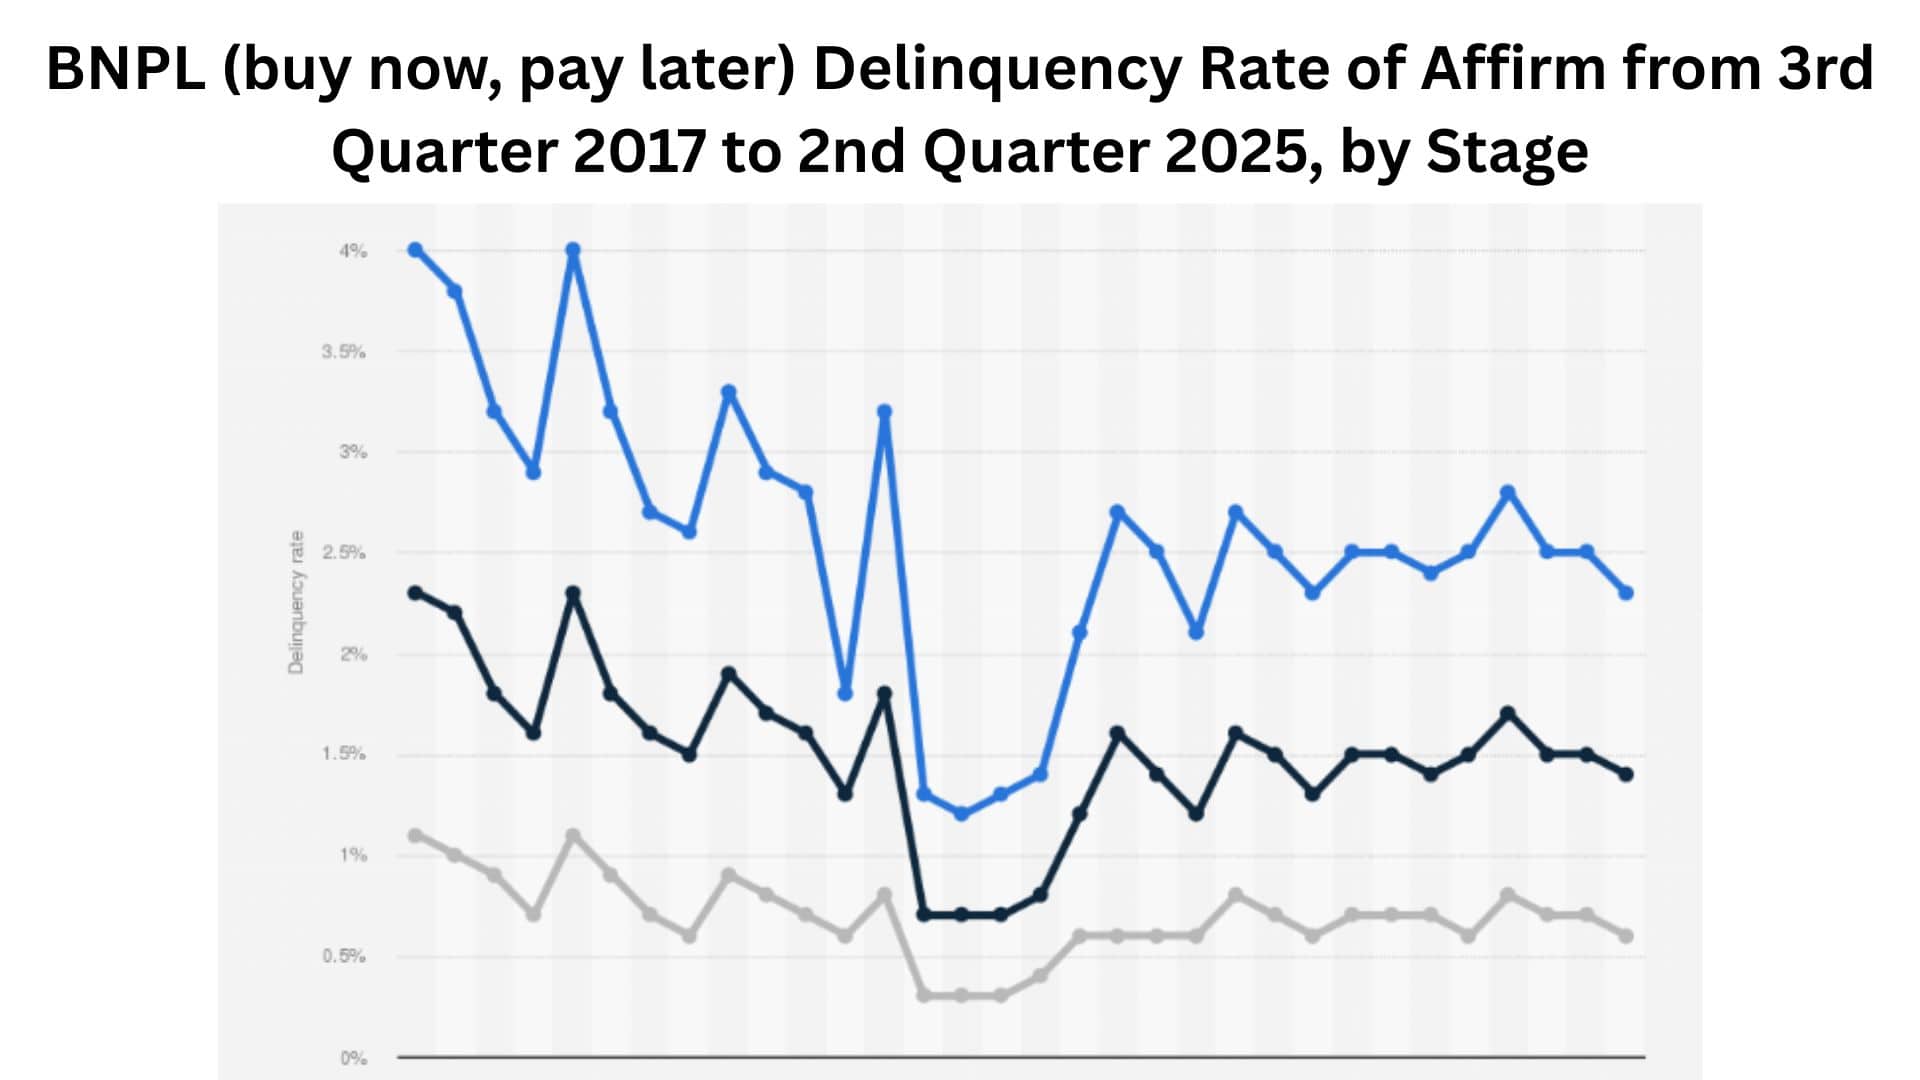
(Source: statista.com)
- A high-profile survey in late 2025 found that 41% of Buy Now Pay Later users reported paying late on at least one loan in the past year, which is a considerable increase from 34% the previous year.
- Gen Z users exhibit the highest rate of late payments, with an estimated 51% of this demographic admitting to making a payment past the due date in the last twelve months.
- Despite the high late payment rate, the average BNPL default rate remains relatively low at around 2% of loans, likely because most services mandate automatic repayments from a linked debit card or bank account.
- The phenomenon of loan stacking is widespread, with 63% of Buy Now Pay Later borrowers having multiple loans active simultaneously, and a third (33%) managing loans across multiple different providers.
- Consumers with active BNPL loans also hold significantly higher balances on other unsecured credit types, carrying an average of USD 871 more in credit card debt and USD 453 more in personal loans than non-users.
- A substantial portion of BNPL users, nearly a third (31%), admit to having lost track of exactly how many payments they owe across various services, demonstrating a major financial management challenge.
| Late Payment Rate | Percentage (2025) | 41% of users reported a late payment |
| Highest Late Payment Age | Age Group | Gen Z at approximately 51% |
| Loan Stacking | Percentage | 63% of borrowers have multiple simultaneous loans |
| Average Default Rate | Percentage | Approximately 2% of total BNPL loans |
| Credit Card Debt Comparison | Value | USD 871 more in credit card debt for BNPL users |
Buy Now Pay Later Financial Impact
(Source: Empower Research)
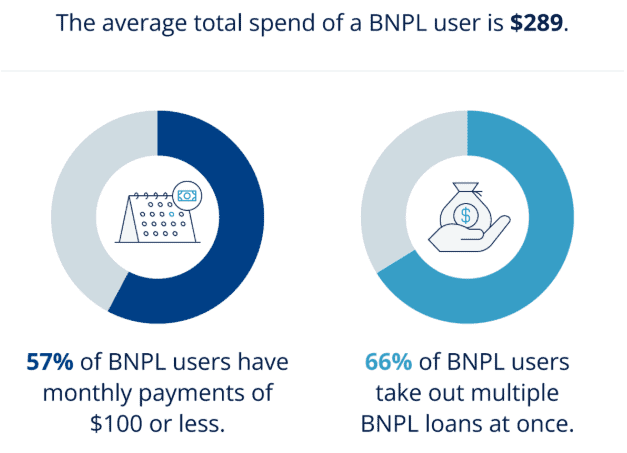
- According to Empower data for April 2024, the monthly total average spending for each BNPL customer equals USD 289.
- It was revealed by the Consumer Financial Protection Bureau that 66% of BNPL customers take several BNPL loans at the same time, and 33% borrow from several BNPL lenders simultaneously.
- American people using BNPL have higher balances on other credit products than those who do not use BNPL products. They have USD 453 more on personal loans and USD 871 more on credit cards.
- Americans paid USD 18.2 million using BNPL products during the 2024 holiday season.
- 57% of BNPL customers have average monthly payments below USD 100.
- Affirm BNPL customers have an average balance of USD 660.
- According to Empower, although 40% of BNPL customers find it very important that these loans will not affect their credit scores, 45% of them claim that they will keep doing it regardless of the score changes.
Major Buy Now Pay Later Company
(Source: coherentmarketinsights.com)
- The U.S. market share for Buy Now Pay Later is heavily concentrated, with the five major firms, Affirm, Klarna, Afterpay, Zip, and Sezzle, collectively accounting for over 95% of the total market volume.
- Klarna is recognized as the most widely offered service globally, with its platform integrated into over 792,280 live websites around the world.
- In 2025, Klarna’s payment volume in the U.S. is expected to reach USD 25.77 billion, reflecting a robust year-over-year increase of 17.2%.
- Affirm, the only major provider to boast a no-late-fee policy, stands out with a very high average payment size, which was 94.8% larger than the average installment payment made to other major BNPL providers in 2020.
- The company Afterpay is unique among the primary lenders as it is the only one that does not perform a soft credit check on its customers for their standard pay-in-four product, lowering the barrier to entry significantly.
- PayPal’s own Buy Now Pay Later option, “Pay in 4,” is one of the most widely adopted services in the U.S., with a reported 68% of online shoppers having used it at least once due to the service’s massive pre-existing user base.
| U.S. Market Concentration | 95% held by the top five firms |
| Most Offered Globally (Klarna) | Over 792,280 websites |
| Klarna U.S. Payment Volume (2025) | $25.77 billion (17.2% YoY growth) |
| Affirm Average Payment Size | 94.8% larger than other major BNPL lenders |
| Afterpay’s Approval Process | The only major BNPL lender that skips the soft credit check |
Final Thoughts
Overall, what this data reveals is that buy now, pay later is a change in how people access and utilize short-term credit. These statistics are overwhelmingly clear: this payment method is driving major financial decisions for millions, particularly the younger generations who are wary of revolving credit card debt but still seek immediate purchase.
The massive growth projections, reaching over USD 900 billion in global GMV, are a testament to the convenience and merchant benefits. However, the rapidly rising late payment rates, with 41% of users reporting a missed deadline, and the widespread practice of loan stacking among 63% of borrowers, are necessary cautionary measures to address. I hope you like this one piece of content. If you have any questions, kindly let us know. Thanks for staying up till the end.
FAQ
Buy Now Pay Later refers to a quick method of financing that could assist you in shopping online. Using BNPL, one will be able to carry out an activity and pay for it afterwards at no interest rate.
The BNPL service conducts a soft inquiry on your credit, and if you get approved, you are required to make a payment of a certain percentage of the total cost, with the balance being made in the form of interest-free instalments. If one fails to make the payments, he/she gets interest charges.
Buy Now, Pay Later (BNPL) eligibility requires you to be at least 18 years old, possess a valid mobile number, and have an active bank account. Providers evaluate your creditworthiness using soft credit checks and basic income verification to approve instant short-term financing.
