






Starter
Surprising Instagram Marketing Statistics: Instagram has solidified its position as a pivotal platform for digital marketing, boasting over 3 billion monthly active users globally as of 2025, up from 2.99 billion, having crossed the 3 billion mark by Q3 2025, per Meta’s earnings report. India leads with approximately 414 million active Instagram users, followed by the United States with around 172 million, based on Meta’s advertising-reach data from January 2025. The platform’s visual-centric features, including Stories and Reels, have significantly contributed to its widespread adoption. Notably, over 400 million users engage with Instagram Stories daily.
In terms of advertising, Instagram’s influence is substantial: its U.S. advertising revenue alone was projected to reach USD 37.13 billion in 2025, up 15.9% year over year far exceeding the earlier USD 10 billion global-investment figure. Furthermore, Instagram is anticipated to generate more than half of Meta Platforms’ advertising revenue in the U.S. by 2025, driven by improved monetization strategies and the growing popularity of short-form videos like Reels. User engagement on Instagram remains robust. U.S. adults spend an average of 33.1 minutes per day on the platform, reflecting its integral role in daily digital consumption.
Additionally, 60% of users discover new products through Instagram, underscoring its effectiveness as a tool for brand discovery and consumer influence. Given these Instagram Marketing statistics, Instagram continues to be an essential platform for businesses aiming to enhance their online presence and engage with a global audience.
The Editor’s Best Picks
- Over 80% of Instagram users follow at least one business account.
- Instagram has over 2 million advertisers globally, leveraging the platform’s vast user base to market their products.
- As of 2025, around 89% of marketers say Instagram is the most important social media platform for influencer marketing.
- Surprisingly, Instagram’s marketing statistics show that its ad reach grew by 5.4% in the last year, reaching more than 1.2 billion users.
- Meanwhile, 500 million users use Instagram Stories daily, and brands contribute over one-third of the most viewed stories.
- Shoppable posts lead to a 20% higher engagement rate than non-shoppable posts, making them a critical tool for e-commerce on Instagram.
- Almost 75% of Instagram users say they visit a brand’s profile after seeing a paid advertisement.
- Instagram’s social commerce/shopping revenue reached approximately USD 37.2 billion in 2024 and continued growing into 2025, with overall Instagram ad revenue reaching USD 43.2 billion.
- Carousel posts continue to lead engagement in 2025, generating up to 3.1 times more engagement than single-image posts, with reported engagement rates ranging from 0.55% to as high as 10.15% depending on methodology.
- 75% of businesses on Instagram plan to increase their advertising budgets in 2024, as well as in 2025, reflecting its effectiveness in driving sales and visibility.
General Surprising Instagram Marketing Statistics
- Instagram has more than 200 million business accounts, where companies promote their products and services to users.
- By 2025, Instagram had reached approximately 3 billion monthly active users worldwide, reinforcing its position as one of the world’s largest social platforms.
- About 62.8% of Instagram users follow or look up brands and products on the platform for more information.
- About 76.37% of Instagram users have fewer than 10,000 followers, meaning most are small or medium-sized accounts.
- U.S. adults using Instagram at least once a month spend about 33.1 minutes daily on the app.
- Instagram’s average engagement rate is approximately 0.48% in 2025.
| Social Media Platform | Median Engagement Rate |
| 0.48% | |
| 0.063% | |
| 0.029% |
- In 2025, based on the number of followers, Instagram reels usually had an engagement rate of 7.78% to 10.58%.
| Followers Number | Instagram Reels Engagement Rate |
| Ten million+ | 10.58% |
| 5 to 10 million | 9.18% |
| 500K to 1 million | 7.18% |
| 100K to 500K | 6.59% |
| 1 to 5 million | 6.15% |
- Surprisingly, Instagram Marketing Statistics reports that on average, video posts on Instagram get 3.15 times more likes than regular image posts.
| Instagram Post Type | Number of Likes |
| Video | 1832 |
| Carousel | 1358 |
| Image | 581 |
Instagram Stories Statistics
- Social media experts claim that Instagram Stories are a good way to attract more interest and connect with more users.
- As of 2025, around 78.01% of US Gen Z social media users (ages 15-26) watched Instagram Stories within the last month.
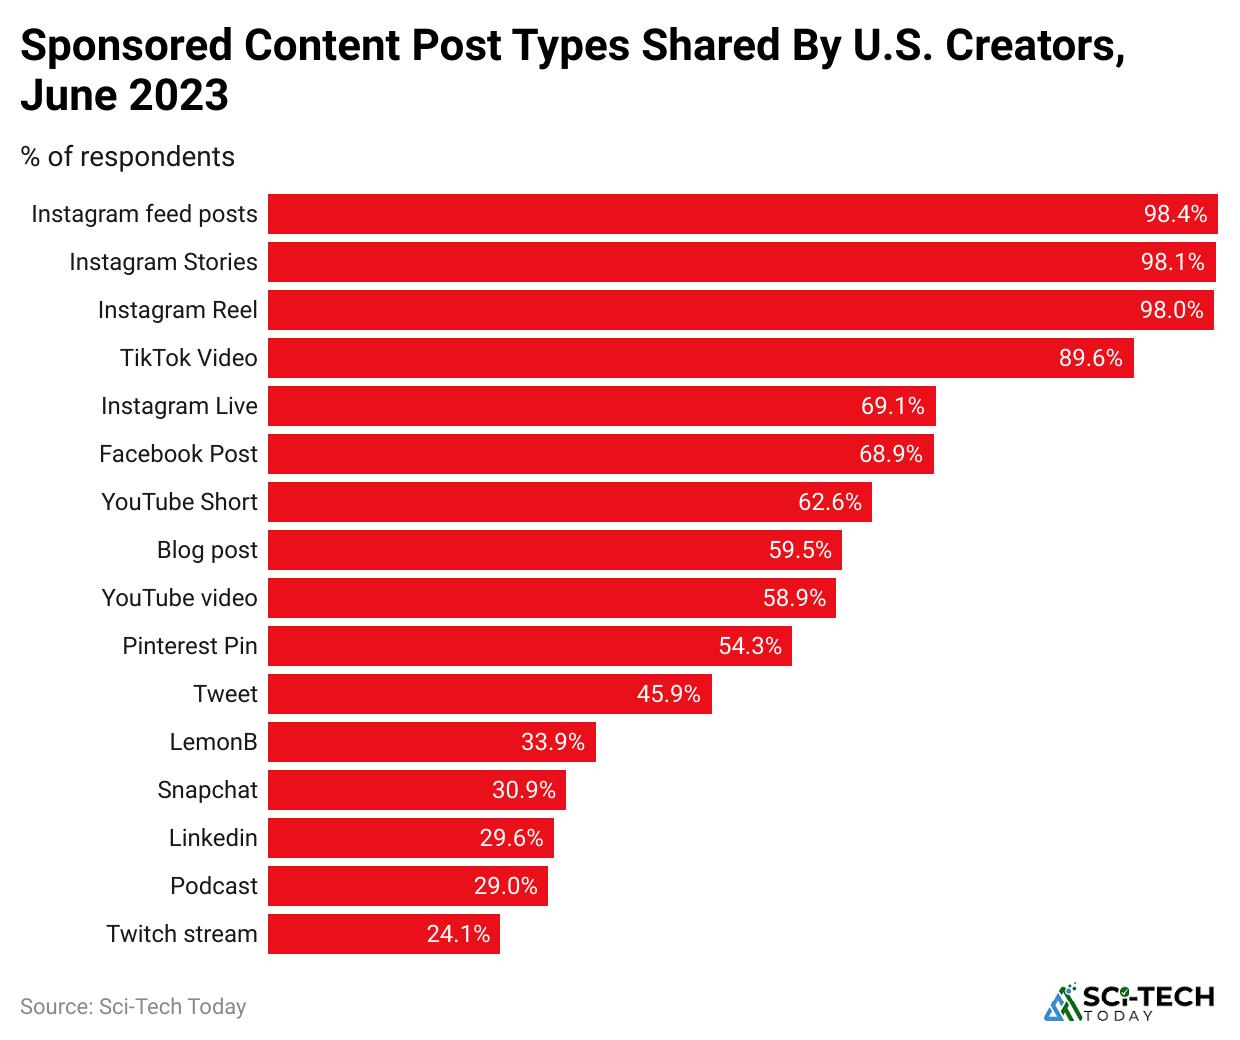
- In the U.S., 98.1% of creators use Instagram Stories to share sponsored posts with their followers.
Sponsored Content Type by Share of U.S. Creators, June 2025
(Reference: emarketer.com)
- In the U.S., as of 2025, 98.4% of creators use Instagram feed posts to share sponsored content with their followers.
- Other Instagram content formats used for sponsored posts are Instagram Stories (98.1%), Instagram Reels (98.0%), and Instagram Live (69.1%).
Instagram Engagement Statistics
- In 2025, an average Instagram post received 15.66 comments, 513.37 likes, and 19.79 saves. This represents a small rise in comments and likes versus 2023, while average saves declined slightly from 20.28.
- The top search category on Instagram is “fashion brands,” making up 12% of all searches.
- Image posts on Instagram get around 2,002 users, while carousels with multiple images attract about 2,641 users.
- Instagram business posts had an average engagement rate of approximately 0.43%–0.52% in 2025.
- Accounts of businesses on Instagram that have a follower base of 10,000-100,000 get 0.68% engagement rate on average, followed by accounts with more than 100,000 followers (0.57%).
- The most successful Instagram posts contain about 5.44 hashtags on average.
- The most optimal time for posting on Instagram is 7 a.m. to 9 a.m. on weekdays.
Instagram Business Statistics
- Instagram has more than 200 million business accounts where companies promote their products and services.
- In 2025, 82% of social media marketers used Instagram to promote their business, up slightly from 80% in 2024.
- In 2025, at least one business account is followed by 90% of Instagram users.
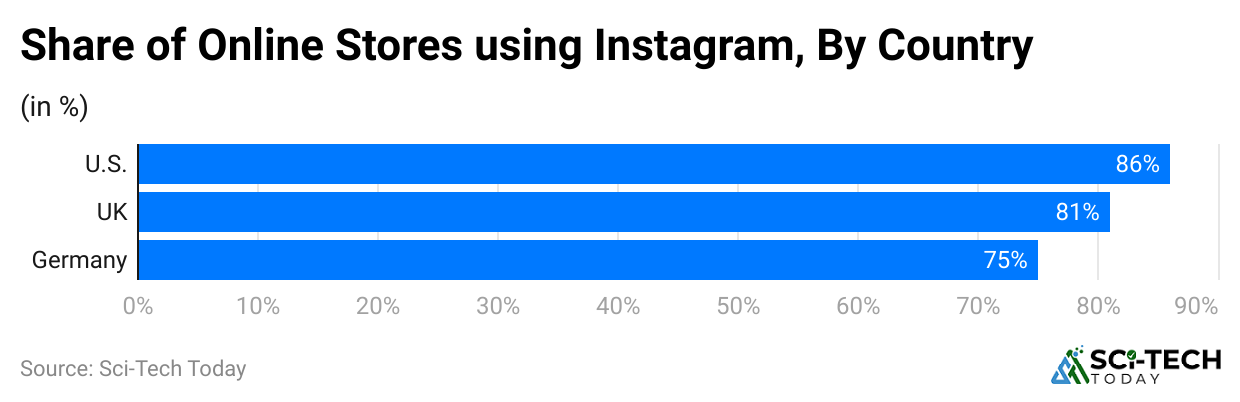
- The graph below represents the share of online stores with an Instagram profile by country, including the United States (86%), the United Kingdom (81%), and Germany (75%).
(Reference: socialpilot.co)
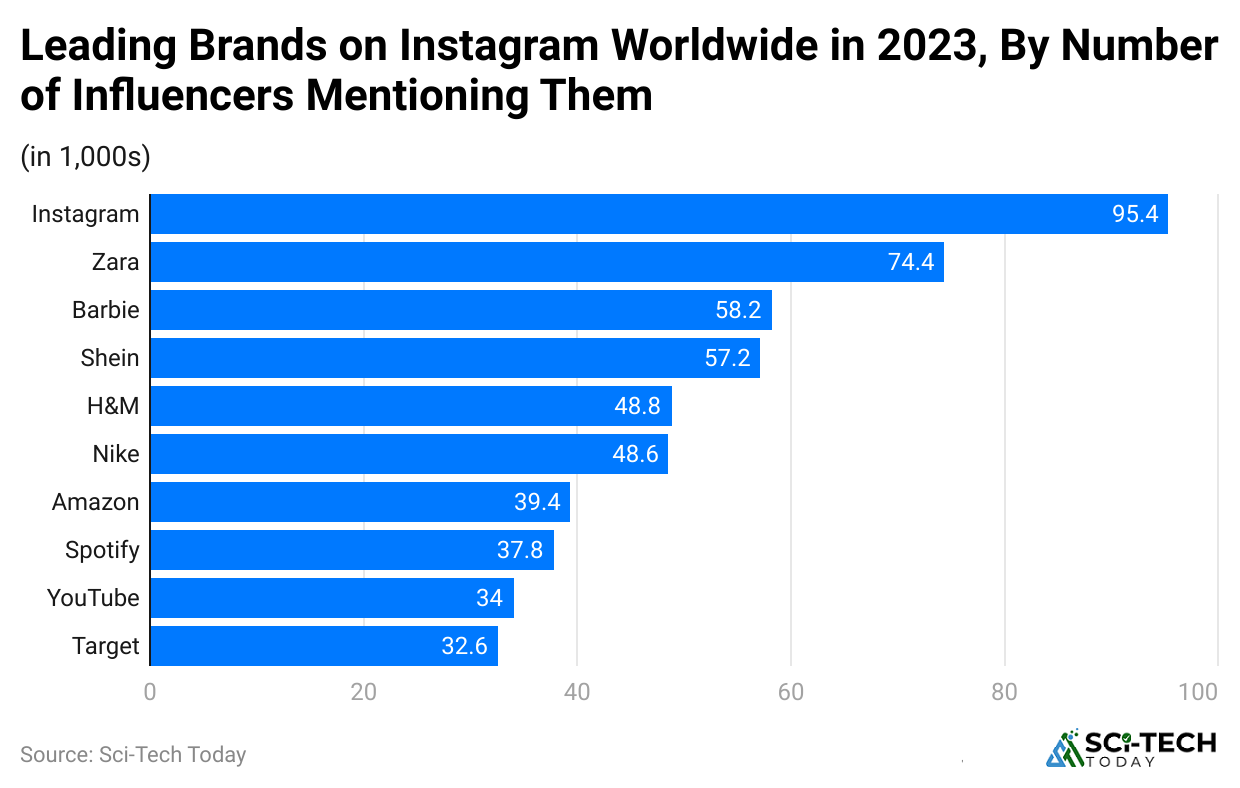
Instagram’s Top Brands by Influencers
(Reference: statista.com)
- In 2025, Instagram remained the most popular brand on the platform itself, with 95.4 thousand influencers mentioned globally.
- In the latest available 2025 marketer survey, Facebook remained the leading platform for marketing, used by 86% of global marketers. Instagram followed at 82%, and LinkedIn at 72%.
- Other numbers of influencers by brands are Shein (57.2K), H&M (48.8K), Nike (48.6K), Amazon (39.4K), Spotify (37.8K), YouTube (34K), and Target (32.6K).
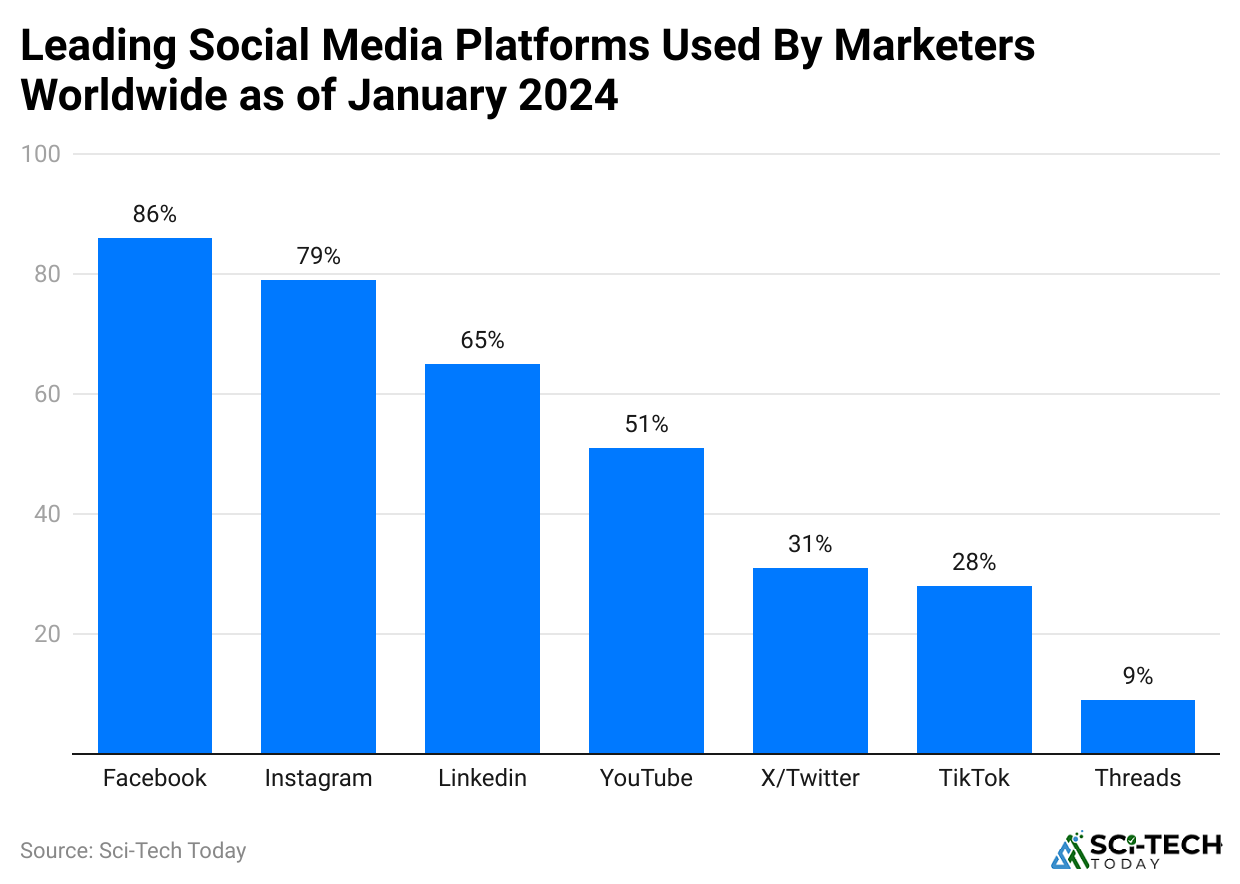
Top Social Media Platforms Used by Marketers
(Reference: statista.com)
- In a 2024 Statista survey of global marketers, about 86% said they use Facebook for marketing.
- Instagram was next, with 79% of marketers using it, followed by LinkedIn, which was used by 65% of them.
- Other leading social media platforms used by marketers are YouTube (51%), X/Twitter (31%), TikTok (28%), and Threads (9%).
Surprising Instagram Marketing by Advertisements
User Engagement:
- Engagement Rate: The average engagement rate for Instagram ads is around 94%, with video ads performing slightly better.
- Stories Ads: Ads in Instagram Stories have a completion rate of about 70%.
Audience Reach:
- Total Users: Instagram is expected to have over 2.5 billion monthly active users by the end of 2025.
- Demographics: About 33% of Instagram users are aged 25 to 34, making them a key group for marketers.
Ad Spend:
- Growth in Ad Spend: In 2024, ad spending on Instagram was projected to reach USD 32.5 billion, with 10-15% growth expected in 2025.
- Mobile-First: About 85% of Instagram ads are viewed on mobile devices, emphasizing the need for mobile-optimized content.
Types of Ads:
- Carousel Ads: These ads generate 10% more engagement than single-image ads.
- Influencer Marketing: Brands that utilize influencers on Instagram can see a return on investment (ROI) of up to six times that of traditional advertising.
Video Content:
- Video Ads: As of 2025, video ads account for nearly 50% of all ad formats on Instagram, driven by the popularity of Reels.
Cost-Per-Click (CPC):
- The average CPC for Instagram ads are around USD 1.20, with variations based on Industry and targeting.
Instagram Marketing by Influencers
(Reference: statista.com)
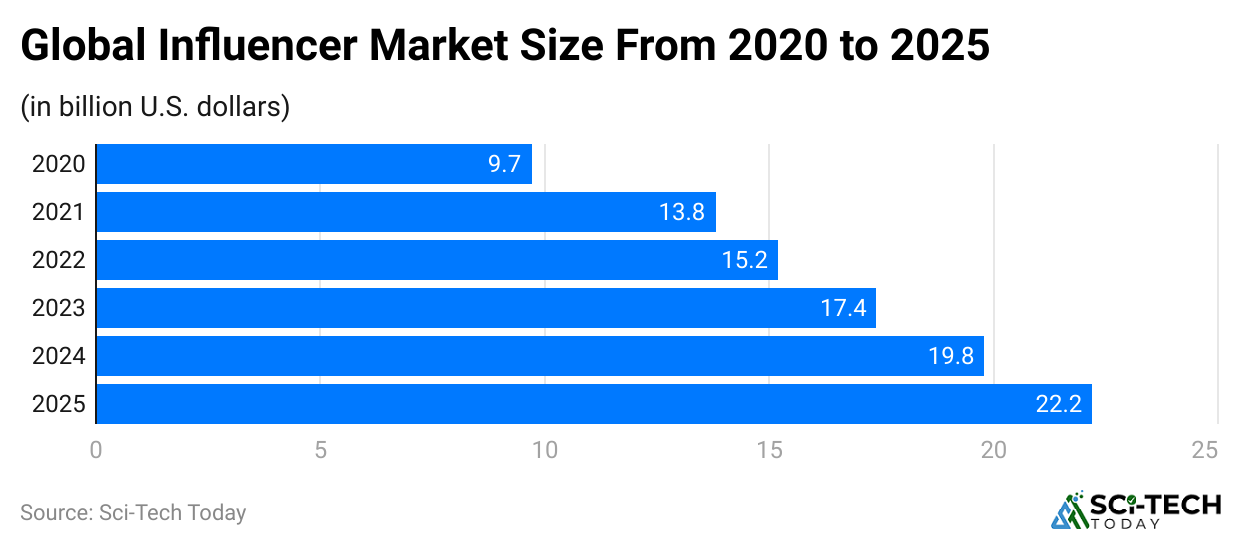
- The global influencer marketing industry was estimated at approximately USD 32.55 billion in 2025, up from about USD 24 billion in 2024.
- Instagram accounted for approximately 29.25% of global influencer-marketing revenue in 2025, equivalent to about USD 9.09 billion
The engagement rate for influencers on Instagram varies by their follower count, as detailed below:
| Influencers | Engagement Rate |
| Nano (1K–10K followers) | 4% |
| Micro (10K–100K followers) | 2.4% |
| Macro (100K–1M followers) | 1.6% |
| Mega (1M+ followers) | 1% |
The average cost of Sponsored Posts is stated below:
| Influencers | Cost (USD) |
| Nano | 100 to 200 |
| Micro | 500 to 2000 |
| Macro | 5000 to 10,000 |
| Mega | 10,000 to 50,000 |
Instagram Shopping Statistics
- As mentioned in Surprising Instagram Marketing Statistics, around 130 million users continued to tap Instagram Shopping posts or product tags monthly in 2025.
- About 83% of Instagram users actively searched for new brands and products on the platform in 2025.
- Instagram-driven social-commerce sales reached approximately USD 42.8 billion globally in 2025.
- The average order value for Instagram Shopping is around USD 65 per transaction.
- In addition, 500,000 brands are now using Instagram Shopping tags, enabling them to link directly to their product pages from photos and videos.
- Nearly 50% of American-based Instagram Shopping users utilize Instagram Checkout features to make purchases directly within the app.
- Reels remain an important commerce and discovery format; in 2025 it generated an average engagement rate of 0.52%.
- 44% of Instagram users in 2025 say they use Instagram Shopping more than other e-commerce platforms due to the convenience and visual appeal.
Instagram Engagement Rate Per Post by Industry
(Source: rivaliq.com)
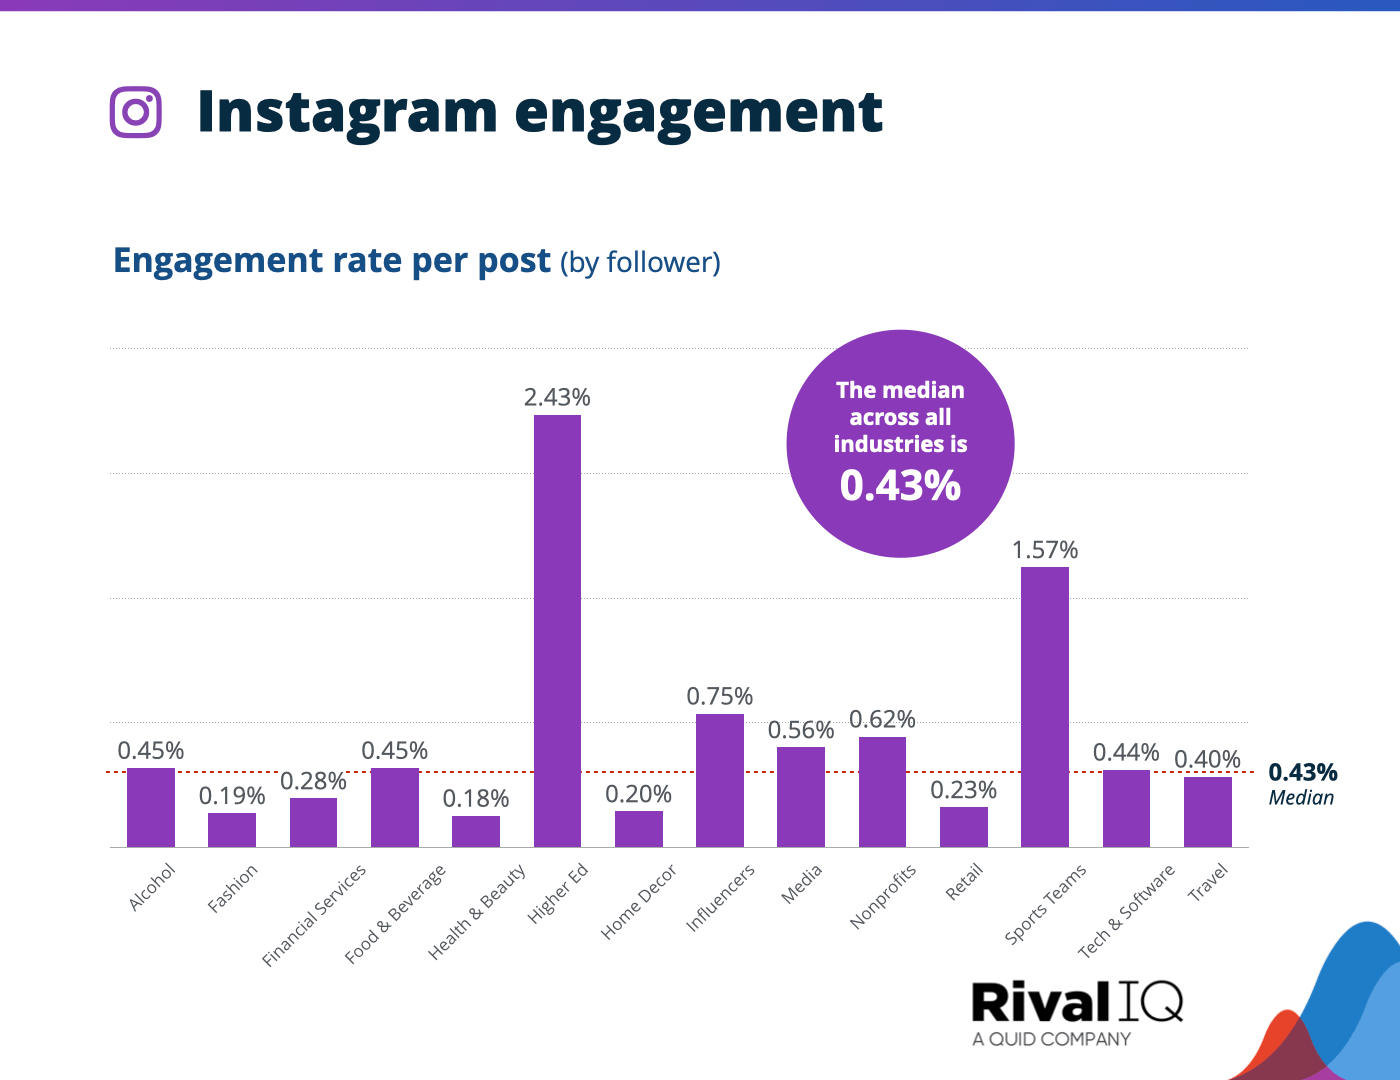
- Surprising Instagram Marketing Statistics further elaborates that the median Instagram engagement rate by all global industries will be around 0.58% in 2025.
- The higher education sector captured the highest engagement rate per post on Instagram, accounting for 3.14%.
- Furthermore, Instagram engagement rates by other industries are Sport Teams (1.57%), Influencers (0.75%), Nonprofits (0.62%), Media (0.56%), Food & Beverage (0.45%), Alcohol (0.45%), Tech & Software (0.44%), Travel (0.40%), Financial Services (0.28%), Retail (0.23%), Home Decor (0.20%), Fashion (0.19%), Health and Beauty (0.18%).
Instagram Activity Post Per Week by Industry
(Source: rivaliq.com)
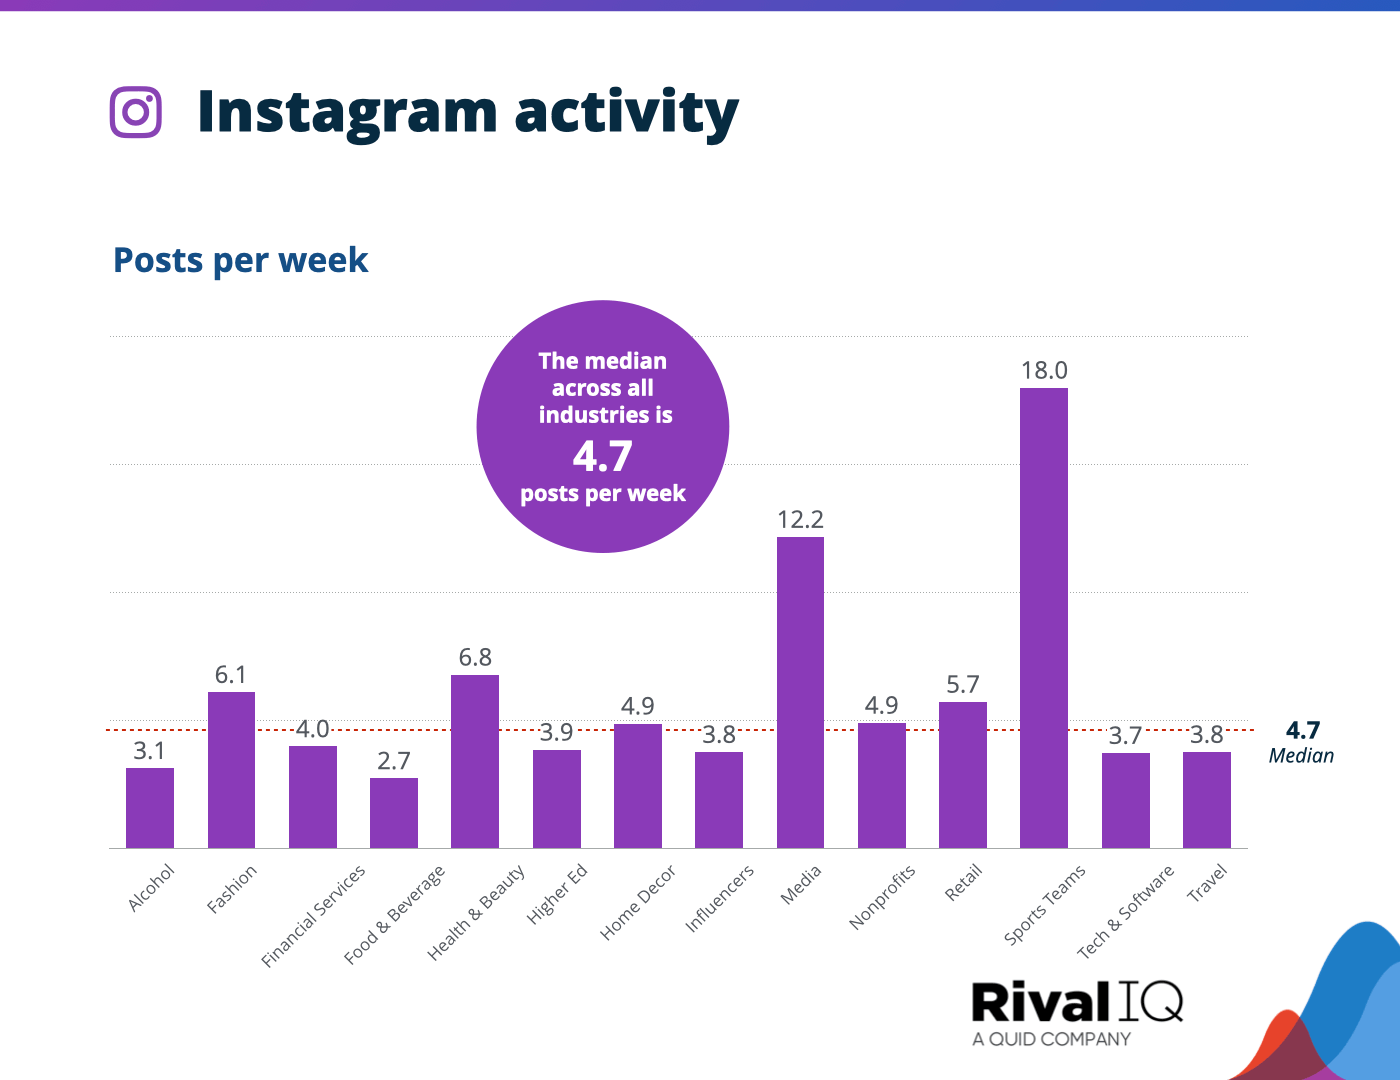
- Surprisingly, Instagram marketing statistics also show that the average Instagram activity resulted in 4.7 posts per week.
- In 2025, based on the industry, the average number of Instagram posts per week is followed by Alcohol (3.1), Fashion (6.1), Financial Services (4.0), Food & Beverage (2.7), Health & Beauty (6.8), Higher Education (3.9), Home Decor (4.9), Influencer (3.8), Media (12.2), Nonprofits (4.9), Retail (5.7), Sports Teams (18.0). Tech Sports (3.7) and Travel (3.8).
Alcohol Instagram Hashtags by Engagement Rate
(Reference: rivaliq.com)
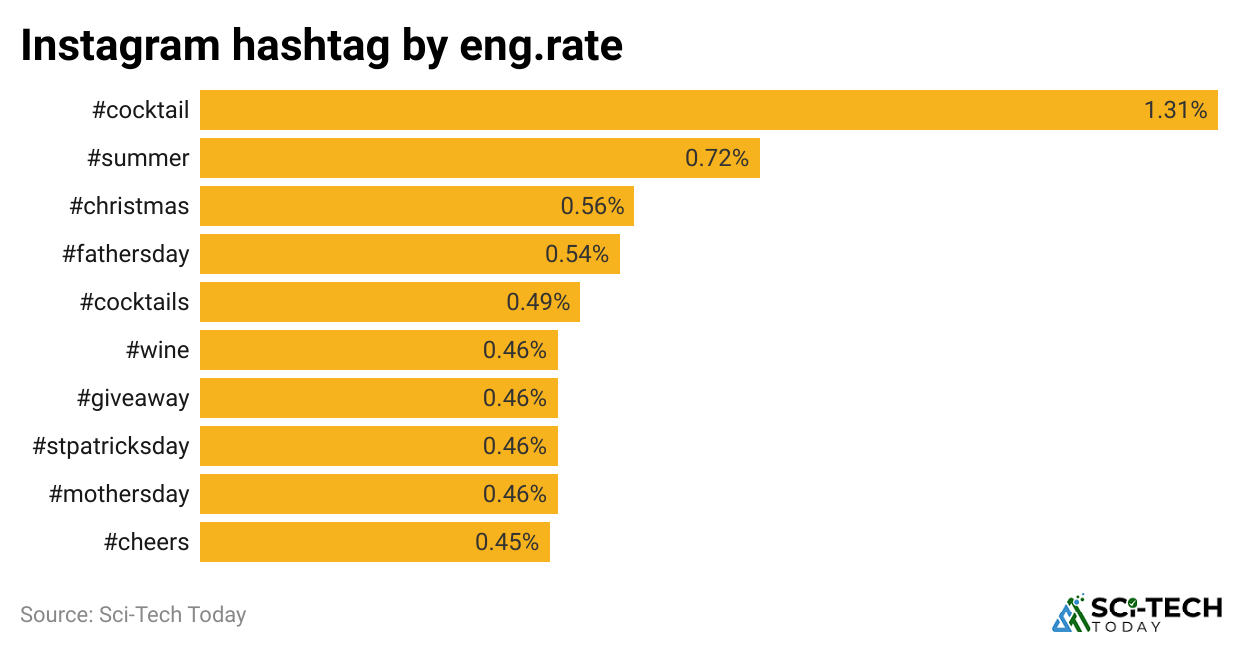
- This year, alcohol brands focused on mixed drink hashtags, with #cocktail leading to 1.31% engagement on Instagram.
- Meanwhile, other Instagram hashtags by eng. rates are #summer (0.72%), #christmas (0.56%), #fathersday (0.54%), #cocktails (0.49%), #wine (0.46%), #giveaway (0.46%), #stpatricksday (0.46%), #mothersday (0.46%), and #cheers (0.45%).
Instagram Engagement Rate Hashtags by Fashion
(Source: rivaliq.com)
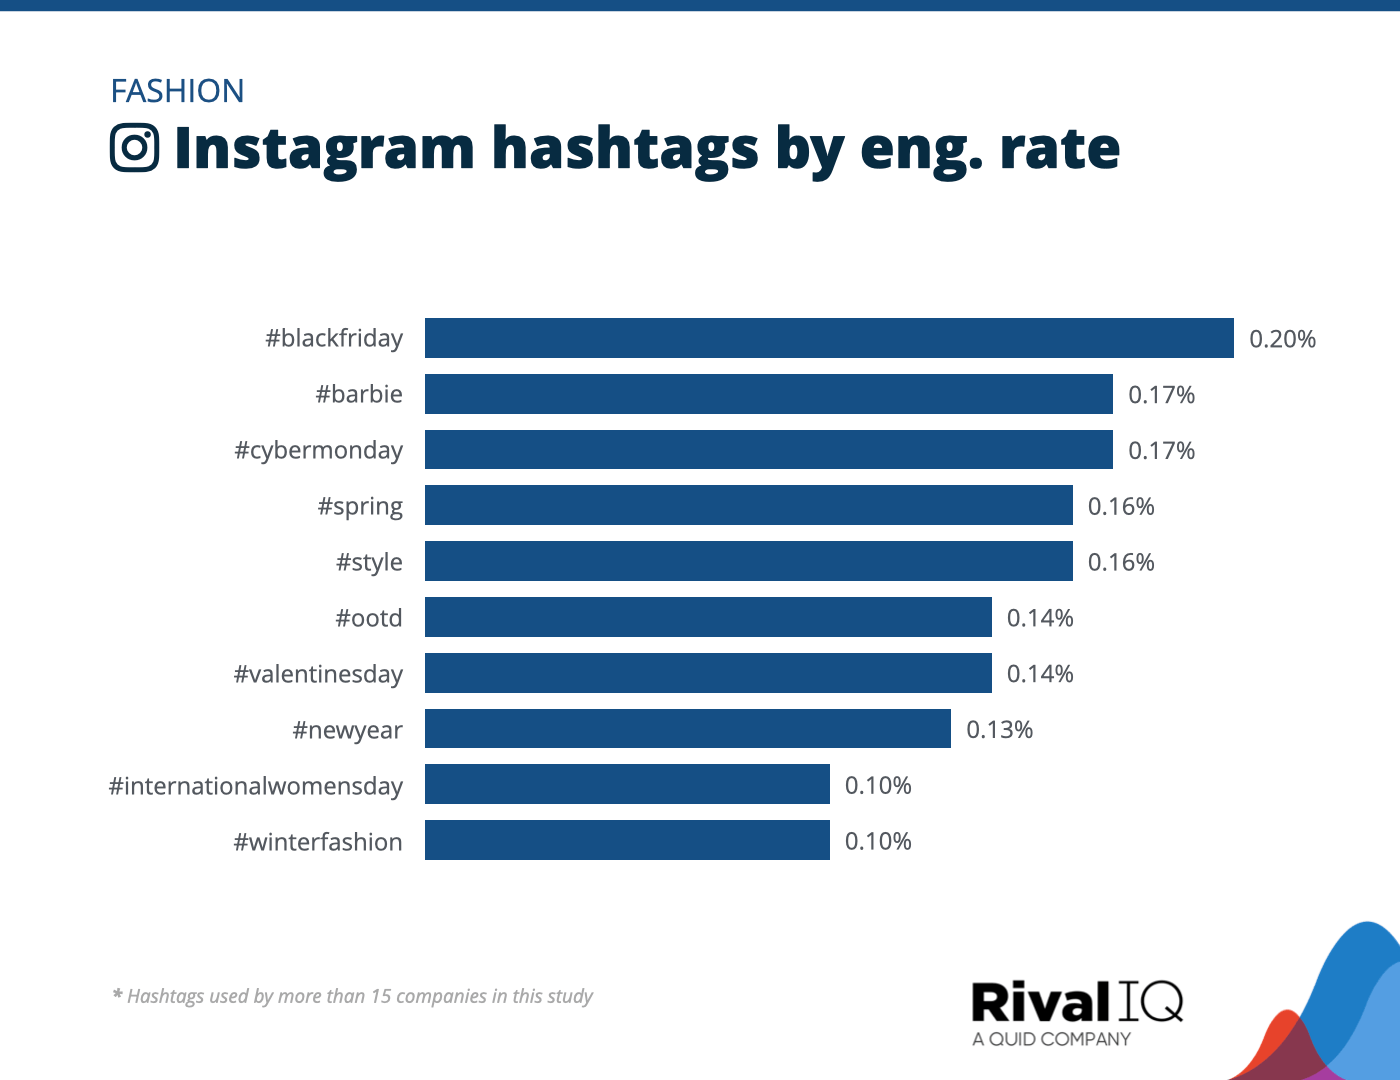
- Fashion brands used hashtags like #BlackFriday and #CyberMonday on Instagram, with 0.20% and 0.17% usage, respectively.
- As of 2024, the Fashion Instagram hashtags by eng. rate # Barbie (0.17%), #spring (0.16%), #style (0.16%), #ootd (0.14%), # Valentine’s Day (0.13%), # New Year (0.13%), #internationalwomensday (0.10%), and #winterfashion (0.10%).
By Financial Services
(Source: rivaliq.com)
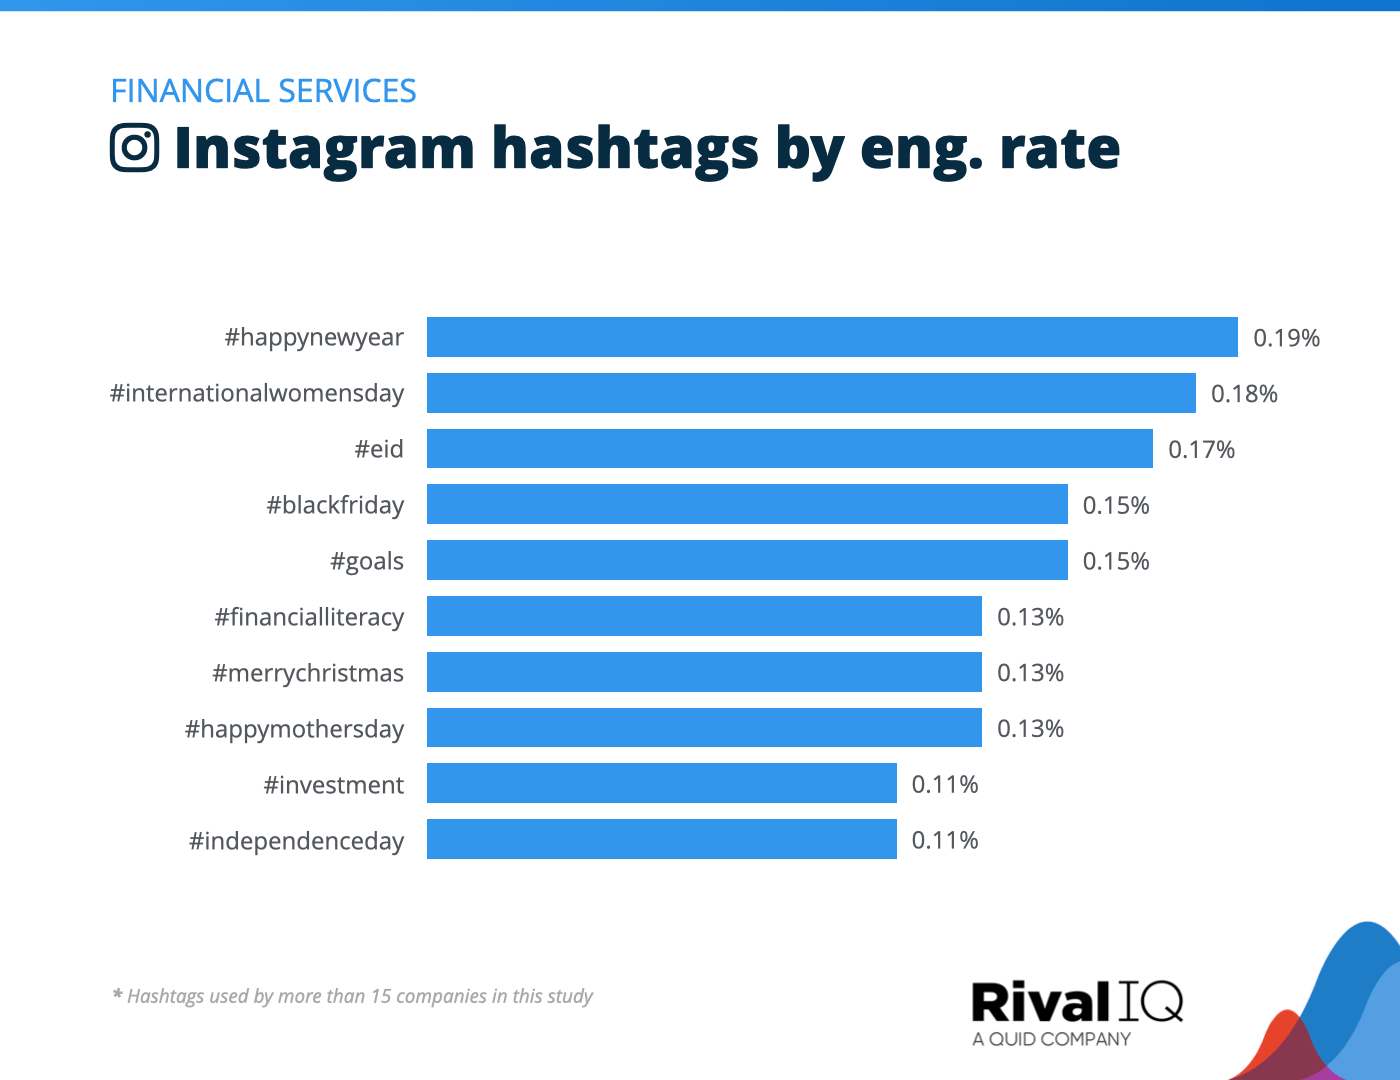
- In financial services, the top three hashtags by eng. rate #happynewyear (0.19%), #internationalwomensday (0.18%), #eid (0.17%).
- Furthermore, Other hashtags are followed by #blackfriday (0.15%), #goals (0.15%), #financialiteracy (0.13%), #merrychristmas (0.13%), #happymothersday (0.13%), # investment (0.11%), and #independenceday (0.11%).
By Food And Beverage
(Source: rivaliq.com)
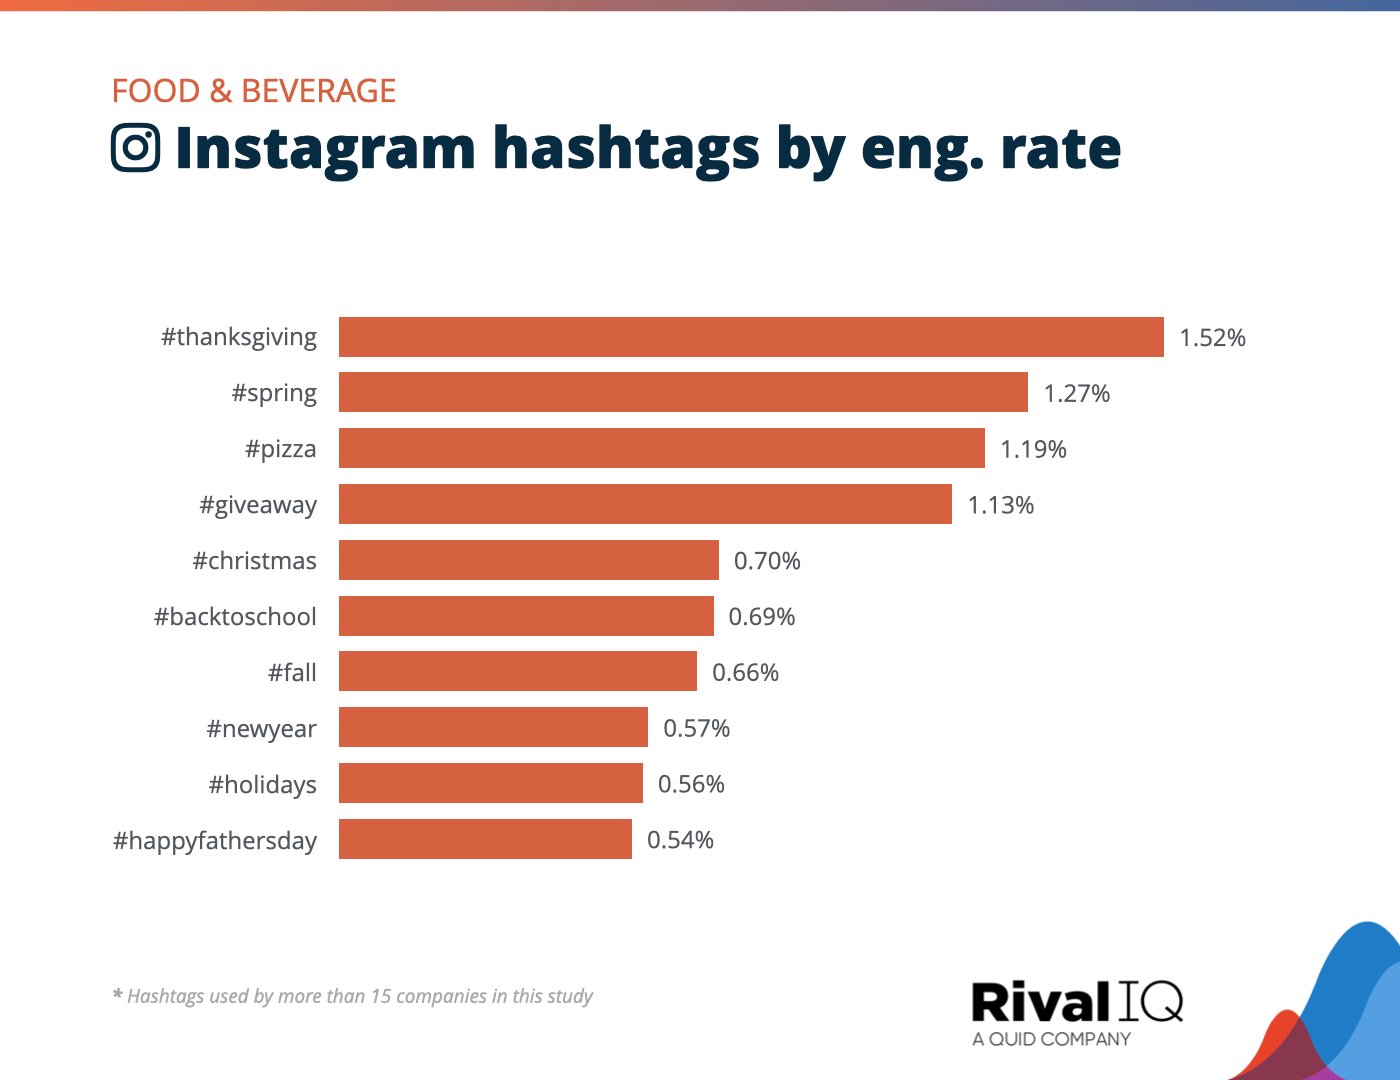
- The Top Instagram hashtags about food focused on engagement rate by food and beverage, such as #Thanksgiving and #spring, are 1.52% and 1.27%, respectively.
- Meanwhile, other hashtags are #pizza (1.19%), #giveaway (1.13%), #christmas (0.70%), #backtoschool (0.69%), #fall (0.66%), #newyear (0.57%), #holidays (0.56%) and #happyfathersday (0.54%).
By Health And Beauty
(Source: rivaliq.com)
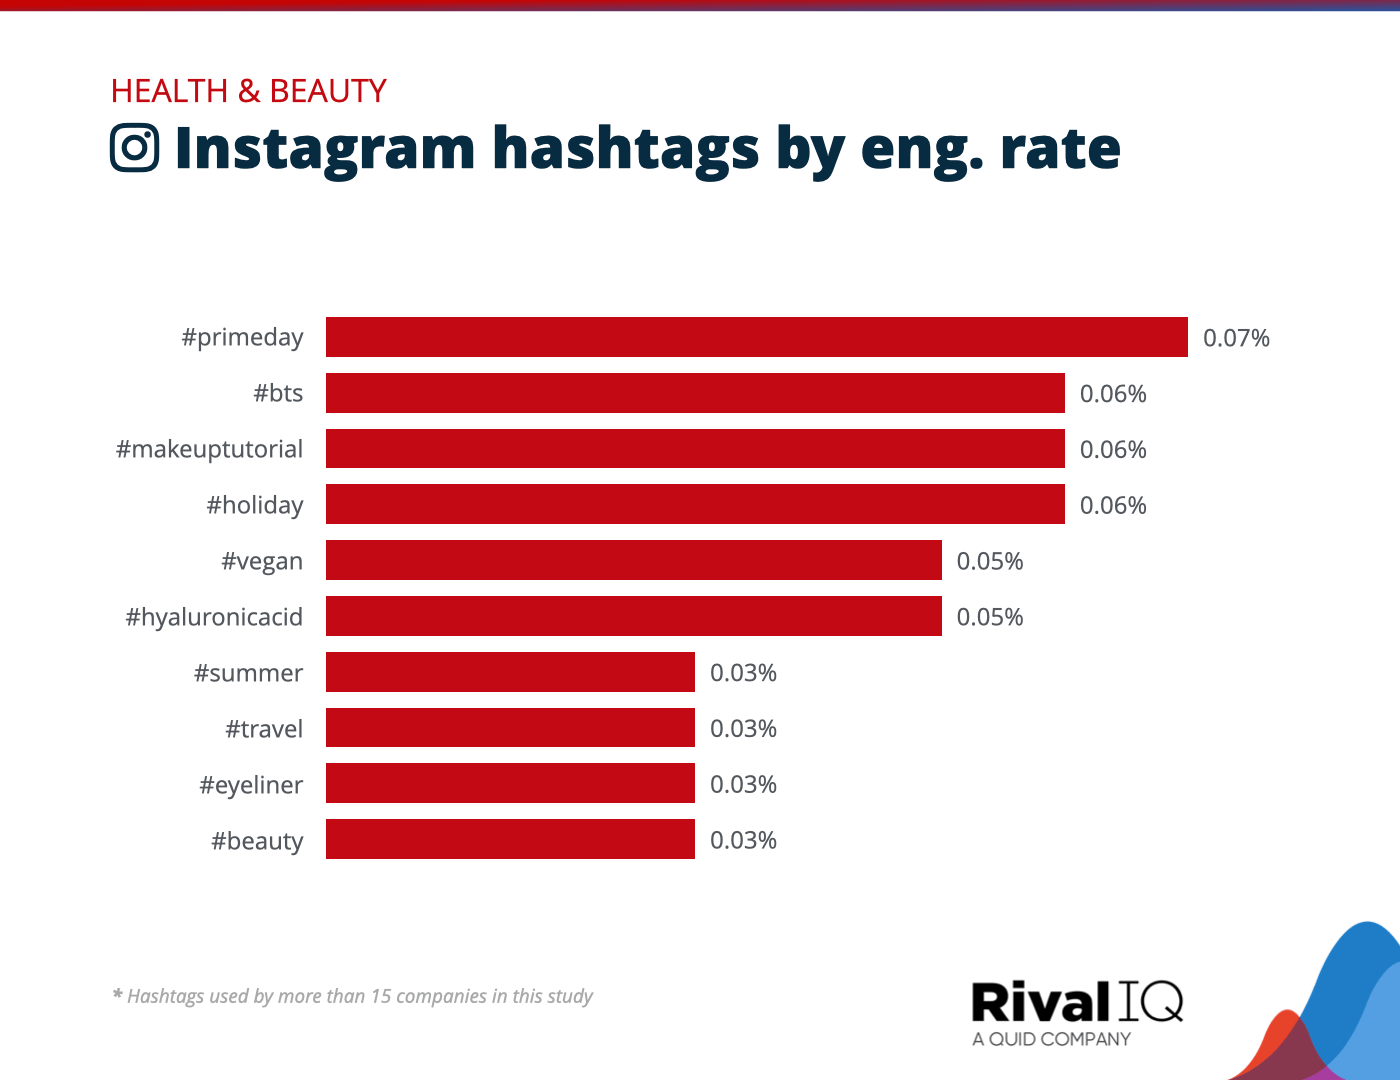
- In the health and beauty sector, Eng used the #primeday and #bts hashtags eng. rate, resulting in 0.07% and 0.06%, respectively.
- Moreover, others are followed by #makeuptutorial (0.06%), #holiday (0.06%), #vegan (0.05%), #hyaluronicid (0.05%), #summer (0.03), #travel (0.03%), #eyeliner (0.03%) and #beauty (0.03%).
By Higher Education
(Source: rivaliq.com)
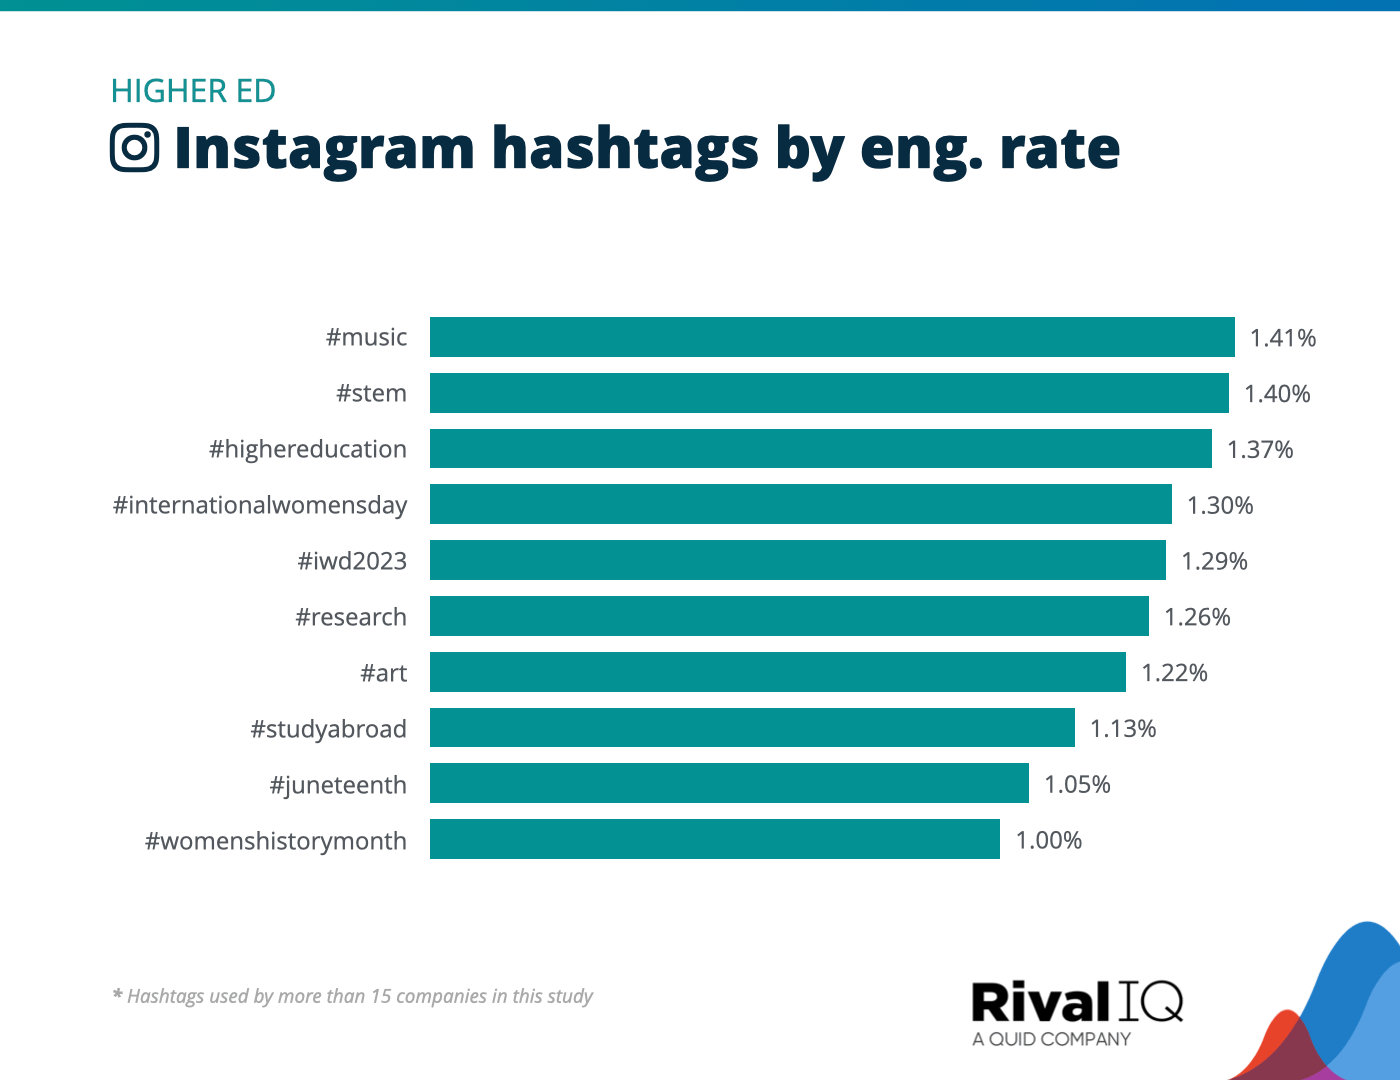
- Surprising Instagram Marketing Statistics in 2025 show that the top school-focused hashtags, such as #music, #STEM, and highereduction, have engagement rates of 1.41%, 1.40%, and 1.37%, respectively.
- Moreover, other hashtags by #internationalwomensday (1.30%), #wid2023 (1.29%), #research (1.26%), #art (1.22%), #studybroad (1.13%), #juneteenth (1.05%), and #womenhistorymonth (1.00%).
By Home Decor
(Source: rivaliq.com)
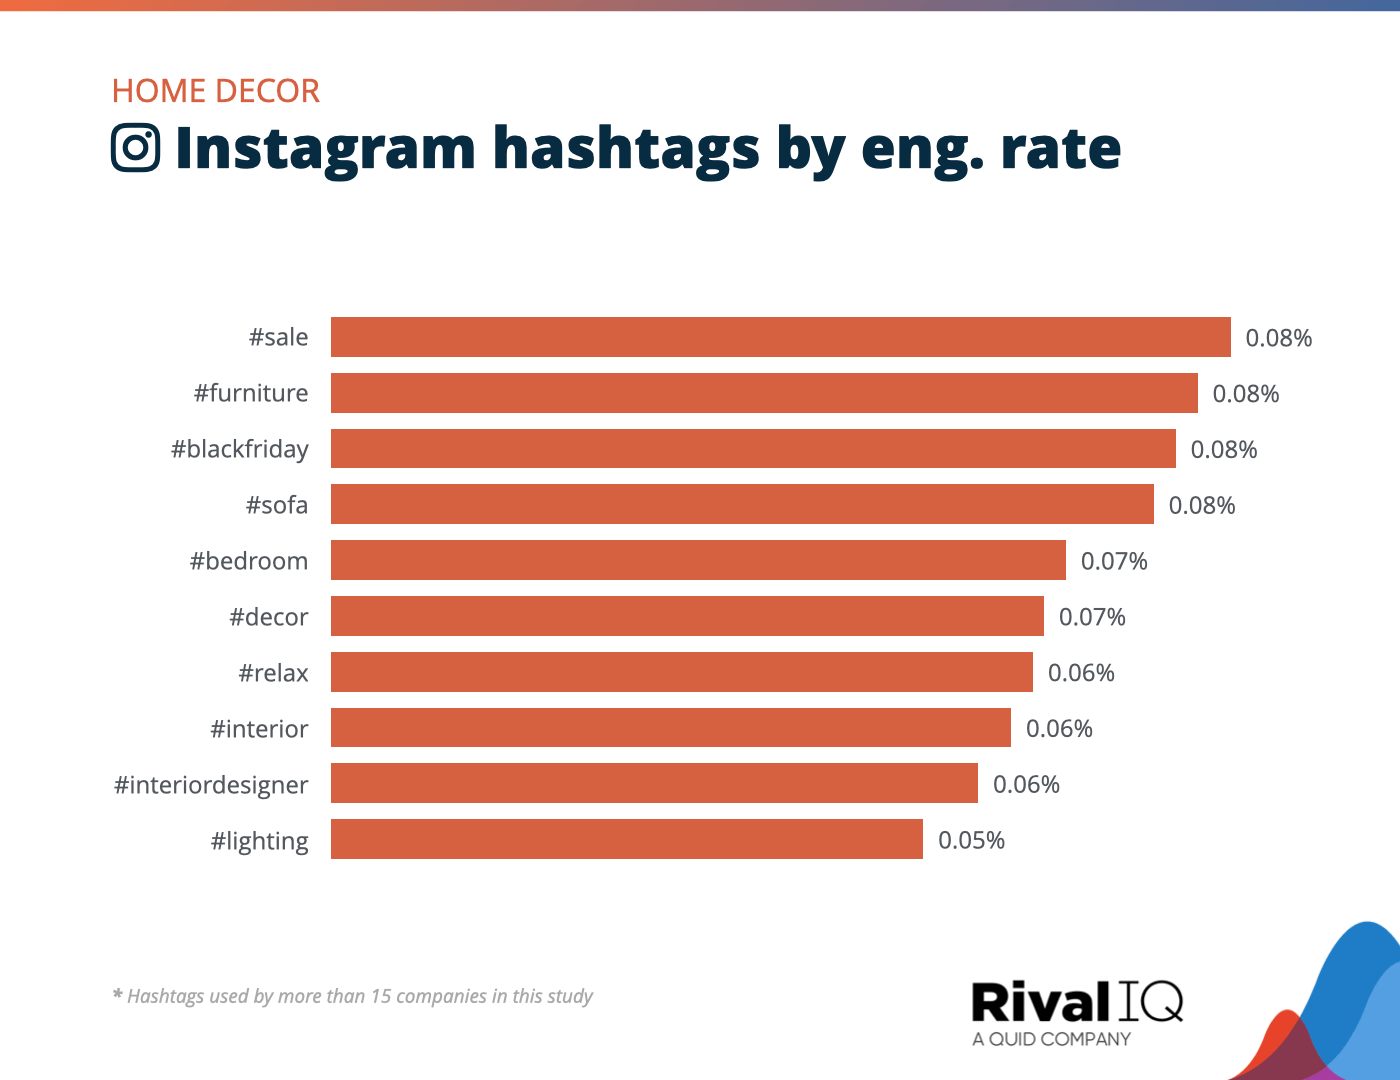
- The top five engagement rates of Home Decor Instagram hashtags in 2024 and as well as in 2025 are #sale (0.08%), #furniture (0.08%), blackfriday (0.08%), #sofa (0.08%), and #bedroom (0.07%).
- In addition, other hashtags are followed by #bedroom (0.07%), #decor (0.07%), #relax (0.06%), #interior (0.06%), #interiordesigner (0.06%), and #lighting (0.05%).
By Sport Teams
(Source: rivaliq.com)
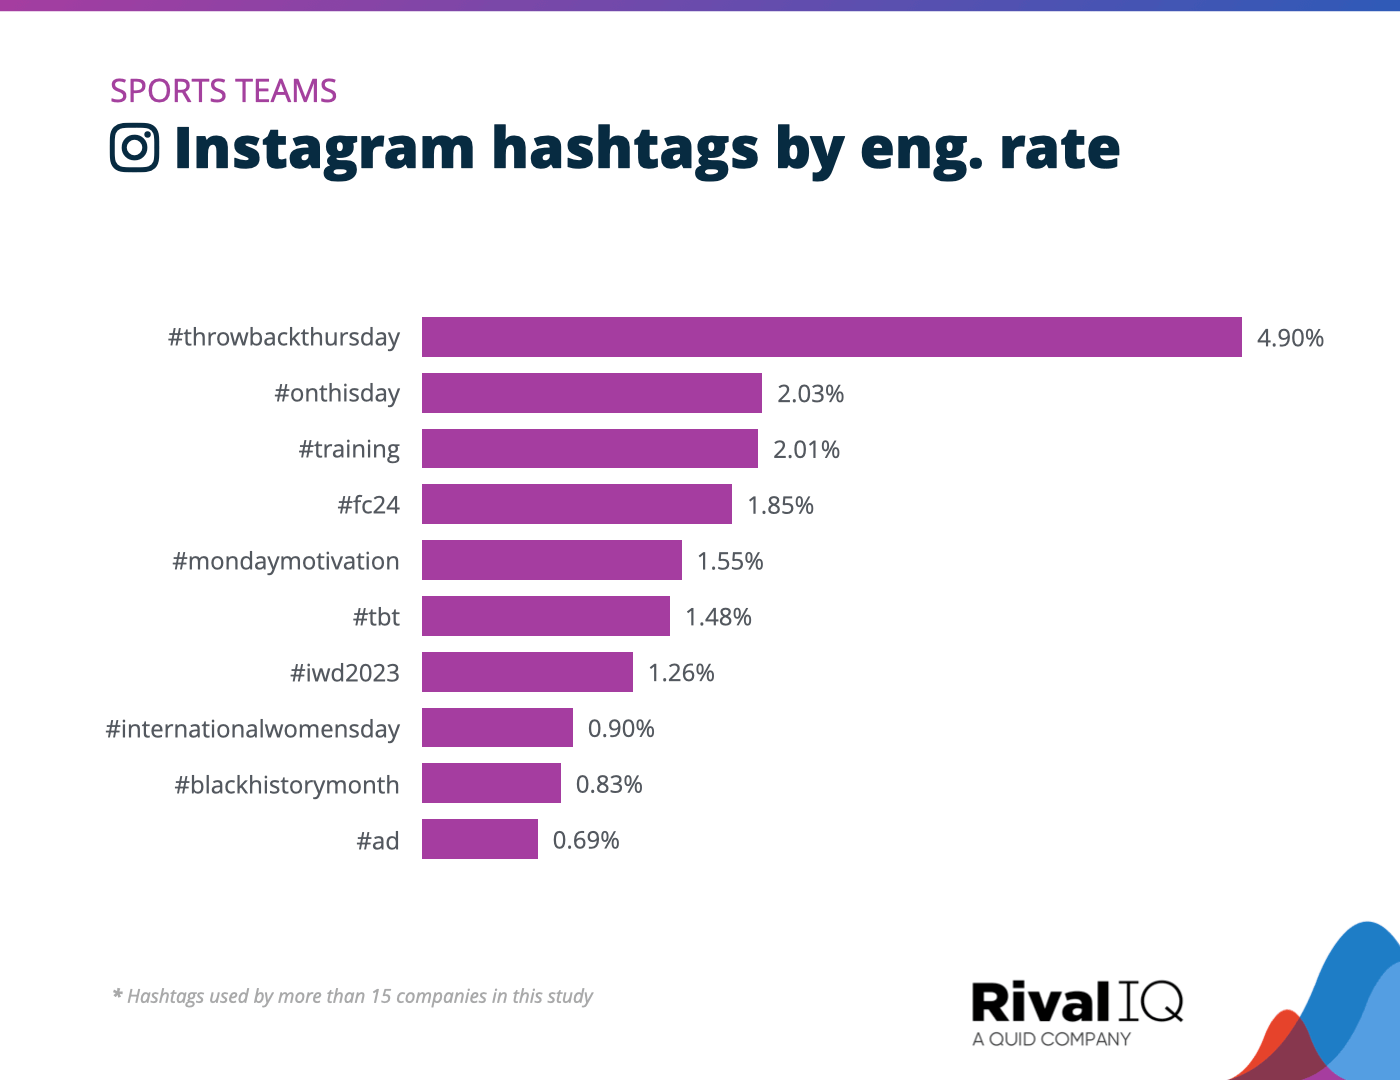
- Surprising Instagram Marketing Statistics elaborates that in 2024, as well as in 2025, #throwbackthursday and #onthisday are the top two hashtags on sports teams, with engagement rates of 4.90% and 2.03%, respectively.
- Similarly, other hashtags by English. rate is #training (2.01%), #fc24 (1.85%), #mondaymotivation (1.55%), #tbt (1.48%), #iwd2023 (1.26%), internationalwomensday (0.90%), #blackhistorymonth (0.83%) and ad (0.69%).
By Tech And Software
(Source: rivaliq.com)
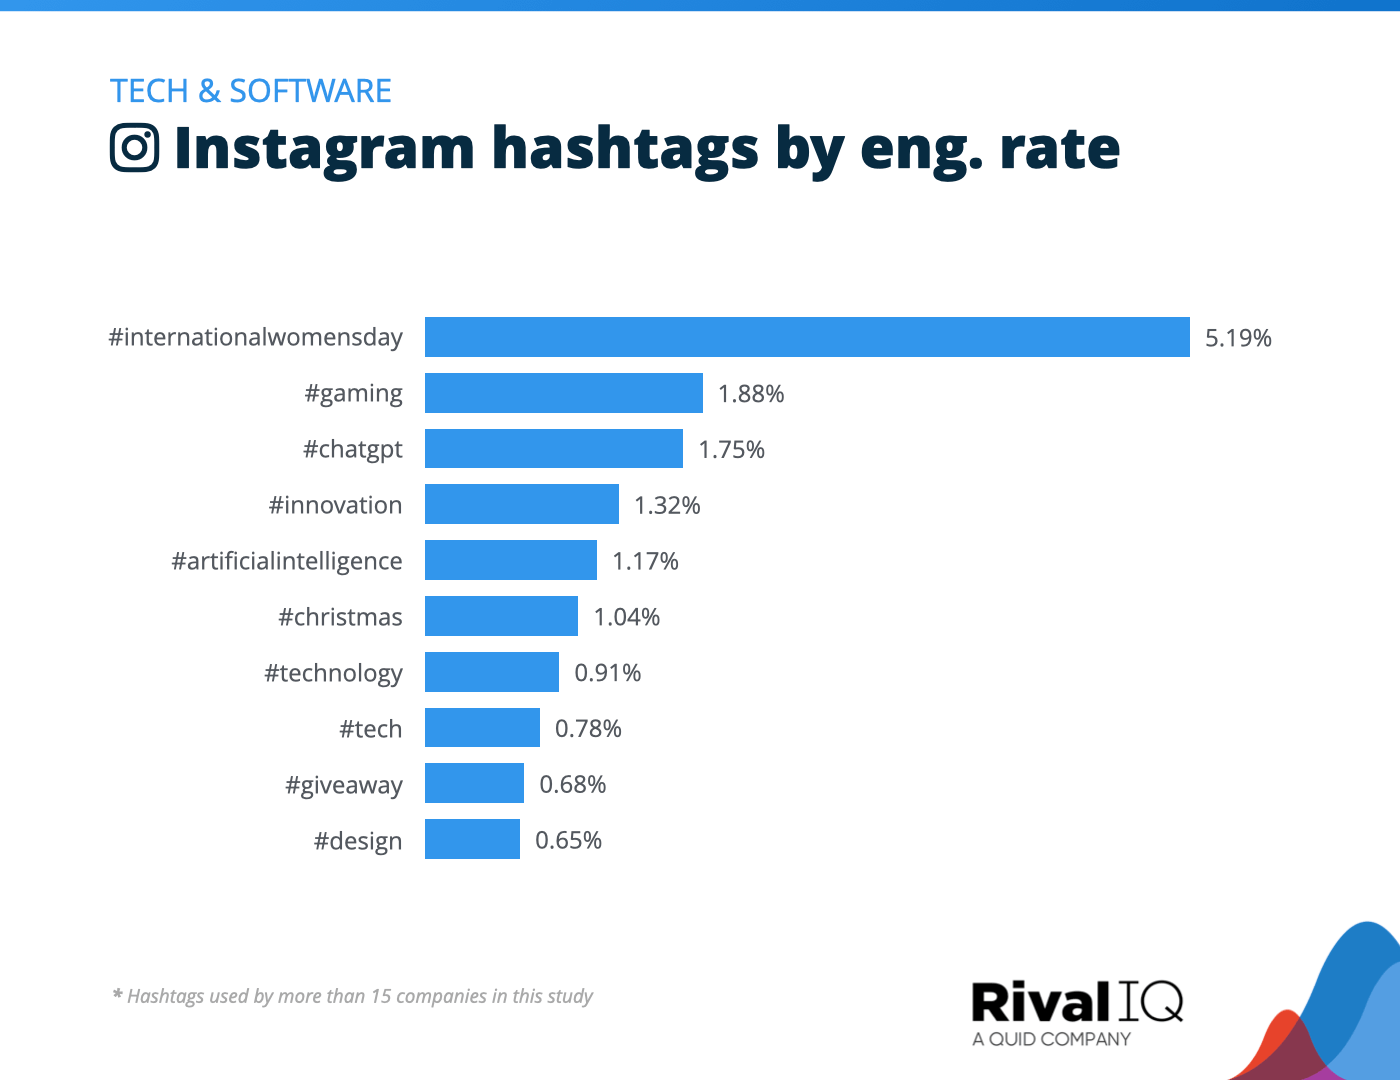
- In the technology industry, the top two used hashtags in 2024, as well as in 2025 are # InternationalWomensDay (5.19%) and #gaming (1.88%).
- In addition, the engagement rates of other tech ad software hashtags are #chatgpt (1.75%), #innovation (1.32%), #artificialintelligence (1.17%), #christmas (1.04%), #technology (0.91%), #tech (0.78%), #giveaway (0.68%), and #design (0.65%).
Instagram Change in Engagement by Type of Interaction
(Reference: statista.com)
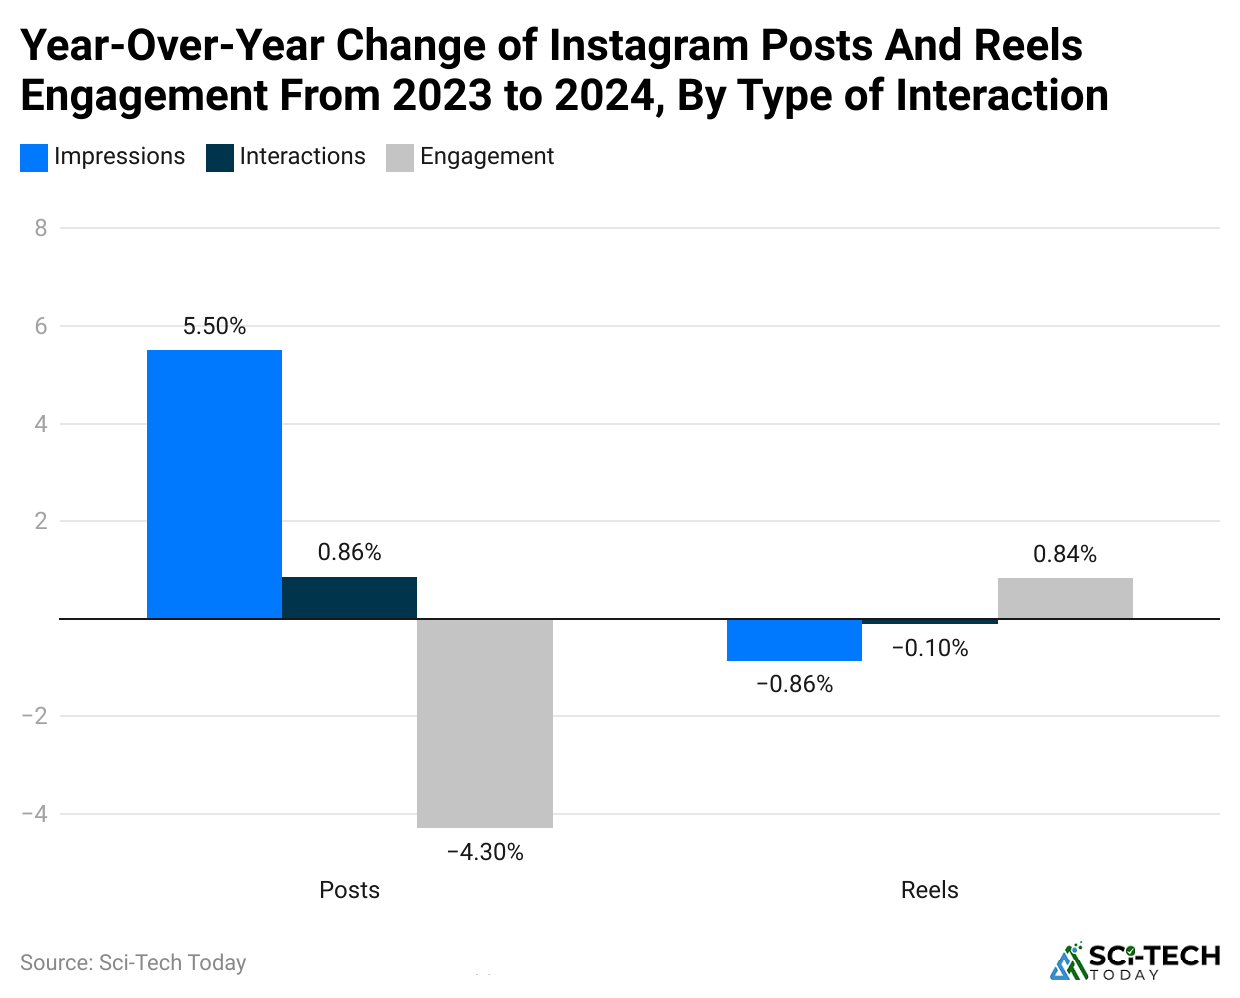
- From 2024 to 2025, the number of times people saw Instagram posts went up by 5.9%.
- At the same time, interactions on those posts, like likes and comments, grew by 0.86%.
- The overall engagement of Instagram posts decreased by 4.3%
- Surprising Instagram Marketing Statistics further state that Year-over-year change in Instagram reels engagement share by type of interactions are Impressions (-0.86%), Interactions (-0.1%), and Engagement (+0.84%).
Instagram Content Reach for Medium Accounts by Type
(Reference: statista.com)
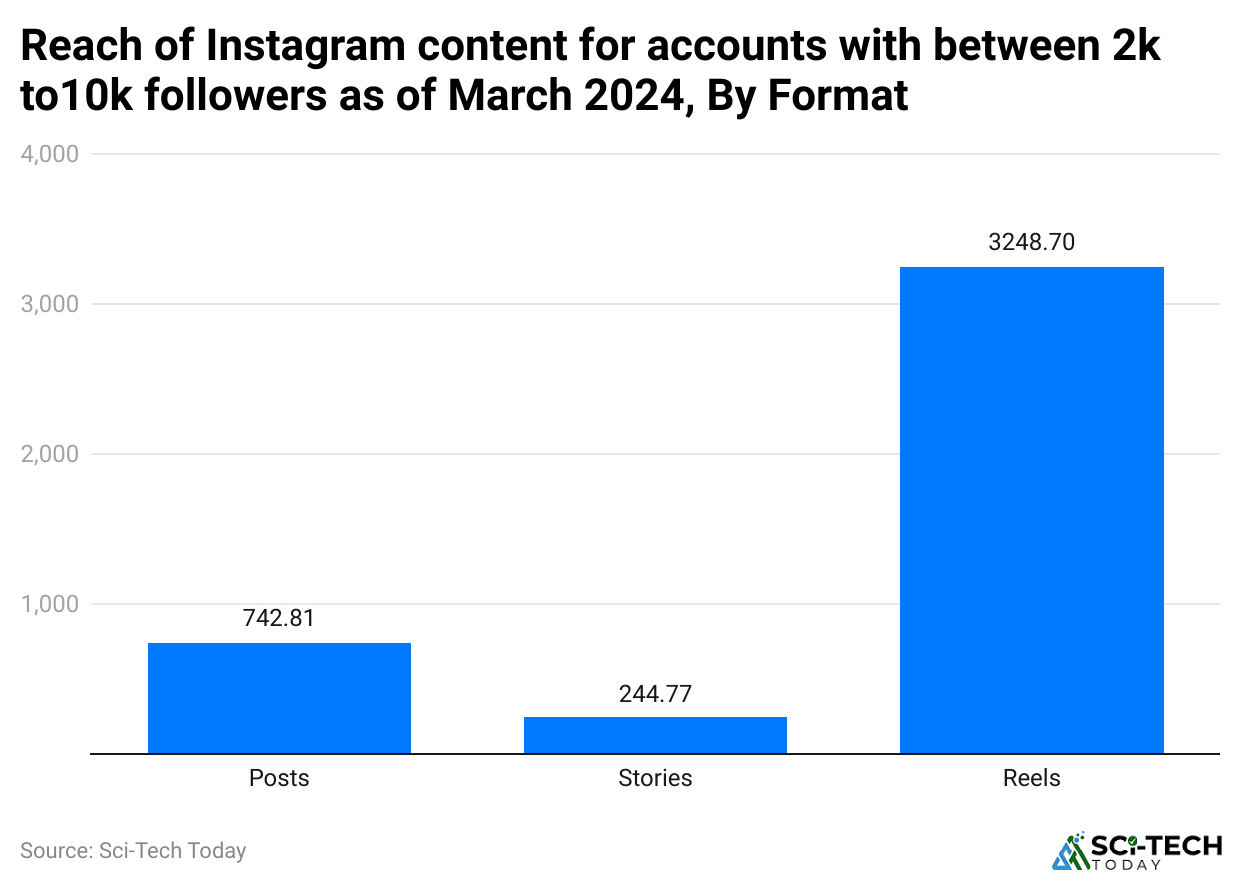
- In March 2024, Instagram posts from medium accounts with 2,001 to 10,000 followers accounted for an average of 742.81 users.
- Meanwhile, medium store accounts resulted in 244.77.
- Besides, their reels reached about 3,248 users.
Instagram Content Reach for Small Accounts by Type
- According to Surprising Instagram Marketing Statistics, in the meantime, small Instagram profiles that have 501 to 2,000 followers are normally equivalent to 230 people per posting.
- Their stories, on average, get around 113 people while the reels get about 956 users.
Instagram Content Reach for Big Accounts by Type
- A study from 2024 to 2025 found that Instagram posts from accounts with 10,001 to 50,000 followers covered an average of 2,909 users.
- 2025 benchmarks indicate that accounts in this size range averaged around 2,424 impressions per Reel and a 3.12% engagement rate
- Stories reached around 642 users, while reels turned out to 9,649 users on average.
Instagram Content Reach for Large Accounts by Type
- In March 2024, very large Instagram accounts, with more than 50,001 followers, posted content that attracted over 45,000 users.
- Stories from these accounts reached 5,100 people, and reels reached 67,973 people.
Instagram User by Top Countries
- A report published by DataReportal states that India secured the highest number of Instagram users, resulting in 388.3 million, by 2024.
- The United States of America will account for 168.75 million users, followed by Brazil (137.15 million), Indonesia (102.15 million), Turkey (57.8 million), Japan (55.8 million), Mexico (46.35 million), the United Kingdom (33.3 million), Germany (30.55 million), and Argentina (28.3 million).
Instagram Leads to Sales Statistics
(Reference: cloudfront.net)
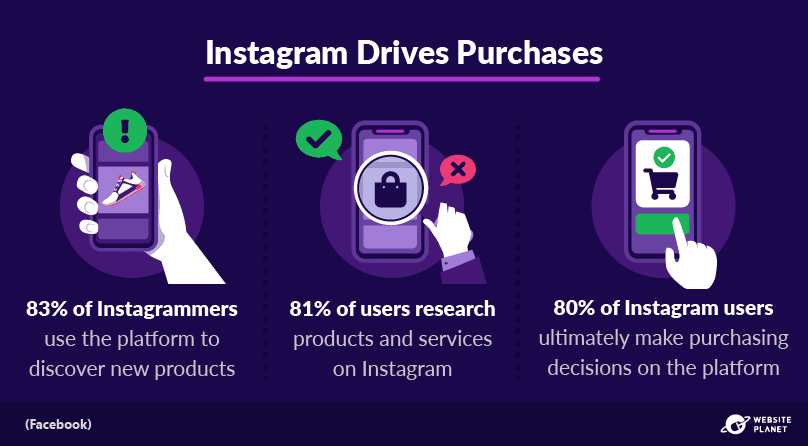
- In 2025, almost 85% of Instagram users are using the application to discover new products.
- On Instagram, 81% of users research products and services.
- Meanwhile, the final purchasing decision via Instagram is taken by 80% of users.
Estimated Annual Instagram Revenue Statistics
(Reference: statista.com)
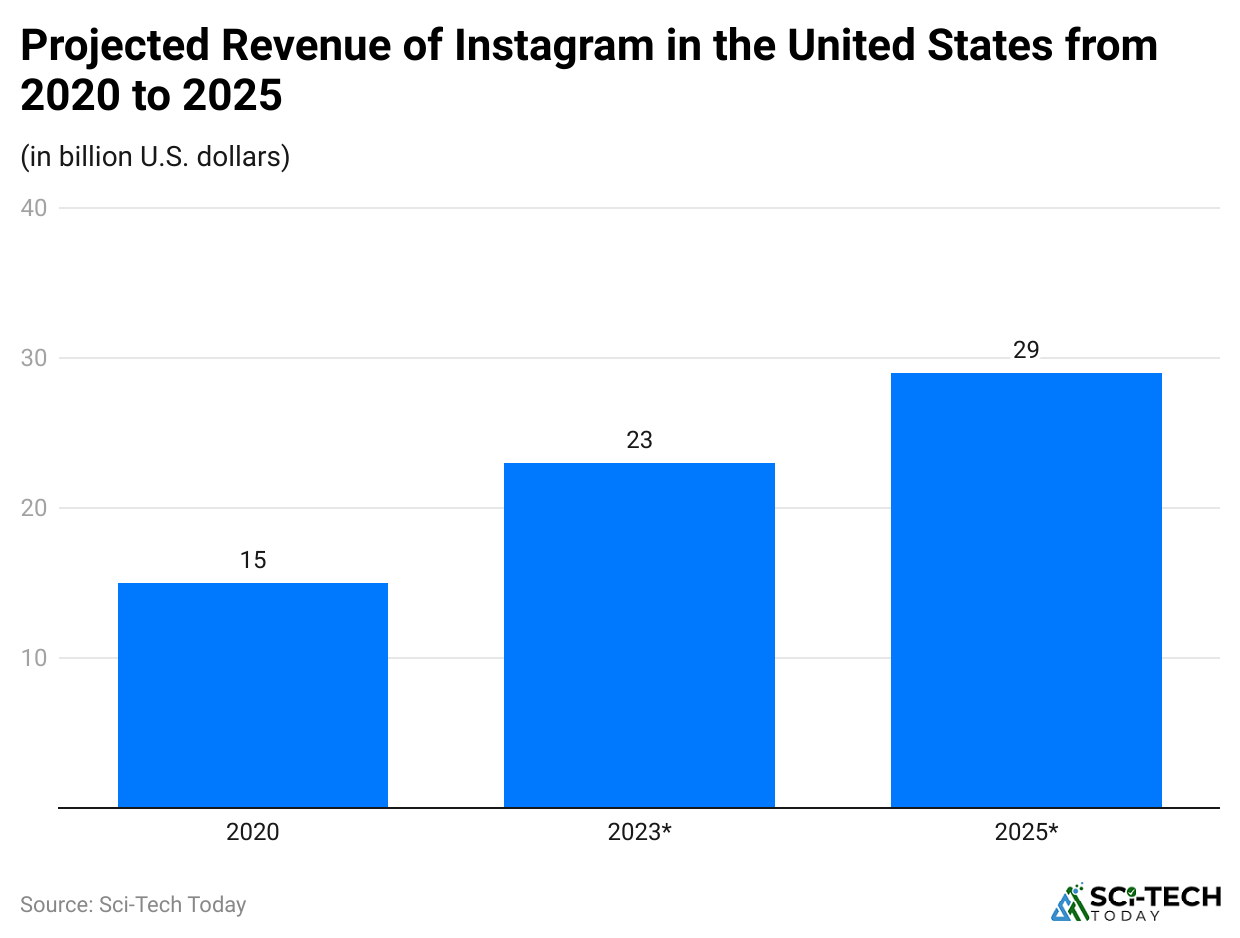
- In the United States, Instagram’s total revenue was around USD 23 billion.
- By the end of 2025, the revenue amount will amount to up to USD 29 billion.
Instagram Brand Valuation Statistics
(Reference: statista.com)
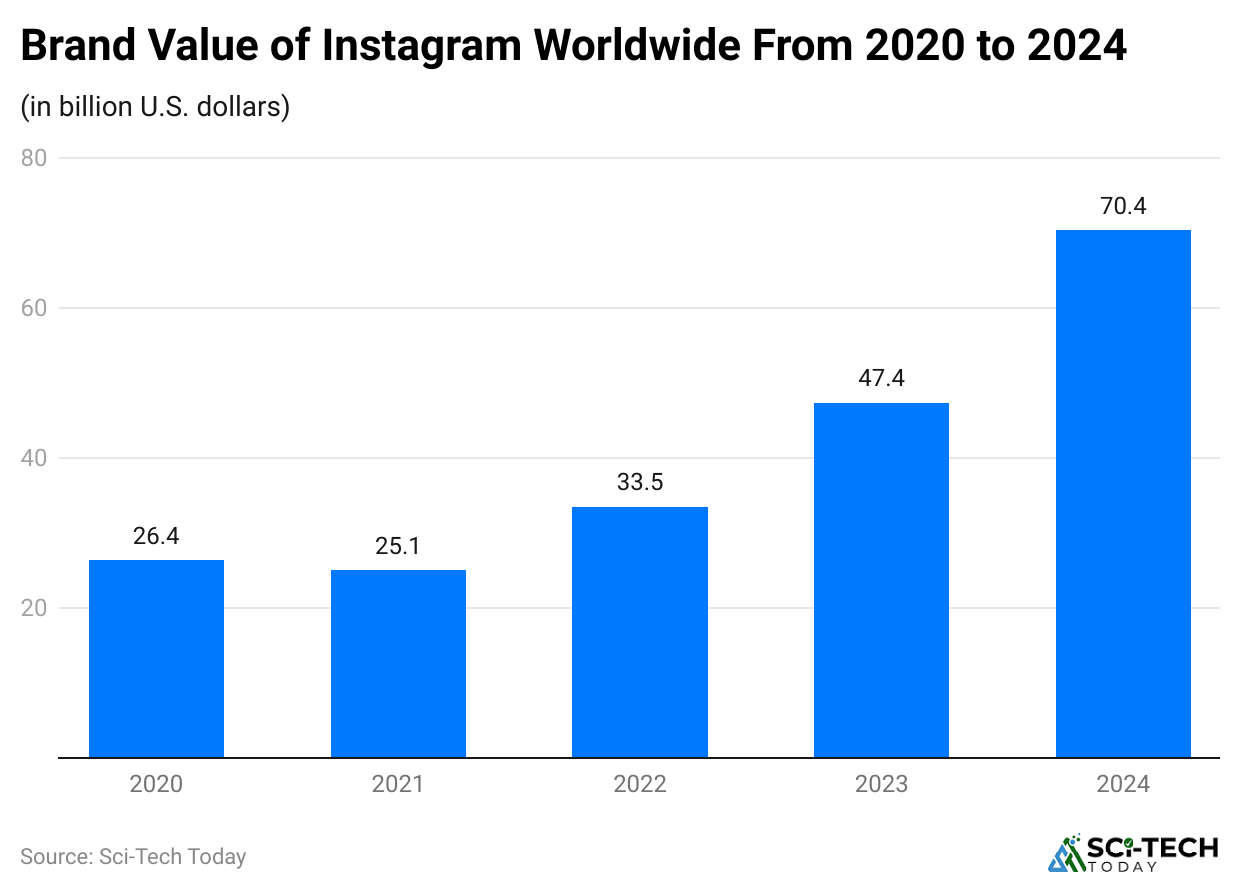
- In 2025, Instagram’s brand will be worth almost 76 billion U.S. dollars.
- But in the previous year, it was valued at 70.4 billion U.S. dollars.
Instagram Users Statistics
(Reference: statista.com)
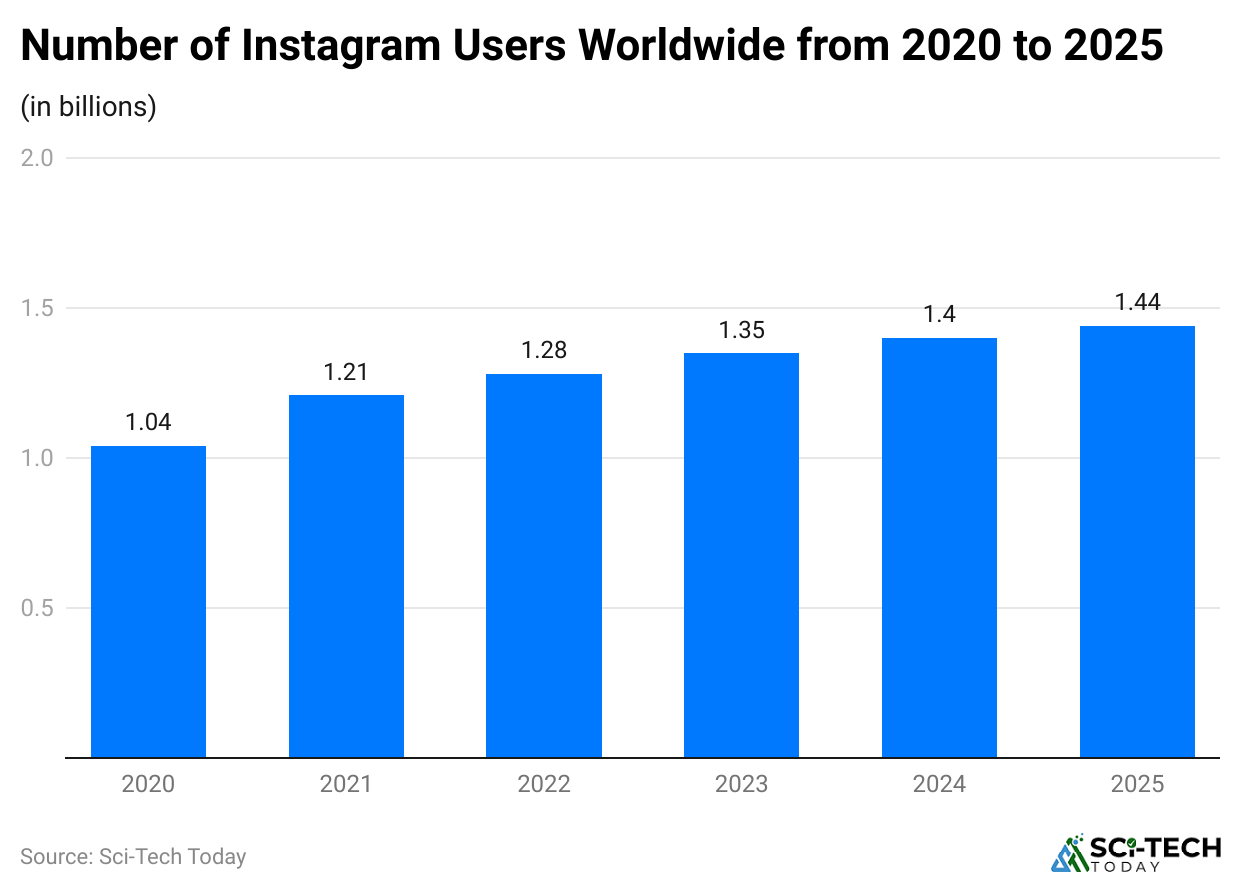
- The graph shows that by 2025, Instagram will likely have 1.44 billion people using it every month, which will be 31.2% of all internet users globally.
- It is estimated that there will be around 1.4 billion users as of 2024, an increase from 2023 (1.35 billion).
Global Audience Distribution of Instagram by Age Group
(Reference: statista.com)
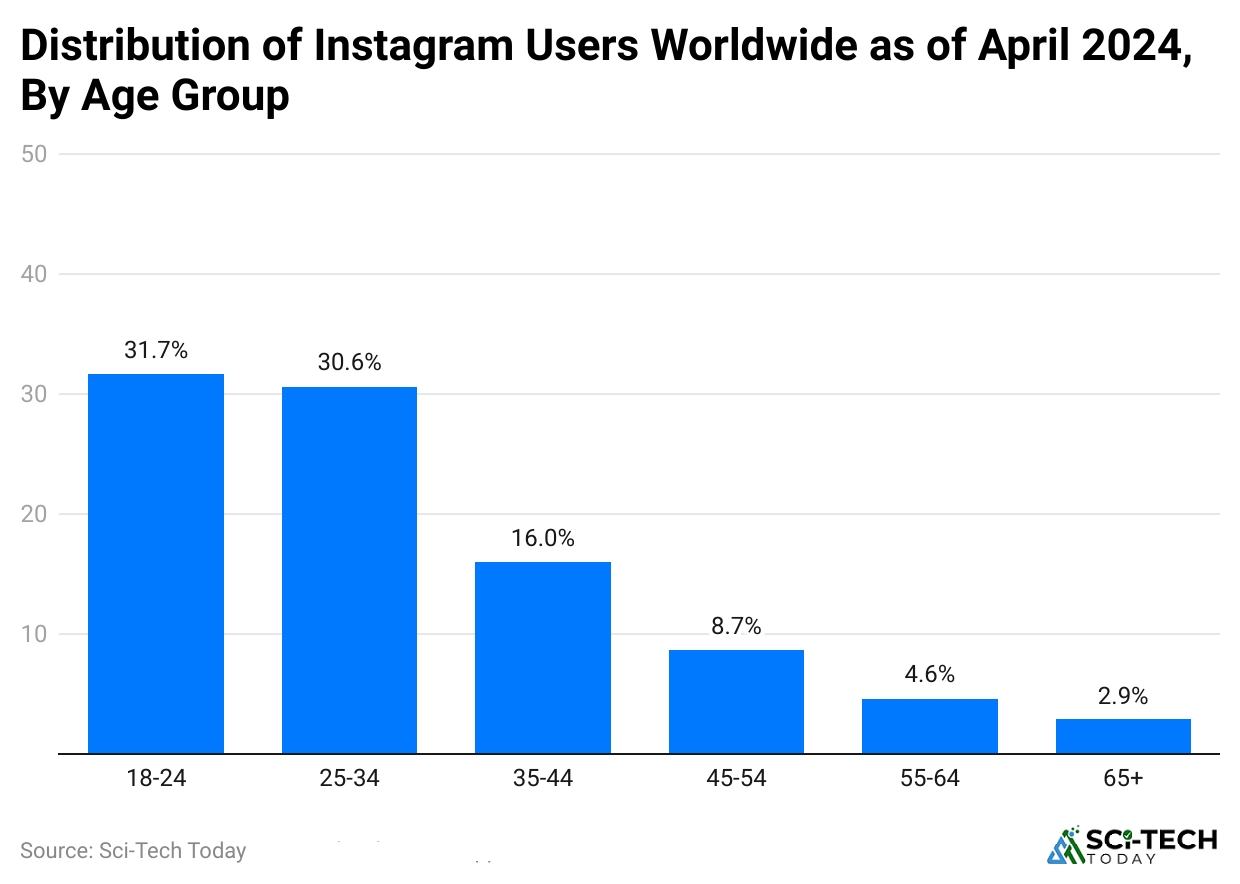
- As of April 2024, about 32% of Instagram users worldwide were aged 18 to 24, while 30.6% were aged 25 to 34.
- Around 16% of users were in the 35 to 44 age group.
- The distribution of Instagram users worldwide at the same time is 45 to 54 years old (8.7%), 55 to 64 years old (4.6%), and 65 years and above (2.9%).
The Most Popular Posts on Instagram, 2025
| Popular Posts | Number of likes (millions) |
| @leomessi: Photos of Lionel Messi and his teammates after winning the 2022 FIFA World Cup with Argentina |
75.4 |
|
@world_record_egg: Photo of an egg | 60.5 |
| @leomessi: Lionel Messi in bed with Mate drink and the FIFA World Cup Trophy |
54.5 |
|
@cristiano: Lionel Messi and Cristiano Ronaldo playing chess in an advertisement for Louis Vuitton | 42.5 |
| @leomessi: Lionel Messi on an aeroplane with the FIFA World Cup Trophy |
41.8 |
|
@leomessi: Celebrating the 2022 FIFA World Cup in Argentina | 34.2 |
| @jiangzhibin24: Reel of a sunset |
34.2 |
|
@cristiano: After Portugal was eliminated from the 2022 FIFA World Cup | 34 |
| @leomessi: Lionel Messi and Cristiano Ronaldo playing chess in an advertisement for Louis Vuitton |
32.7 |
WNBA Instagram Followers by Team
(Reference: statista.com)
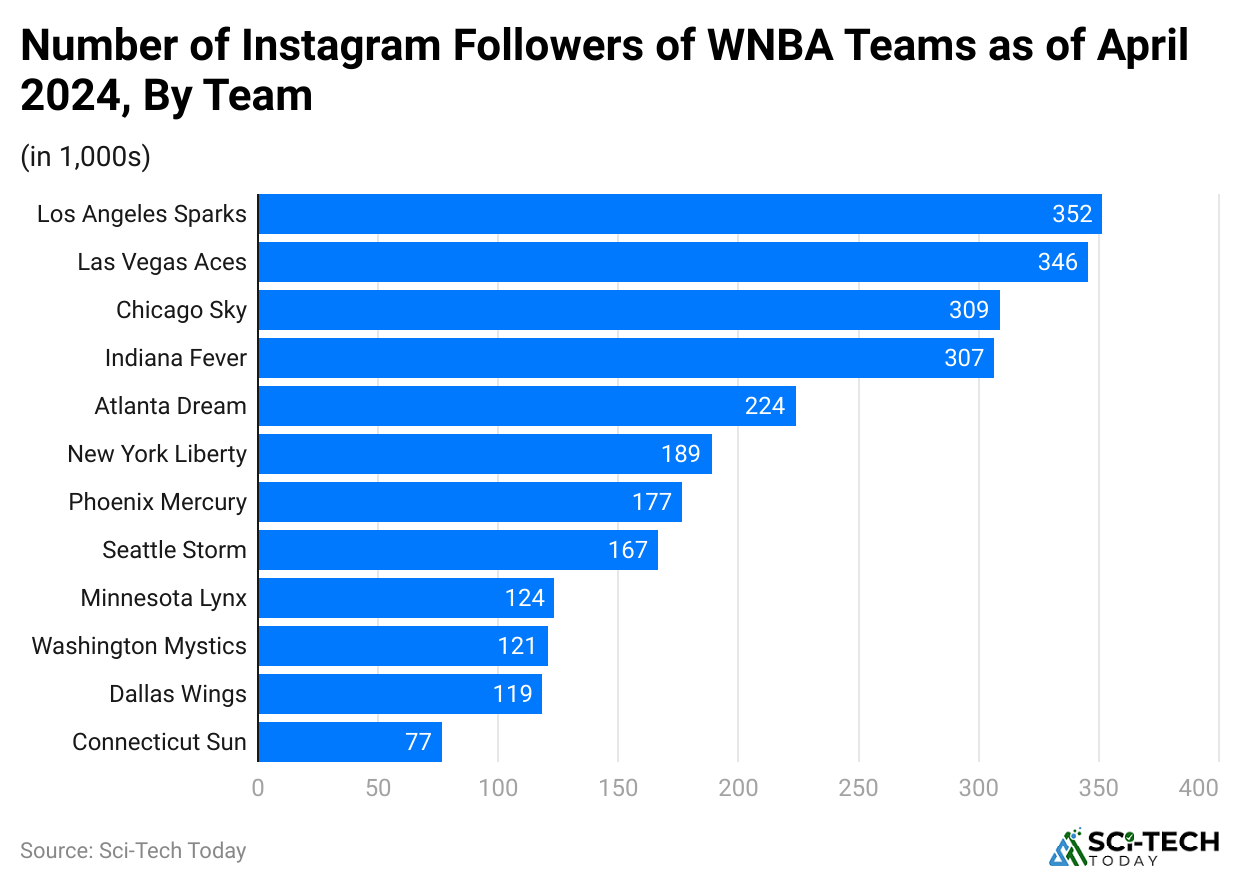
- As of 2025, the Indiana Fever had the largest Instagram following among WNBA teams, with approximately 662,000 followers.
- Furthermore, other numbers of Instagram followers of WNBA teams by teams in the same duration are Las Vegas Aces (346K), Chicago Sky (309K), Indiana Fever (307K), Atlanta Dream (224K), New York Liberty (189K), Phoenix Mercury (177K), Seattle Storm (167K), Minnesota Lynx (124K), Washington Mystics (121K), Dallas Wings (119K) and Connecticut Sun (77K).
NBA Instagram Followers by Team
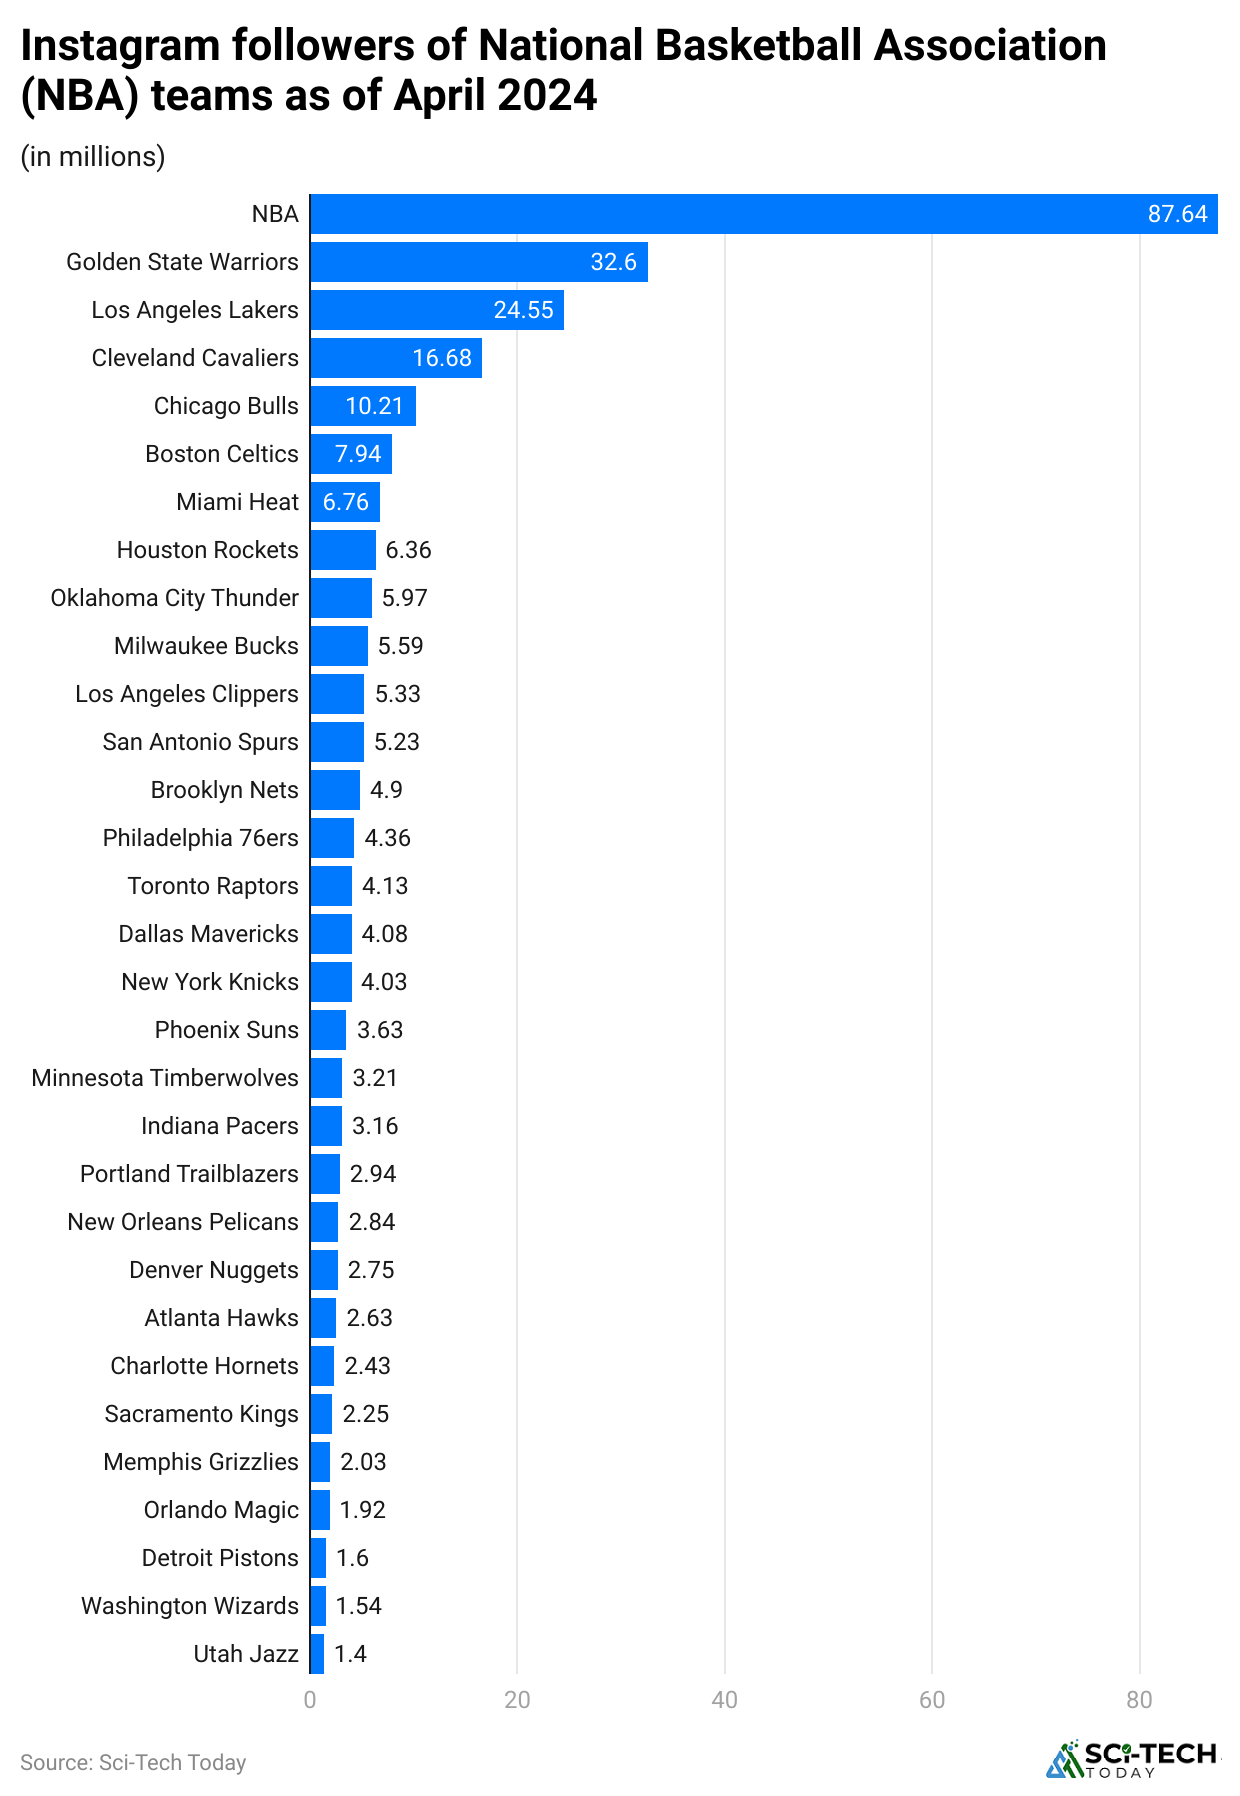
(Reference: statista.com)
- In 2025, the Golden State Warriors remained the most-followed NBA team on Instagram, with approximately 32.6 million followers.
- The Los Angeles Lakers remained second, with around 25.3 million followers up from 24.55 million in April 2024.
- NBA Official Account: The NBA’s official Instagram account boasts about 87.64 million followers, highlighting the league’s massive reach.
Influencer Marketing Spending in the U.S. By Platform
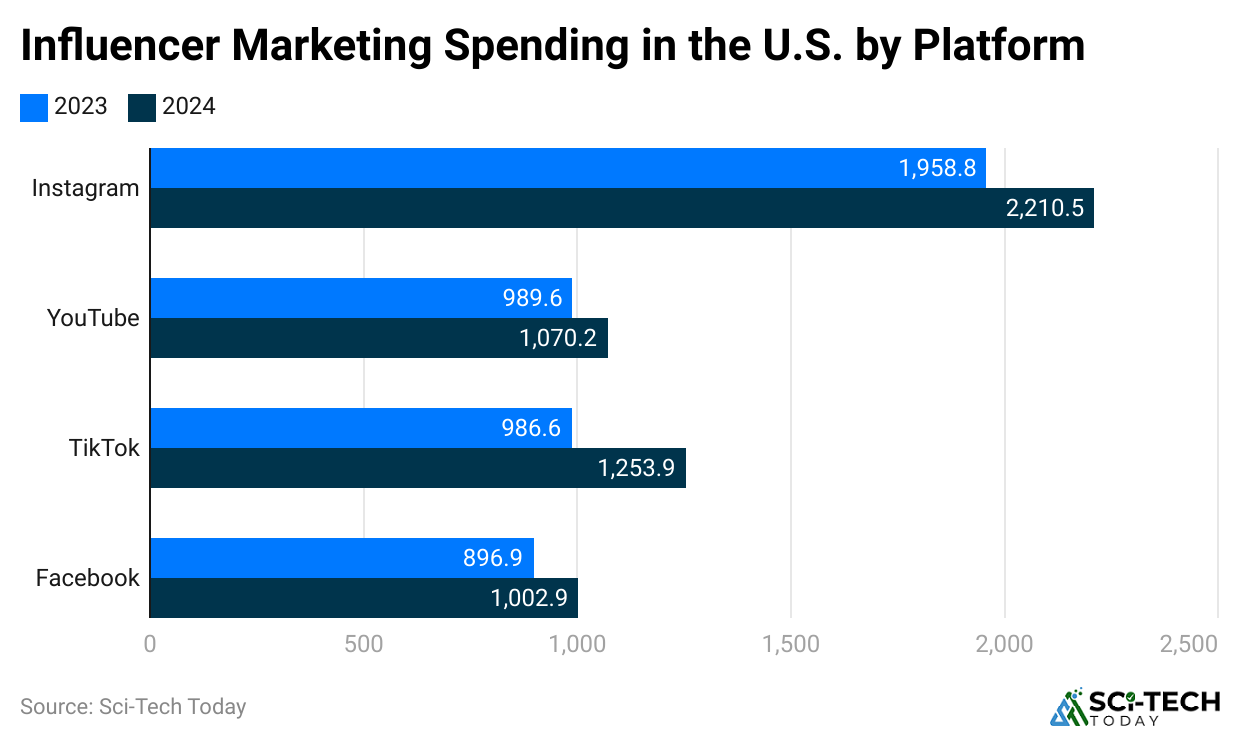
- According to the latest EMARKETER estimates, U.S. businesses spent approximately USD 3.43 billion on Instagram influencer marketing in 2025.
- Facebook: U.S. businesses spent approximately USD 1.27 billion on Facebook influencer marketing in 2025.
Instagram Conversions Statistics vs Other Platforms
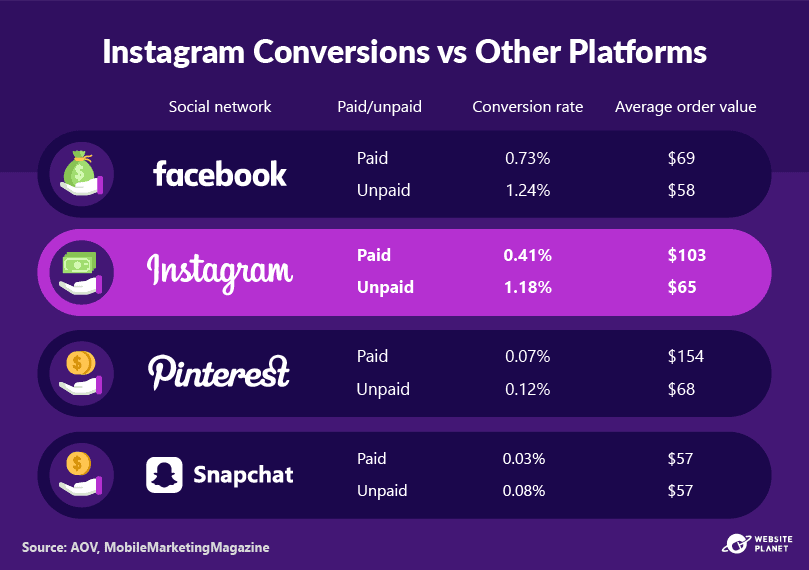
(Reference: cloudfront.net)
- The advertisements on Instagram were able to convince 50% of Instagram’s user base to be interested in the company/brand.
- However, according to Instagram Marketing Statistics, the increased conversion rate is attributed to 0.41% for the paid social media post and 1.18% for the unpaid social media post.
- The consumers who purchase anything have to pay USD 103 for the paid conversion and USD 65 for the unpaid conversion.
Conclusion
As Instagram continues to grow, it remains an essential platform for businesses to include in their digital marketing strategies. Through visual and engaging content, it helps businesses build stronger connections and increase sales.
This article on Surprising Instagram Marketing Statistics elaborates effectively on how Instagram marketing is an essential tool for businesses in today’s world.
FAQ
Instagram marketing is the use of the Instagram platform to promote a brand, product, or service.
To start marketing on Instagram, switch your personal account to a professional Business or Creator Account to access analytics.
A 30-second ad costs anywhere from USD 1,500 to over USD 500,000 to produce, while airing it ranges from a few hundred dollars on local cable to roughly USD 8 million for a major national broadcast like the Super Bowl.