





Introduction
Smartphone Sales Statistics: It’s hard to imagine life without smartphones. They have become an essential part of our daily lives. Smartphones are everywhere, with over 80% of people in the United States using them for browsing the web, conducting business, messaging, and communicating.
Despite being a relatively recent invention, smartphones can do a lot, from recognizing faces and enabling video chats to taking high-quality photos and effortless internet browsing. Let’s take a closer look at smartphone sales statistics
Editor’s Choice
- Smartphone sales in the U.K. increased from 2022 to 2023, with 29.9 million phones sold compared to 28.6 million in the previous year. This suggests a growing market or potentially increased consumer demand or upgrade cycles.
- The U.S. ranks third in smartphone sales, highlighting its importance but trailing behind China and India.
- In 2022, approximately 1.39 billion smartphones were sold worldwide.
- In 2023, Samsung’s revenue decreased by 8% year over year despite growing by 11% quarter over quarter and retaining its position as the top smartphone player.
- Apple’s ability to outsell Samsung in 2023 could be attributed to strategic product launches, innovations, and stronger consumer loyalty or market expansion.
- Xiaomi’s strong sales highlight its potential to challenge the top two brands, especially in markets with a strong presence.
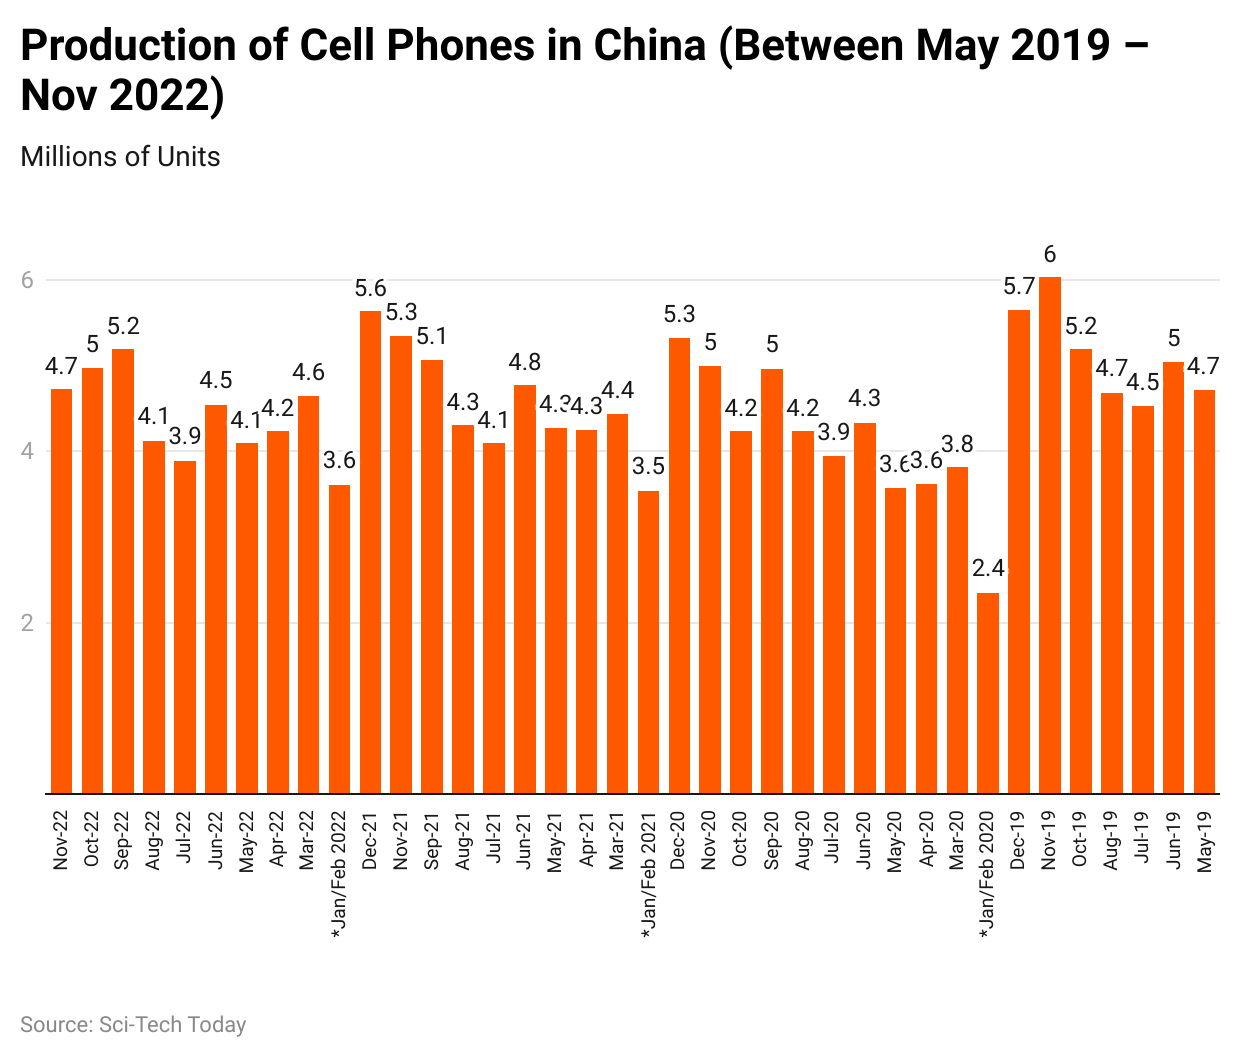
- The lowest production occurred in January/February 2020, with 2.35 million daily units, likely influenced by the Chinese New Year and the COVID-19 pandemic.
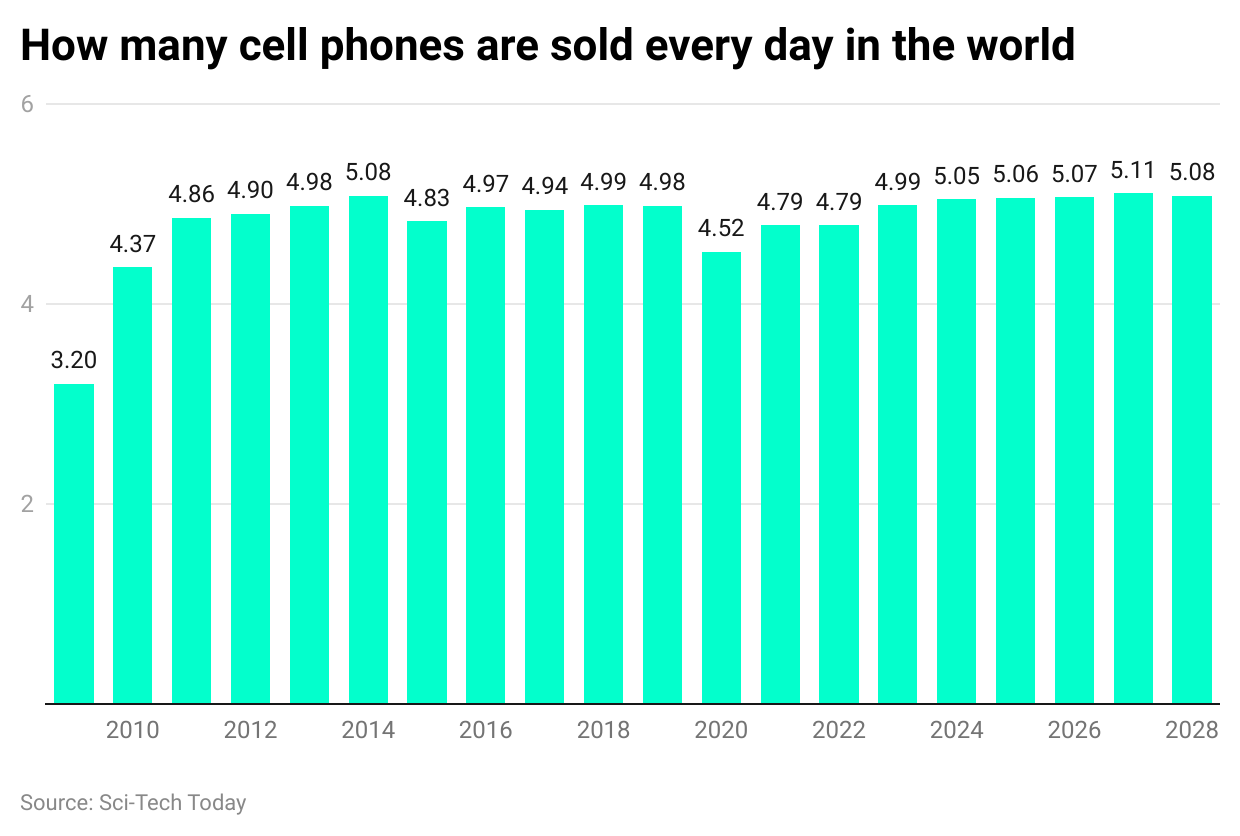
- The peak daily average occurred in 2014, with 5.08 million units sold daily. Projections indicate that by 2027, the daily average will increase to 5.11 million units.
- Huawei’s market share in 2023 in India was around 0.41%. Compared to 2023, it has fallen by 0.04%. This brand is ranked 11th in the market.
- Of the top 5 smartphone brands, Xiaomi grew by 23% year over year to around 40.7 million units in 2023.
Evolution of Smartphones
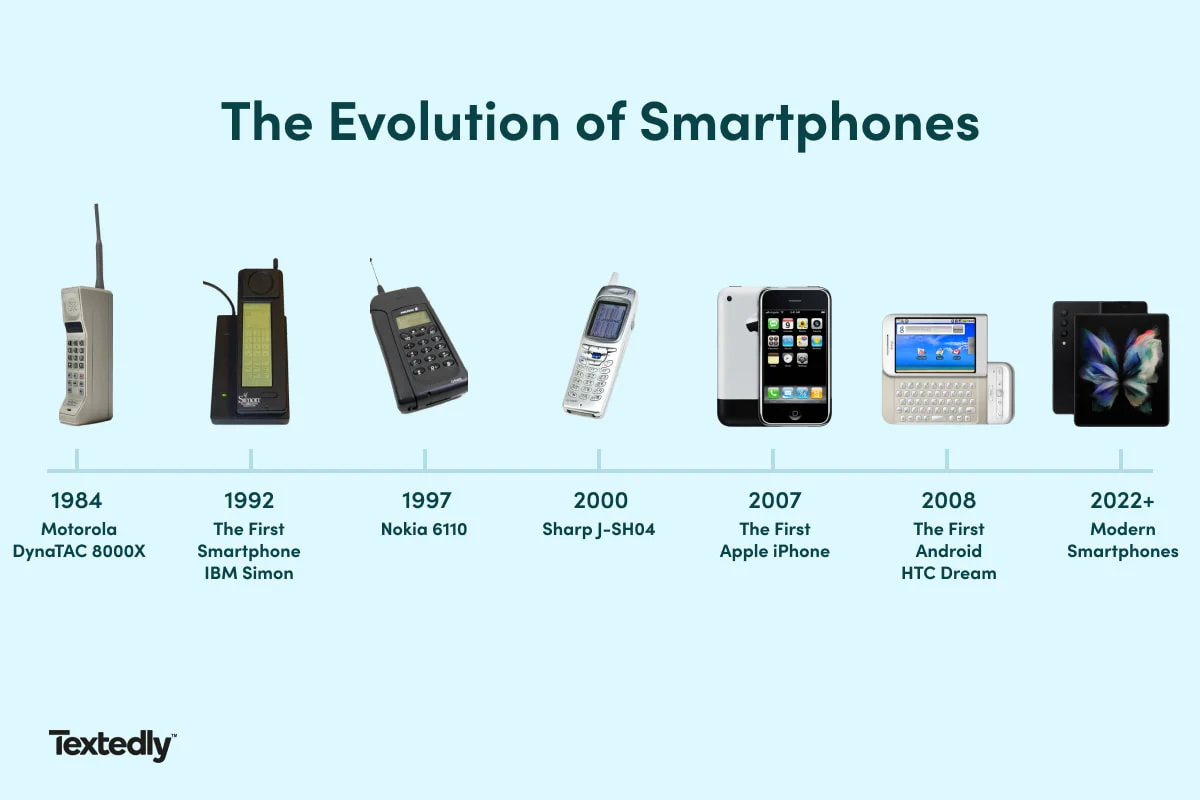
(Source: textedly.com)
1973: The First Cell Phone Is Invented:
- Cellular phones were a key step toward the advent of portable digital technology, preceding the arrival of smartphones.
- Martin Cooper of Motorola made the first cell phone call in April 1973. Although portable phones became widely available another ten years later, this pioneering event set the stage for future mobile communication advancements.
1984: The First Portable Mobile Device:
- Almost four decades ago, Motorola launched the DynaTAC 8000X, the first mobile phone.
- At a hefty $4,000, it was never intended for widespread use among the general population. Weighing two pounds, the DynaTAC 8000X earned the nickname “The Brick” due to its bulkiness. Its battery life was a mere 30 minutes.
1992: The First Smartphone:
- IBM announced the first smartphone in 1992, but it became available two years later.
- The Simon Personal Communicator (SPC), commonly called IBM Simon, offered features that are now common in modern smartphones, such as a touch screen that operated with a stylus. However, fully functional touch screens were still some years away.
- Despite its groundbreaking features, the SPC was quite basic by today’s standards. It featured a small monochrome LCD screen and a battery life of only one hour.
1994: The Earliest Form of Smartphone Apps:
- The IBM Simon was released in 1994. At $1,100, it was significantly less expensive than the DynaTAC 8000X, but only about 50,000 units were sold in its first six months. Its functionality was also limited to just 15 U.S. states.
- Although it was less bulky than earlier mobile phones, the Simon was still quite large and boxy. A groundbreaking feature of the IBM Simon was its array of built-in applications, including a calendar, address book, calculator, email, notepad, and more.
1997: The Start of Mobile Gaming:
- Are you a fan of Wordle, or does Roblox suit your taste better? Back in 1997, the landscape of mobile gaming was quite different.
- Nokia 6110 users were introduced to Snake, a game crafted by Finnish software engineer Taneli Armanto during that time.
- Its straightforward and family-friendly gameplay quickly captured the hearts of players, marking the inception of the mobile gaming industry, which has since grown to over $152 billion. In the same year, Ericsson coined the term “smartphone” to describe their GS88 prototype, though it never reached the market. This term was introduced a decade before the debut of the iPhone.
2000: The First Camera Phone:
- As the new millennium began, Sharp introduced the concept of the camera phone to the world. While initially available only in Japan, the J-SH04 marked the start of a growing fascination between phone users and photography.
- Weighing a mere four ounces, the J-SHO4 brought phones closer to the sleek and slender designs we see today. However, its camera quality fell far below the expectations of modern smartphone users, offering only 110,000 pixels.
- In contrast, the iPhone 14 now boasts three rear cameras, including a 48-megapixel main camera. Notably, the J-SH04’s camera was exclusively rear-facing, hinting at the era of the selfie, which was still on the horizon.
2001: Cell Phones Access the Internet:
- In 2001, a groundbreaking development occurred as smartphones seamlessly connected to 3G networks for the first time.
- This integration revolutionized smartphones’ capabilities, allowing users to send email attachments and engage in video conferences on their mobile devices.
- However, this advancement came at a cost. While the smartphones themselves were priced between $300 and $700, the expense of data services rendered these new capabilities inaccessible to many users due to their high cost.
2007: Apple Takes a Bite of the Smartphone Market:
- In 2007, the smartphone landscape witnessed a monumental shift when Steve Jobs introduced the world’s first iPhone at the Macworld convention in January.
- This groundbreaking device boasted numerous features, including a touchscreen, iPod functionality, a camera, full internet access (a first for smartphones at the time), and a spacious LCD screen ideal for video viewing.
- With its sleek design, lightweight construction, and availability in 4 GB ($499) and 8 GB ($599) models, the iPhone set a new standard for mobile devices.
2008: The First Android Smartphone:
- The first Android smartphone, known as the HTC Dream or T-Mobile G1, emerged from a collaboration between HTC and Google.
- The HTC Dream debuted with Android 1.0, the inaugural version of the Android operating system. Sporting a 3.2-inch touchscreen display, a slide-out QWERTY keyboard, and a 3.2-megapixel camera, it was a pioneering device.
2020: The Modern Smartphone:
- The introduction of the iPhone marked a significant turning point in the history of smartphones, setting off a chain reaction of rapid advancements in features and capabilities.
- This pivotal moment reshaped the entire landscape of mobile technology. Today’s smartphones boast unprecedented levels of memory, speed, and processing power, far surpassing what was previously thought imaginable.
- A multitude of apps have emerged, offering users a diverse range of functionalities and services, many of which have become monetized. Across the board, there have been remarkable advancements in smartphone technology.
2023 and Beyond: What’s Next?:
- Future smartphone technology trends include advanced AI-powered personal assistants like Alexa and Siri, faster 5G-enabled media downloads, and screen-only devices reliant on Bluetooth.
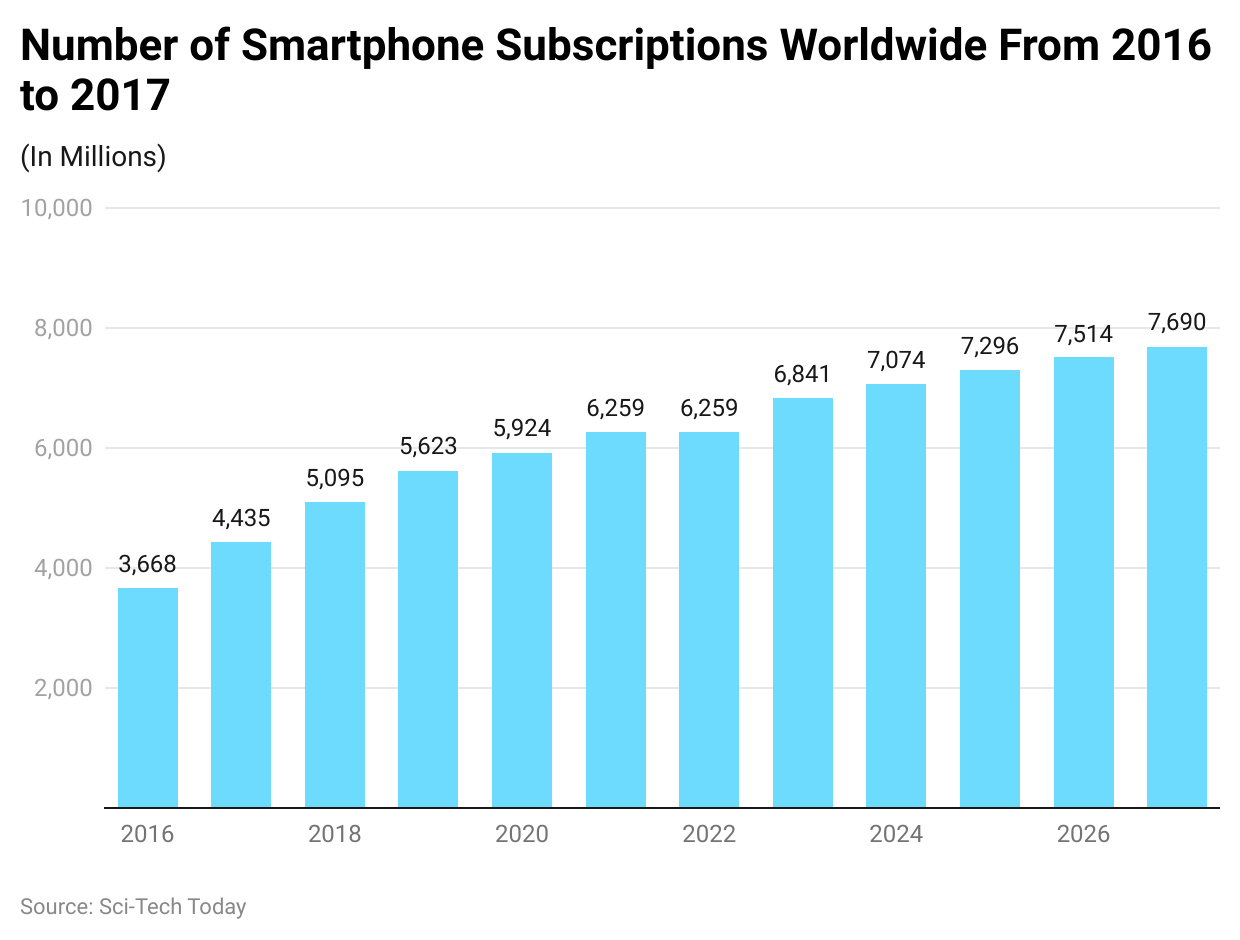
- With wireless charging and foldable phones already prevalent, the future holds seamless connectivity and streamlined user experiences for the estimated 7.7 billion global smartphone users by 2027.
General Smartphone Sales Statistics
- Samsung degraded Apple to become the top smartphone business worldwide, accounting for almost 20% of shipment share or even 59.4 million units.
- The Apple iPhone has consistently dominated the list of the top 10 best-selling smartphones worldwide, accounting for 50% of the models.
(Reference: Statista.com)
- In the above chart, we can see the number of smartphone subscriptions globally between 2016 and 2027 in millions.
- Surrounded by the top five OEMs, Xiaomi has grown faster, registering 34% year-on-year shipment growth. Xiaomi’s worldwide shipment total for Q1 was almost 41.6 million.
- Worldwide smartphone value also increased by 7% year on year and reached the highest level in the first quarter.
- Samsung had decreased by almost 9% year on year to share with Apple in the expert segment, to Chinese OEMs like Xiaomi in the mid-tier section, and to choose brands at the beginner level.
- Apple’s shipment decreased by 13% year over year, even though the brand’s ASP grew to a first-quarter high, driven by the advanced models’ developed performance. Globally, the iPhone shipment came in at 50.5 million.
- The worldwide smartphone industry grew by almost 6% year over year to reach almost 296.9 million unit shipments in 2024.
As of 2024, the smartphone seller industry share ranking:
| Samsung | 20% |
| Apple | 17% |
| Xiaomi | 14% |
| OPPO | 8% |
| Vivo | 7% |
- In terms of the area’s performance, the Middle East and Africa (MEA) revealed high yearly shipment growth, whereas Europe witnessed the highest decline.
- The HONOR witnessed a healthy two-digit growth of almost 27% year on year, while Huawei has grown by three digits, which is just one of the top 10 smartphones to do likewise.
- Of the top 5 smartphone brands, Xiaomi grew by 23% year over year to around 40.7 million units in 2023.
- In 2023, Apple grew by 2% year over year, surpassing Samsung to take the top spot.
- Samsung has clung to the spot as the globe’s top smartphone player yearly, shipping the largest number of smartphones in 2023.
- The worldwide smartphone industry grew by almost 7% year on year to reach almost 323.2 million units in 2023.
Global Smartphone Shipment Statistics
- Related to regional performance, the Middle East and Africa (MEA) showed high yearly shipment growth, whereas North America witnessed the highest decrease.
- Of the top 10 smartphone brands, Motorola, Tecno, Huawei, and HONOR have witnessed double-digit yearly growth. Infinix and Itel, the different transition brands with Tecno, even witnessed double-digit yearly growth.
- Of the top five smartphone brands, Xiaomi was the only one to increase year over year, shipping almost 41.5 million smartphones in 2023.
- In 2023, Samsung’s revenue decreased by 8% year over year despite growing by 11% quarter over quarter and retaining its position as the top smartphone player.
- The worldwide smartphone industry decreased by 1% year to year to reach 299.8 million units in 2023.
| Brands | Q2 2022 | Q3 2022 | Q4 2022 | Q1 2023 | Q2 2023 | Q3 2023 | Q4 2023 | Q1 2024 |
| Samsung | 62.5 | 64.3 | 58.3 | 60.6 | 53.5 | 59.4 | 53 | 60 |
| Apple | 46.5 | 49.2 | 72.27 | 58 | 45.3 | 48.9 | 74 | 50.6 |
| Xiaomi | 39.5 | 40.5 | 33.2 | 30.5 | 33.2 | 41.51 | 40.7 | 40.8 |
| OPPO | 28.24 | 29.54 | 30.1 | 28.44 | 27.95 | 28.1 | 23.99 | 25.1 |
| Vivo | 25.47 | 26 | 23.4 | 20.83 | 21.39 | 22.1 | 23.7 | 21.6 |
| Others | 92.29 | 92.36 | 85.37 | 81.83 | 86.66 | 99.79 | 107.8 | 87.8 |
| Total | 294.5 | 301.9 | 302.6 | 280.2 | 268 | 299.8 | 323.2 | 296.9 |
(Source: Statista.com)
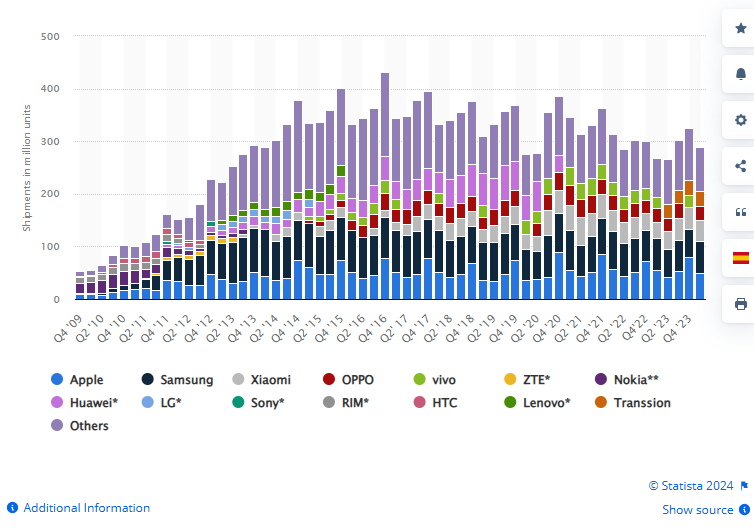
- In the first quarter of 2024, Samsung emerged as the top smartphone vendor globally, shipping about 60 million units and securing nearly 21 percent of the market share.
- Apple, in second place, shipped around 50 million units, down from 55 million in the same quarter the previous year. It holds over 17 percent of the market. Total smartphone shipments during this period approached 290 million units.
- By 2027, the shipment share is estimated to be $92 million in 4G ASP, $377 million in SP ASP, and $433 million in 5G ASP.
- According to the global smartphone shipment industry, revenue earned was $159 million 4G ASP, $584 million SP ASP, and $421 million 5G ASP until April 2023.
- The top shipment industry share of worldwide smartphones in the 1st quarter of 2023, with a 22% share of Samsung. At the same time, other brands are 21% Apple, 11% Xiaomi, 10% Oppo, 7% Vivo, and 29% others.
- In the second half of 2023, the brand’s share is 20% Samsung, 17% Apple, 12% Xiaomi, 10% Oppo, 8% Vivo, and 33% others.
U.S. Smartphone Market Share
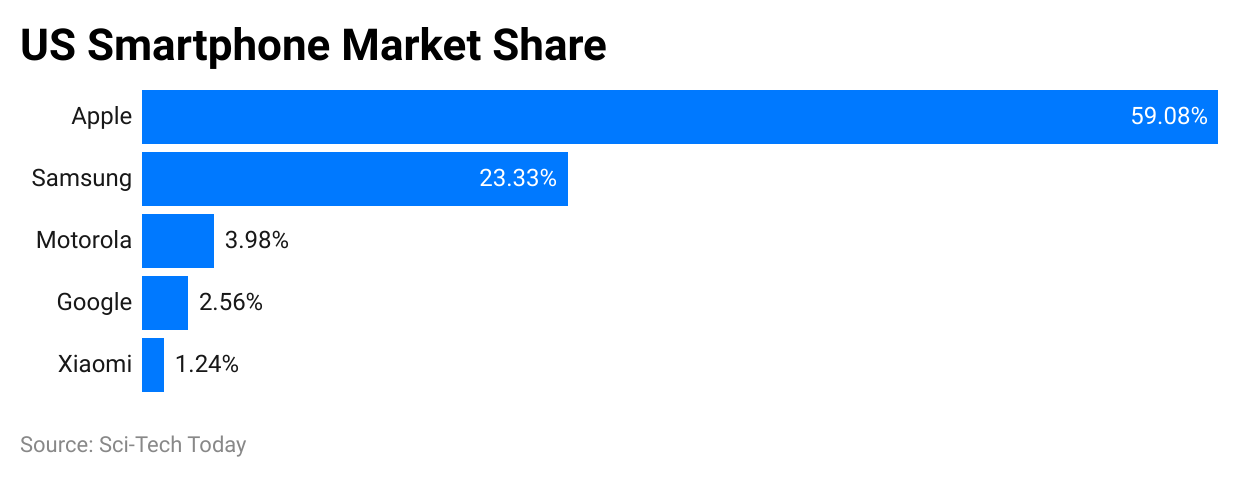
Understanding the smartphone market share is crucial for optimizing your business’s mobile presence. Here’s a breakdown of the current landscape and historical trends in the U.S. smartphone market, which can help inform your mobile strategy:
(Reference: Oberlo.com)
Market Share (March 2024)
- Apple: 59.08%
- Samsung: 23.33%
- Motorola: 3.98%
- Google: 2.56%
- Xiaomi: 1.24%
- Apple and Samsung Lead: Combined, Apple and Samsung control 82.41% of the U.S. smartphone market. This means over eight out of ten smartphones used in the U.S. are from these two brands.
- Apple’s Dominance: Apple holds the largest share, with 59.08%. More than half of all smartphones sold in the U.S. are iPhones.
- Samsung’s Position: Samsung is the second biggest player, with a 23.33% market share. Although significantly lower than Apple, Samsung is still a major competitor.
- Other Brands: Motorola, Google, and Xiaomi follow far behind, with market shares of 3.98%, 2.56%, and 1.24%, respectively. Combined, these three brands make up only 7.78% of the market.
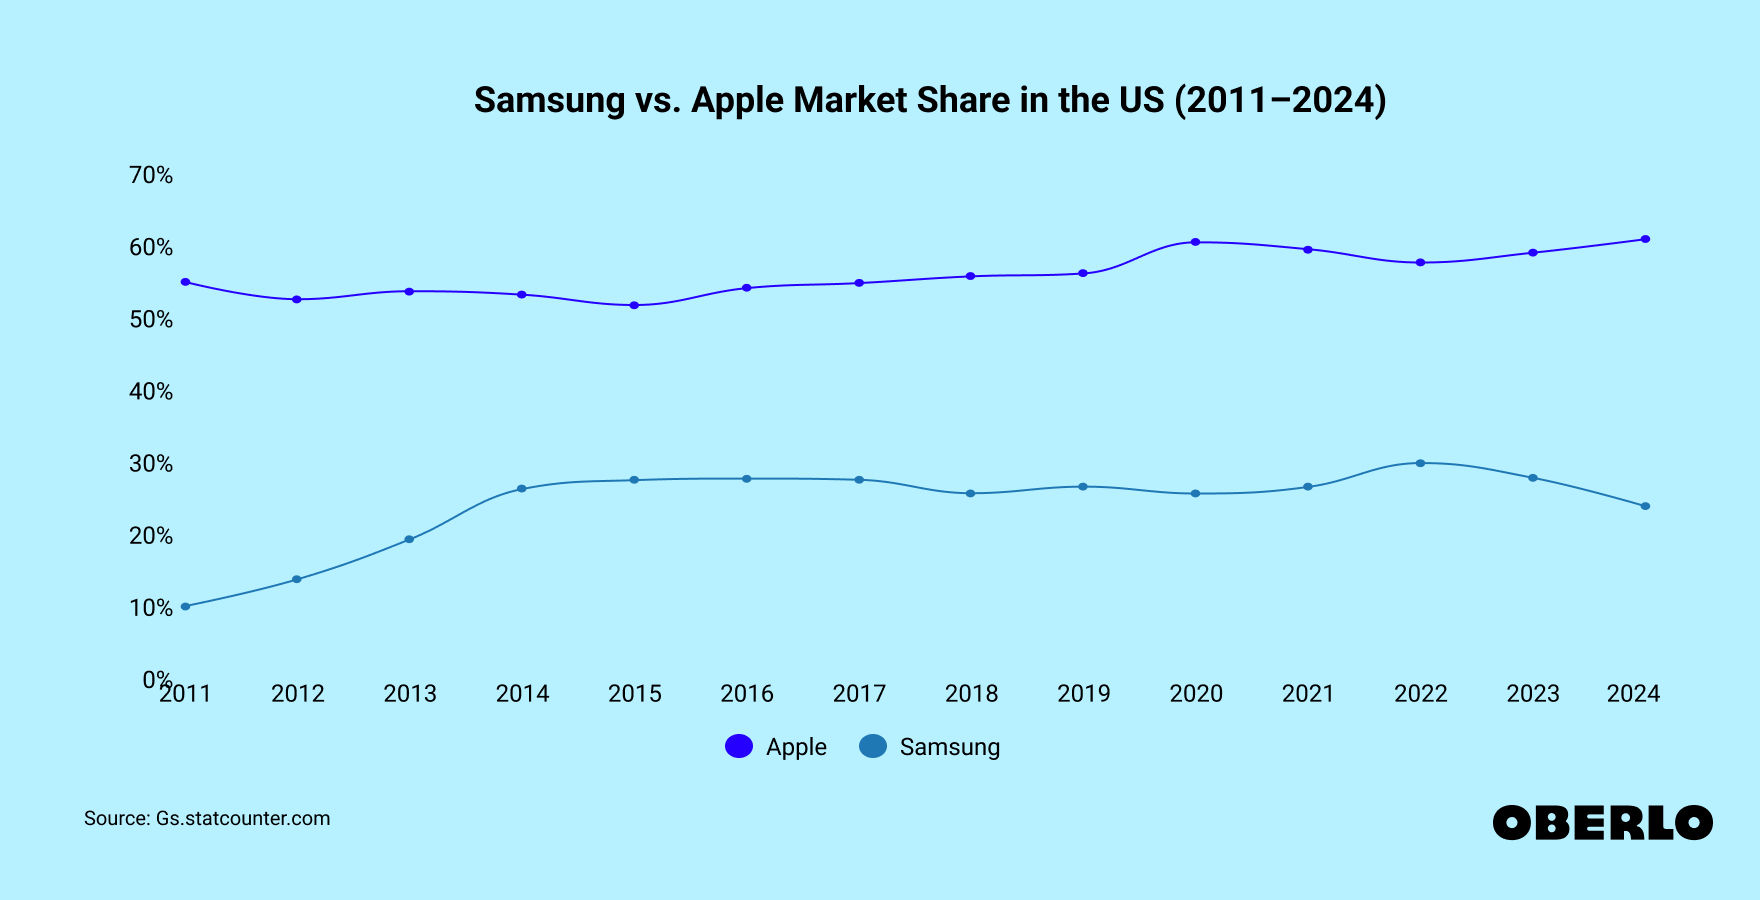
- Historical Trends: Apple vs. Samsung
(Source: Oberlo.com)
- Apple’s Steady Share: Apple has maintained a relatively stable market share over the years, fluctuating between 50.85% and 59.97% since 2011.
- Samsung’s Growth: Samsung saw significant growth during the same period. In 2011, Samsung’s market share was 9.12%. By 2014, it had more than doubled to 25.34%, showing steady gains.
- Narrowing Gap: While Apple’s market share has remained stable, Samsung has gradually closed the gap. In 2011, Apple’s lead over Samsung was 44.82 percentage points (Apple at 54.04% vs. Samsung at 9.12%). Today, that lead is narrower, with Apple at 59.08% and Samsung at 23.33%.
Why This Matters for Your Business
- Mobile-Friendly Design: Apple and Samsung devices dominate the U.S. market, so ensure your website is optimized for iOS and Android systems.
- Focus on iOS: With Apple holding the largest market share, prioritize the user experience on iPhones.
- Consider Android too: Despite Apple’s lead, Samsung’s significant share means you must recognize Android users. Ensure compatibility and smooth functionality across both platforms.
- Stay Updated: The smartphone market can shift. Monitor these trends to adapt your mobile strategy accordingly.
Mobile Commerce and Advertising
- Mobile Ad Spend: Mobile advertising in the U.S. is expected to hit $216.4 billion this year. Investing in mobile-friendly advertising is crucial, considering the high usage of smartphones for browsing and shopping.
- E-commerce Optimization: Optimize your online store for mobile users. The majority of smartphones are Apple and Samsung, so ensure your website performs well on both types of devices.
Smartphone Usage Statistics
- Smartphones account for almost 70% of the United States’ digital media time, entertainment consumption, and dominate games and social media.
- According to Smartphone statistics, around 17% of people in the United States still use a feature mobile phone, and it is very common among the lower-income and elderly population.
- In 2021, the population spent almost 90% of their mobile time downloading applications on smartphones.
- In 2022, nearly 59% of web traffic was a result of smartphone devices.
- There are almost 6.92 billion smartphone users worldwide, which accounts for almost 86% of the world’s population.
- According to the survey done by Think with Google, around 68% of smartphone users check their phones within 15 to 20 minutes of waking up.
- In the median, the citizens of the United States check their smartphones almost 96 times a day, almost once every 10 minutes.
- The people of the U.S. spend almost 5 hours and 24 minutes using their smartphone devices every day.
- In 2023, around 81.6% of U.S. citizens, or 270 million people, will own smartphones.
(Reference: Statista.com)
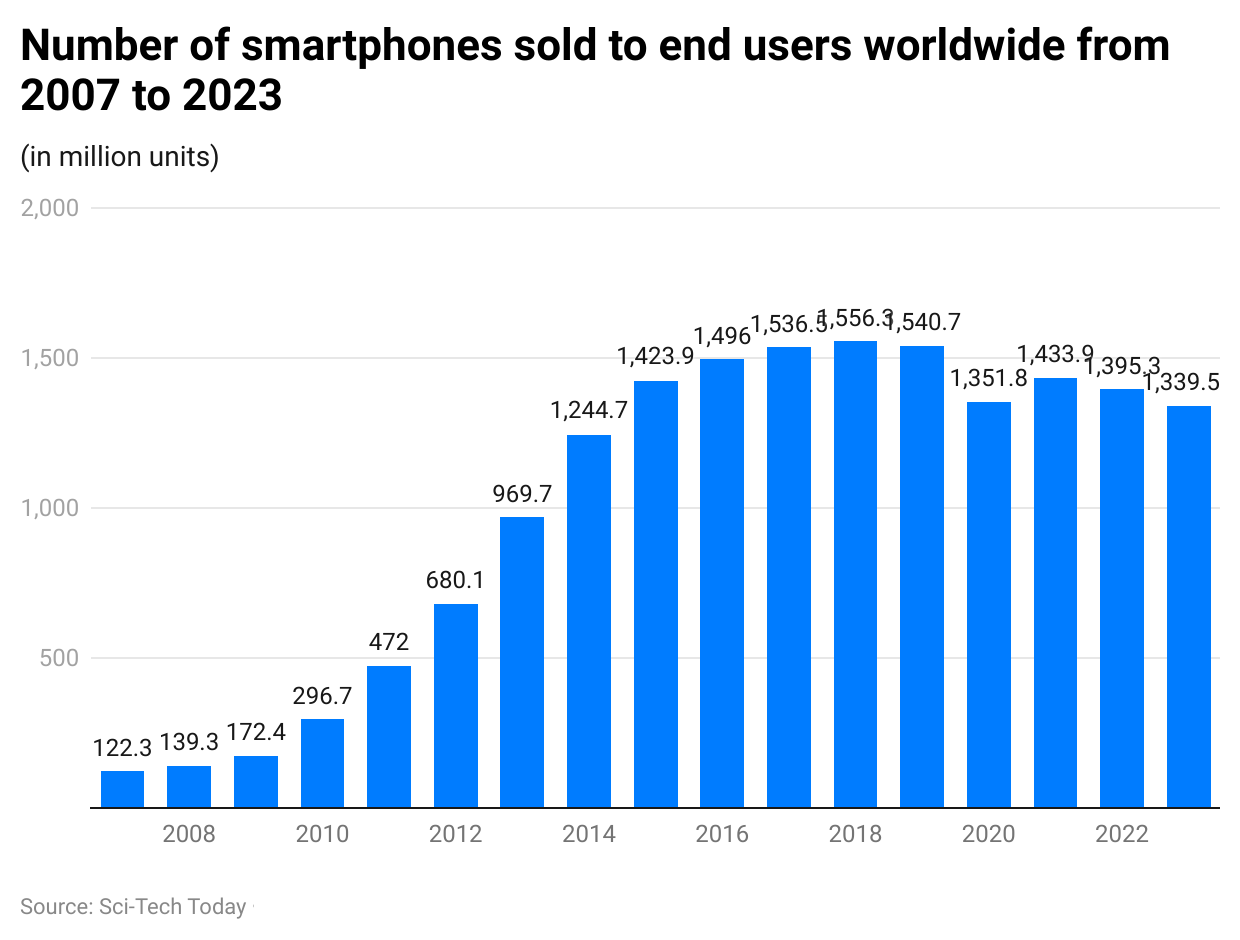
- The global smartphone market has seen notable changes from 2007 to 2023, reflecting both the rapid adoption of smartphones and various external factors affecting sales.
- In 2022, approximately 1.39 billion smartphones were sold worldwide.
- This figure is expected to decrease slightly to 1.34 billion in 2023.
- In 2016, less than half of the global population owned a smartphone.
- By 2020, the penetration rate had climbed to 78.05 percent.
- Projections suggest that by 2025, nearly 87 percent of mobile users in the United States will own a smartphone, up from 27 percent in 2010.
- In 2021, U.S. smartphone sales were valued at approximately 73 billion dollars, a significant increase from 18 billion dollars in 2010.
- Following the initial impact of the COVID-19 pandemic, global smartphone sales were anticipated to grow from 2020 to 2021 across all major regions.
- These points illustrate the evolving nature of the smartphone market, influenced by technological advancements, market saturation, and external economic factors.
- The continuous rise in smartphone penetration, particularly in developed markets like the United States, underscores smartphones’ essential role in modern life and their ongoing growth potential.
Smartphone Ownership Demographics
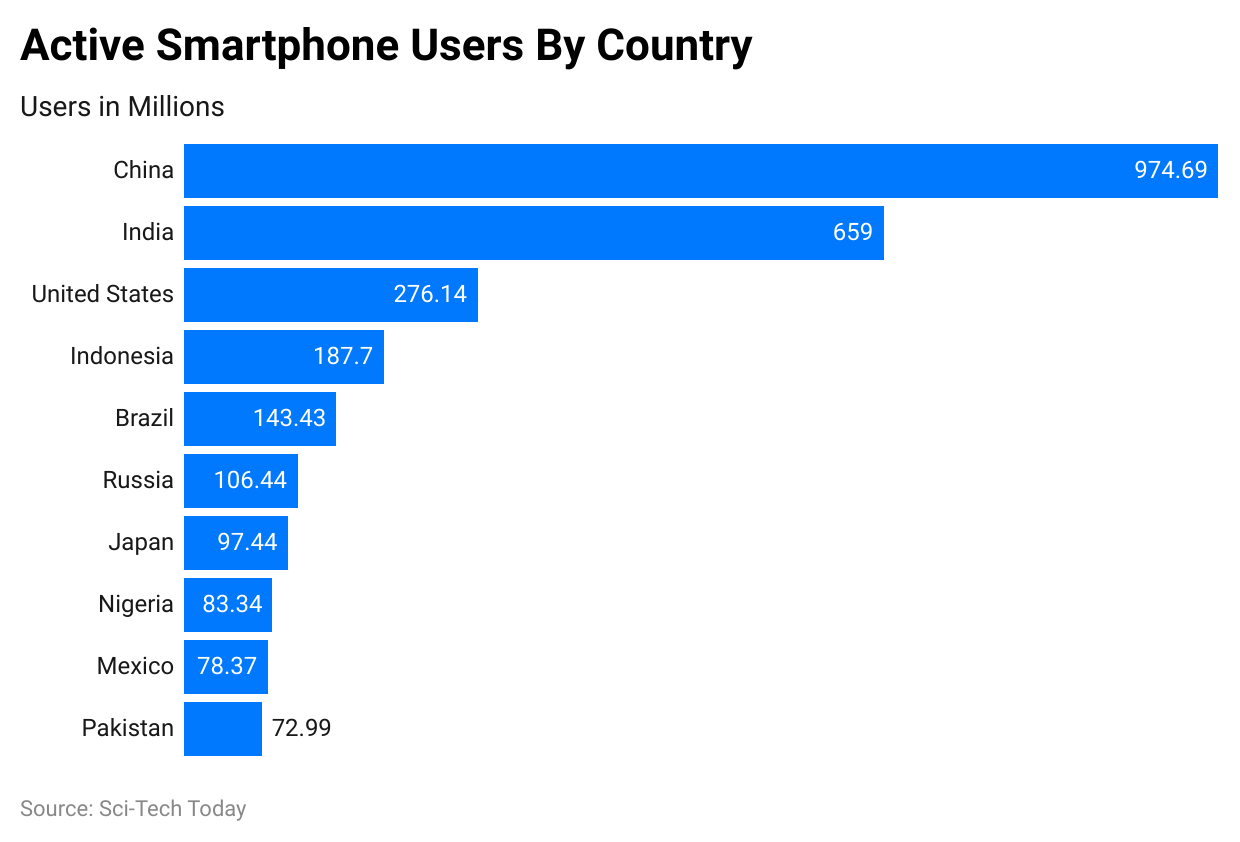
- The top 10 nations by smartphone users have grown to almost 70 million active users.
- China has a very important smartphone users globally, almost 1.5 times more than any other nation.
(explodingtopics.com)
- Among the lost nations, the United States has the largest portion of its population actively using smartphones.
- Here is the breakdown of smartphone users by Nation:
| Rank | Country | Smartphone users | Total population | Smartphone penetration |
| 1 | Pakistan | 72.99 million | 235.82 million | 31% |
| 2 | Mexico | 78.37 million | 127.5 million | 61.5% |
| 3 | Nigeria | 83.34 million | 218.54 million | 38.1% |
| 4 | Japan | 97.44 million | 123.95 million | 78.6% |
| 5 | Russia | 106.44 million | 144.71 million | 73.6% |
| 6 | Brazil | 143.43 million | 215.31 million | 66.6% |
| 7 | Indonesia | 187.7 million | 275.5 million | 68.1% |
| 8 | United States | 276.14 million | 338.29 million | 81.6% |
| 9 | India | 659 million | 1.42 billion | 46.5% |
| 10 | China | 974.69 million | 1.43 billion | 68.4% |
- According to the statistics, many people don’t or cannot have access to a smartphone; that is because 1.1 billion people don’t have access to electricity.
- According to United States Statistics, 19 out of 20 people have some form of mobile phone.
- According to a Pew Research data survey, the median smartphone users in the United States is almost 80% males, in contrast to 75% of women.
- Around 3% of the variety is in favor of women when it comes to owning a non-smartphone mobile phone.
- The 18—to 29-year-old population is the youngest adult group with the highest proportion of smartphone users, at 94%.
- The next highest ratio of smartphone users is between 30 and 49 years old, which means 89%. This is followed by the 50 to 60 years old at almost 73%, and the 65 and older age group at 46%.
- It won’t be a surprise that a large portion of the United States citizens living in urban areas make use of a smartphone, 83%, in contrast to 78% of urban residents and 65% of rural citizens.
- The survey data shows that the minority made very significant differences related to smartphone users. Almost 77% of white, 77% of Hispanic, and 75% of black people own a smartphone.
- 98% of black United Citizens own some form of mobile phone, compared to 97% of Hispanic people and 94% of white people.
- People who have a level of education have a positive relationship with smartphones. The following are the details:
| Education Level | Cell Phone Ownership | Smartphone Only Ownership | Non-smartphone-only ownership |
| College Graduate | 97% | 91% | 6% |
| Some College | 96% | 80% | 16% |
| High school graduate | 92% | 69% | 24% |
| Less than high school | 90% | 57% | 33% |
- There was even a positive relationship between yearly salary and smartphone ownership.
- According to Pew Research, almost 67% of the population earning under $30,000 per year owns a smartphone.
- There has been a minute growth in the number of United States citizens who earn between $30,000 and $49,999, with a smart almost 82% and people who earn between $50,000 and $74,999.
- As per Newzoo and Quartz, people from the United States earn almost $75,000 per year and generally own a smartphone, which is equal to 93%.
Smartphone Market Share Statistics
- In the past years, Samsung has claimed around one-third of the smartphone market, the biggest share that year.
- Other than Apple, no other brand has claimed more than 4% of the market.
- Till 2020, five brands have claimed a market share of around 8%.
| Year | Samsung | Apple | Huawei | Xiaomi | OPPO | Vivo | Lenovo |
| 2012 | 30.3% | 18.7% | 4% | – | – | – | 3.3% |
| 2013 | 31.3% | 15.3% | 4.9% | – | – | – | 4.5% |
| 2014 | 24.4% | 14.8% | 5.7% | 4.4% | – | – | 4.6% |
| 2015 | 22.3% | 16.1% | 7.4% | 4.9% | 3% | 2.6% | 5.2% |
| 2016 | 21.1% | 14.6% | 9.5% | 3.6% | 6.8% | 5.3% | – |
| 2017 | 21.7% | 14.7% | 10.5% | 6.3% | 7.6% | – | – |
| 2018 | 20.8% | 14.9% | 14.7% | 8.7% | 8.1% | – | – |
| 2019 | 21.6% | 13.9% | 17.6% | 9.2% | 8.3% | – | – |
| 2020 | 20.6% | 15.9% | 14.6% | 11.4% | – | 8.6% | – |
| Q2 2021 | 18.9% | 14.2% | – | 16.9% | 10.5% | 10.1% | – |
| Q2 2022 | 21.8% | 15.6% | – | 13.8% | 8.6% | 8.7% | – |
The two main mobile operating systems that are used in smartphones are iOS and Android as of 2023:
| Name | O.S. market share |
| Android | 70.16% |
| iOS | 29.14% |
| Samsung | 0.38% |
| KaiOS | 0.12% |
| Windows | 0.02% |
| Nokia Unknown | 0.01% |
| Linux | 0.01% |
Smartphone Market Share in India
Xiaomi leads the Indian smartphone market with a 20.70% annual share, followed by Vivo at 18.23% and Samsung at 13.69%. This article provides detailed insights into smartphone shipments in India, covering both mid-range and premium segments. Discover the number of units sold each year, month, and quarter.
Most Popular Smartphone Brands in India (2024):
| Brands | Market share |
| Xiaomi | 20.67% |
| Vivo | 18.22% |
| Samsung | 13.69% |
| Realme | 13.45% |
| OPPO | 11.71% |
| OnePlus | 4.82% |
| Apple | 4.10% |
| Others | 13.30% |
- General market share percentage: Xiaomi had a high market share in India in the most recent quarter, with almost 20.67%. Vivo recently overtook Samsung, and it ranks in second place with almost 18.22% brand share. Samsung is ranked third with a 13.69% brand share. OPPO, Realme, OnePlus, and Apple, the top seven smartphone brands in India, have a market share of 13.45%, 11.71%, 4.82%, and 4.10%, respectively.
- Apple by market share percentage: Apple presently ranks 7th in India by brand share, with a market share of 4.10%, a 0.16$\% growth related to the industry share for the brand as related to the 4th quarter of 2023.
- OPPO by market share percentage: Oppo ranks 5th in the brand share in India, with a quarter market share of 11.71%. This is a 0.15% decrease compared to the 4th quarter of 2023.
- Huawei by market share percentage: Huawei’s market share in 2023 in India was around 0.41%. Compared to 2023, it has fallen by 0.04%. This brand is ranked 11th in the market.
- Samsung by market share percentage: Samsung’s market share in 2024 in India was 13.69%, down 0.11% from 2023. Samsung ranks third in the country in terms of market share.
- Vivo by market share percentage: Vivo’s quarterly market share in 2024 ranks second in India at 18.22%, a growth of 0.25% compared to the 4th quarter of 2023. Vivo has witnessed an upward trend in its most recent quarter.
- Xiaomi by market share percentage: Xiaomi had a 1/4th share of the market at 20.6% in 2024, a 19% decrease from 2023. Xiaomi has the highest share of the market in the smartphone vendor industry in India.
(2024-2028 are the predicted volumes)
(Reference:sellcell.com)
| YEAR | SOLD PER YEAR (Millions of units) |
SOLD PER MONTH (Millions of units) |
SOLD PER DAY (Millions of units) |
| 2028* | 1855.7 | 154.64 | 5.08 |
| 2027* | 1863.6 | 155.30 | 5.11 |
| 2026* | 1850 | 154.17 | 5.07 |
| 2025* | 1847.5 | 153.96 | 5.06 |
| 2024* | 1844.8 | 153.73 | 5.05 |
| 2023 | 1822.3 | 151.86 | 4.99 |
| 2022 | 1749.7 | 145.81 | 4.79 |
| 2021 | 1747.8 | 145.65 | 4.79 |
| 2020 | 1649.1 | 137.43 | 4.52 |
| 2019 | 1816.8 | 151.40 | 4.98 |
| 2018 | 1820.4 | 151.70 | 4.99 |
| 2017 | 1803.4 | 150.28 | 4.94 |
| 2016 | 1813.9 | 151.16 | 4.97 |
| 2015 | 1763.5 | 146.96 | 4.83 |
| 2014 | 1854.5 | 154.54 | 5.08 |
| 2013 | 1816.4 | 151.37 | 4.98 |
| 2012 | 1790.24 | 149.19 | 4.90 |
| 2011 | 1774.85 | 147.90 | 4.86 |
| 2010 | 1593.47 | 132.79 | 4.37 |
| 2009 | 1166.46 | 97.21 | 3.20 |
- Between 2009 and 2023, the daily average of mobile phone sales was 4.75 million units. In 2023, this figure rose to 4.99 million units per day. The peak daily average occurred in 2014, with 5.08 million units sold daily. Projections indicate that by 2027, the daily average will increase to 5.11 million units.
Production of Cell Phones in China
The data source connected Jan and Feb
(Reference:sellcell.com)
| MONTH | MADE PER MONTH (Millions of units) |
MADE PER DAY (Millions of units) |
| Nov 2022 | 141.70 | 4.72 |
| Oct 2022 | 154.14 | 4.97 |
| Sep 2022 | 155.84 | 5.19 |
| Aug 2022 | 127.72 | 4.12 |
| Jul 2022 | 120.50 | 3.89 |
| Jun 2022 | 136.12 | 4.54 |
| May 2022 | 126.67 | 4.09 |
| Apr 2022 | 126.93 | 4.23 |
| Mar 2022 | 143.84 | 4.64 |
| *Jan/Feb 2022 | 212.71 | 3.61 |
| Dec 2021 | 174.61 | 5.63 |
| Nov 2021 | 160.23 | 5.34 |
| Sep 2021 | 151.65 | 5.06 |
| Aug 2021 | 133.16 | 4.30 |
| Jul 2021 | 126.92 | 4.09 |
| Jun 2021 | 143.22 | 4.77 |
| May 2021 | 132.35 | 4.27 |
| Apr 2021 | 127.54 | 4.25 |
| Mar 2021 | 137.23 | 4.43 |
| *Jan/Feb 2021 | 208.59 | 3.54 |
| Dec 2020 | 164.96 | 5.32 |
| Nov 2020 | 149.66 | 4.99 |
| Oct 2020 | 131.01 | 4.23 |
| Sep 2020 | 148.77 | 4.96 |
| Aug 2020 | 131.20 | 4.23 |
| Jul 2020 | 122.26 | 3.94 |
| Jun 2020 | 129.90 | 4.33 |
| May 2020 | 110.82 | 3.57 |
| Apr 2020 | 108.64 | 3.62 |
| Mar 2020 | 118.04 | 3.81 |
| *Jan/Feb 2020 | 138.77 | 2.35 |
| Dec 2019 | 175.29 | 5.65 |
| Nov 2019 | 180.91 | 6.03 |
| Oct 2019 | 160.96 | 5.19 |
| Aug 2019 | 145.23 | 4.68 |
| Jul 2019 | 140.41 | 4.53 |
| Jun 2019 | 151.26 | 5.04 |
| May 2019 | 146.03 | 4.71 |
- On average, China manufactures 4.53 million cell phones per day.
- The peak production was in November 2019, with 6.03 million units produced daily.
- The lowest production occurred in January/February 2020, with 2.35 million daily units, likely influenced by the Chinese New Year and the COVID-19 pandemic.
- Excluding this period, the lowest production rate was in May 2020, at 3.57 million units per day.
Annual Smartphone Sales by Manufacturer
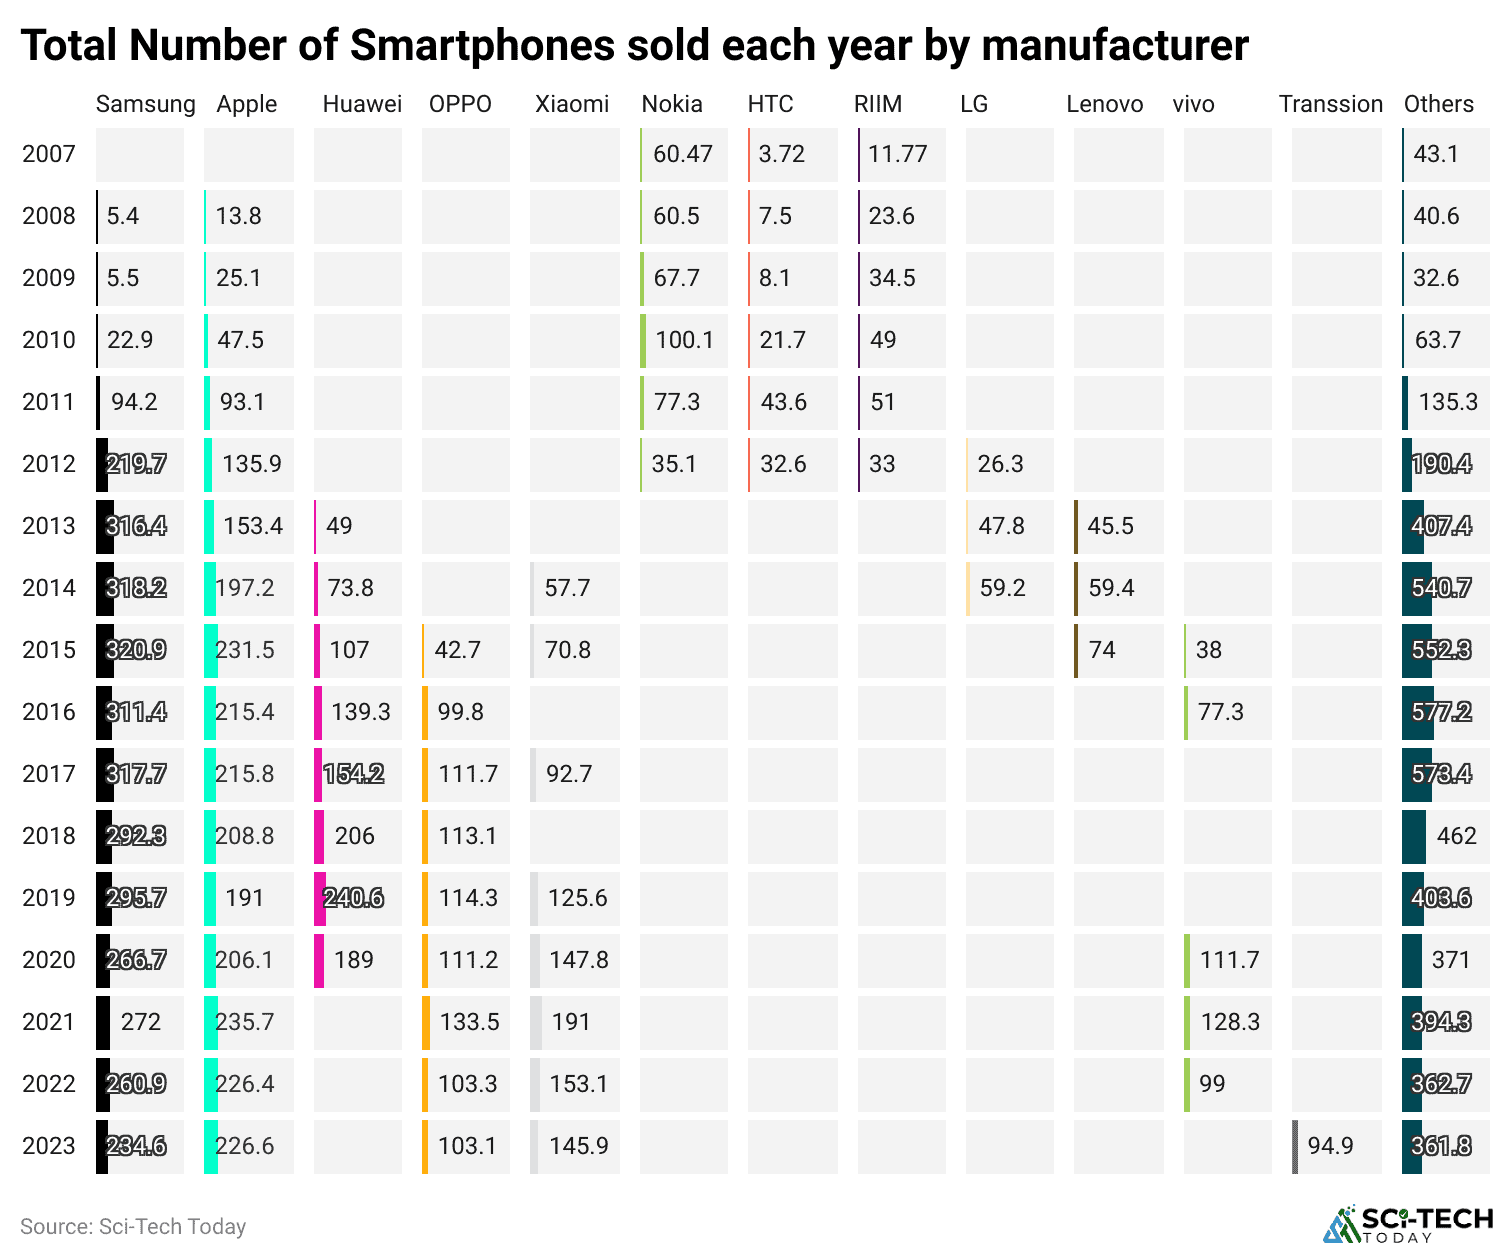
2023 is related to preliminary results and subject to change.
(Reference:sellcell.com)
| Manufacturer | Shipment ( Millions of units) |
| Transsion | 94.9 |
| OPPO | 103.1 |
| Xiaomi | 145.9 |
| Samsung | 226.6 |
| Apple | 234.6 |
| Others | 36 |
- The data from Statista and IDC highlights a significant shift in the smartphone market dynamics in 2023. Here are some key points and insights based on the information provided:
Apple’s Milestone in 2023:
- Units Sold: Apple sold 234.6 million iPhones.
- Significance: This marks the first time in over a decade that Apple has outsold Samsung in annual smartphone sales.
Samsung’s Performance:
- Units Sold: Samsung sold 226.6 million smartphones.
- Position: Samsung was the second-highest seller in 2023, closely following Apple.
Xiaomi’s Position:
- Units Sold: Xiaomi sold 45.9 million handsets.
- Ranking: Xiaomi is in third place, making it a strong contender in the smartphone market.
Historical Context:
- In 2007, RIM (BlackBerry) and Nokia were the dominant players.
- The introduction of smartphones marked the decline of Nokia and BlackBerry in 2008.
- Apple’s Growth: Apple’s sales surged from 3.3 million in 2007 to 93.1 million in 2011, an increase of almost 30 times.
- Samsung’s Historical Dominance—Samsung had been the leading smartphone seller for over a decade until Apple narrowed its lead in 2023.
- Apple’s Strategic Moves: Apple’s ability to outsell Samsung in 2023 could be attributed to strategic product launches, innovations, and perhaps stronger consumer loyalty or market expansion.
- Competitive Landscape: Despite Apple’s success, Samsung remains a formidable competitor with very close sales figures, indicating a highly competitive market.
- Emerging Contenders: Xiaomi’s strong sales highlight its potential to challenge the top two brands, especially in markets with a strong presence.
- Market Evolution: The shift from RIM and Nokia to Apple and Samsung underscores the rapid evolution of the smartphone market and the importance of innovation and adaptability.
- Future Projections: The close sales figures between Apple and Samsung suggest that future market leadership fluctuates depending on technological advancements, market strategies, and consumer preferences.
Total Number of Mobile Phones Sold Every Year by Nation
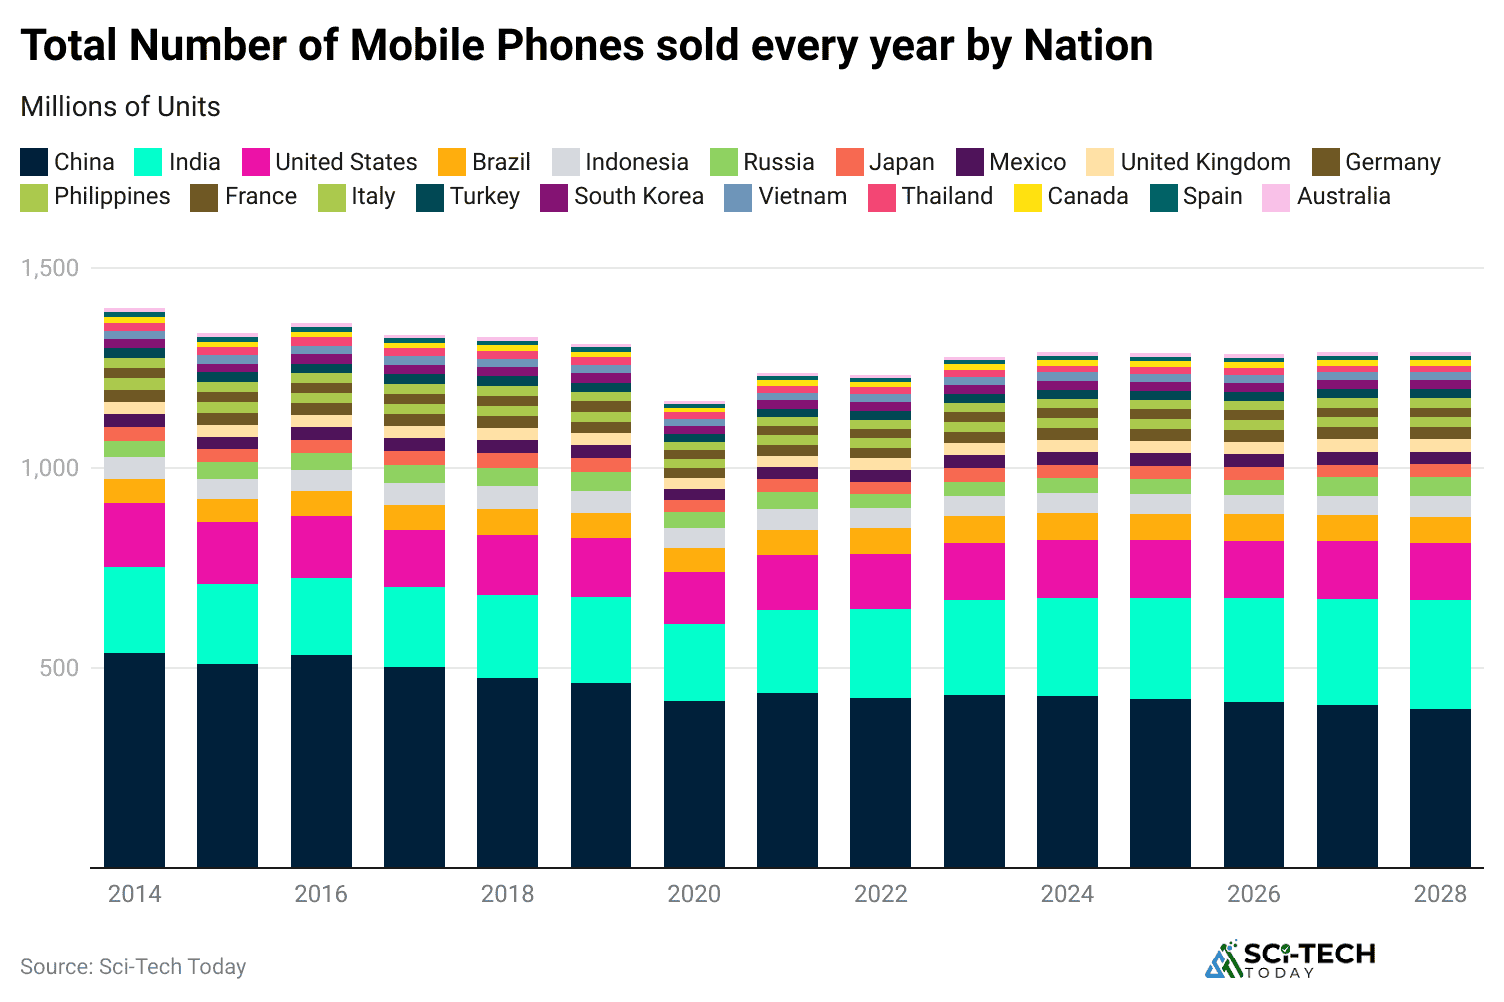
2024 – 2028 are estimated volumes
(Reference:sellcell.com)
For the forecasted year 2028.
| Country | Sales in millions of units |
| Vietnam | 23.0 |
| United States | 143.3 |
| United Kingdom | 31.2 |
| Turkey | 30.6 |
| Thailand | 15.4 |
| Spain | 11.1 |
| South Korea | 20.0 |
| Russia | 52.5 |
| Philippines | 24.7 |
| Mexico | 31.9 |
| Japan | 31.3 |
| Italy | 21.7 |
| Indonesia | 66.1 |
| India | 272.1 |
| Germany | 24.1 |
| France | 23.7 |
| China | 397.5 |
| Canada | 14.4 |
| Brazil | 46.4 |
| Australia | 8.9 |
- The sales data for 2023 underscores the dominance of the Chinese market in the global smartphone industry, with staggering figures compared to other territories. Here’s a breakdown of the key points:
China:
- Sales Volume: 433.7 million mobile phones sold.
- Significance: China emerges as the largest market for smartphone sales in 2023, reflecting its massive consumer base and growing tech-savvy population.
India:
- Sales Volume: 236.3 million mobile phones sold.
- Position: India follows China, indicating its significant presence in the global smartphone market.
United States:
- Sales Volume: 143.6 million mobile phones sold.
- Ranking: The U.S. ranks third in smartphone sales, highlighting its importance but trailing behind China and India.
Historical Trends:
- China’s Consistent Growth: China’s sales figures have been consistently high over the years, indicating sustained growth and demand for smartphones in the country.
- UK Market Growth: Smartphone sales in the U.K. increased from 2022 to 2023, with 29.9 million phones sold compared to 28.6 million in the previous year. This suggests a growing market or potentially increased consumer demand or upgrade cycles.
- Global Market Dynamics: The data underscores the importance of emerging markets like China and India in driving global smartphone sales due to their large populations and increasing tech adoption.
- Regional Variances: The disparity in sales figures between regions highlights the diverse consumer preferences, economic factors, and market dynamics influencing smartphone adoption.
- Implications for Brands: Smartphone brands need to tailor their strategies to effectively target and penetrate key markets like China and India while also addressing specific needs and preferences in other regions such as the U.S. and the U.K.
Conclusion
The smartphone market continues to expand, with numerous brands competing for consumer attention. Given the wide array of options, choosing the right smartphone can be difficult. However, examining smartphone sales statistics can offer valuable insights into the popularity of different brands and the features they provide. It’s important to note that market positions can change rapidly.
A brand that is leading today might need to catch up tomorrow (as seen with Huawei), while another brand might emerge from obscurity to become a fast-growing contender, like Realme. Despite a downturn in the smartphone market at the beginning of 2022, the leading smartphone manufacturers will continue innovating and growing.

Sources