Introduction
Vizio Statistics: If you’ve ever wondered how Vizio transformed from a scrappy startup to going into millions of American living rooms. In this article, I’m breaking down Vizio Statistics and explaining how a budget TV maker became an ad‑tech contender.
From origin to revenue breakdown, platform engagement to Walmart’s acquisition, these stats don’t just give data; they tell Vizio’s full evolution, platform power, and where it could be headed next. Let’s get into it.
Editor’s Choice
- Founded in 2002 on just US$600K, by 2007, Vizio had already grabbed 1 in LCD TV volume in North America.
- In 2023, device revenue dropped 22% while Platform+ (ads & streaming) grew 25%, making up 36% of total revenue.
- SmartCast had 1M active users by Q3 2024 and streamed nearly 5.8B hours that quarter alone.
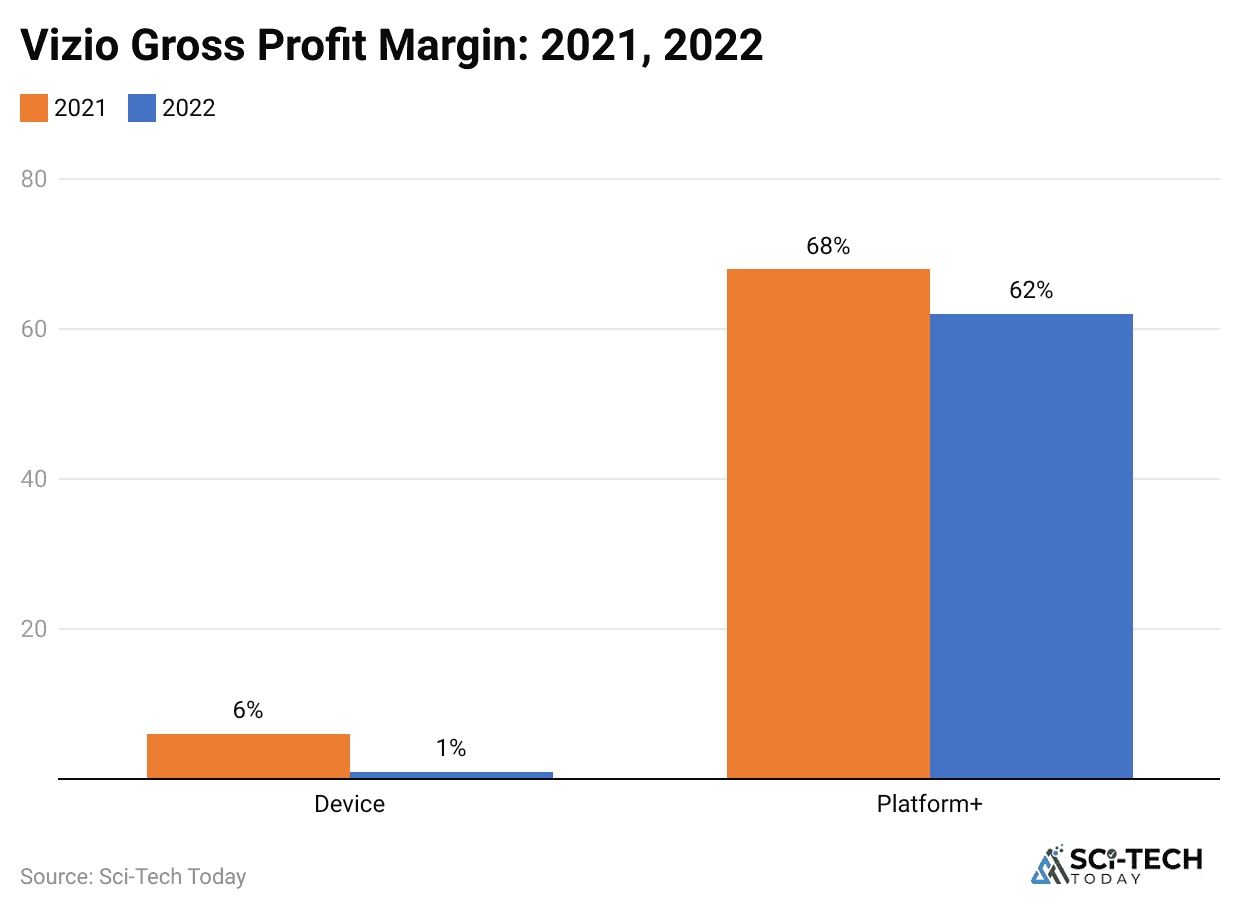
- Platform+ margins hover around 60 to 70%, while device margins are razor-thin or negative.
- SmartCast ARPU rose to US$37 by Q3 2024, a solid uptick in monetization.
- Walmart’s US$2.3B acquisition in December 2024 signals a full pivot toward retail-based ad monetization.
- Usage (hours streamed) and active accounts are now currency; hardware is secondary.
- Vizio still holds a 13 to 15% share of the U.S. smart TV market and 14% in soundbars.
- Affordability wins customers, but newer hardware reliability concerns may impact long-term engagement.
- Platform+ revenue likely to hit US$750M+ by 2025, with user numbers heading toward 20M and ARPU pushing past US$40.
| Topic | Key Metric / Value |
| Founded |
2002 with US$600K seed capital |
|
North America 1 by 2007 |
Flat‑panel HDTV volume |
| 2023 Device Revenue |
US$1.08 B (‑22%) |
|
2023 Platform+ Revenue |
US$598 M (+25%) |
| Platform+ Share of Total |
36% |
|
Q3 2024 SmartCast Users |
19.1 M active accounts, 5.8 B streaming hrs |
| Q3 2024 ARPU |
US$37 per user annually |
|
Platform+ Gross Margin |
60 to 70% |
| Walmart Acquisition |
US$2.3 B (completed Dec 2024) |
|
U.S. Smart TV Market Share |
13 to 15%; Soundbars 14% |
Origins and Founding of Vizio Statistics
- Vizio was launched in 2002 in California with a modest US$600,000 seed fund, aiming to shake up premium TV pricing.
- By 2007, it had become the No. 1 selling flat-panel HDTV brand in North America, thanks to its value-focused strategy.
- In 2009, Vizio fully exited plasma TV production, pivoting solely to affordable LED/LCDs.
- By 2015, it acquired Inscape (content-recognition tech) and used that data to expand into targeted advertising.
- Around IPO time in 2021, Vizio had already sold over 80 million TVs and rolled out its SmartCast platform widely.
- Its IPO in March 2021 brought a valuation near US$4 billion, solidifying its position as a growth electronics firm.
- Manufacturing is outsourced across Taiwan, China, Mexico, and Vietnam, enabling lean operations and flexible costing.
- Vizio saw a decline in reported hardware build quality post-2018, with earlier models still praised for reliability.
- In late 2024, Walmart acquired Vizio for around US$2.3 billion, shifting it from product-first to ad-first strategic alignment.
- Founder William Wang remains CEO, keeping continuity even as the platform plays a bigger role in the company’s strategy.
| Year/Event | Key Highlight |
| 2002 | Launched on US$600K seed capital |
| 2007 | Became the 1 HDTV brand in North America |
| 2009 | Pivoted exclusively to LED/LCD TVs |
| 2015 | Acquired Inscape for data and ad monetization |
| 2021 | IPO valued the company at $4B |
| Manufacturing | Outsourced to Asia & Mexico via ODMs |
| Post‑2018 | Hardware quality concerns vs. earlier models |
| Late‑2024 | Bought by Walmart for approx. $2.3B |
| Leadership | Founder/CEO William Wang remains in charge |
Revenue and Growth Breakdown in Vizio Statistics
 (Source: statista.com)
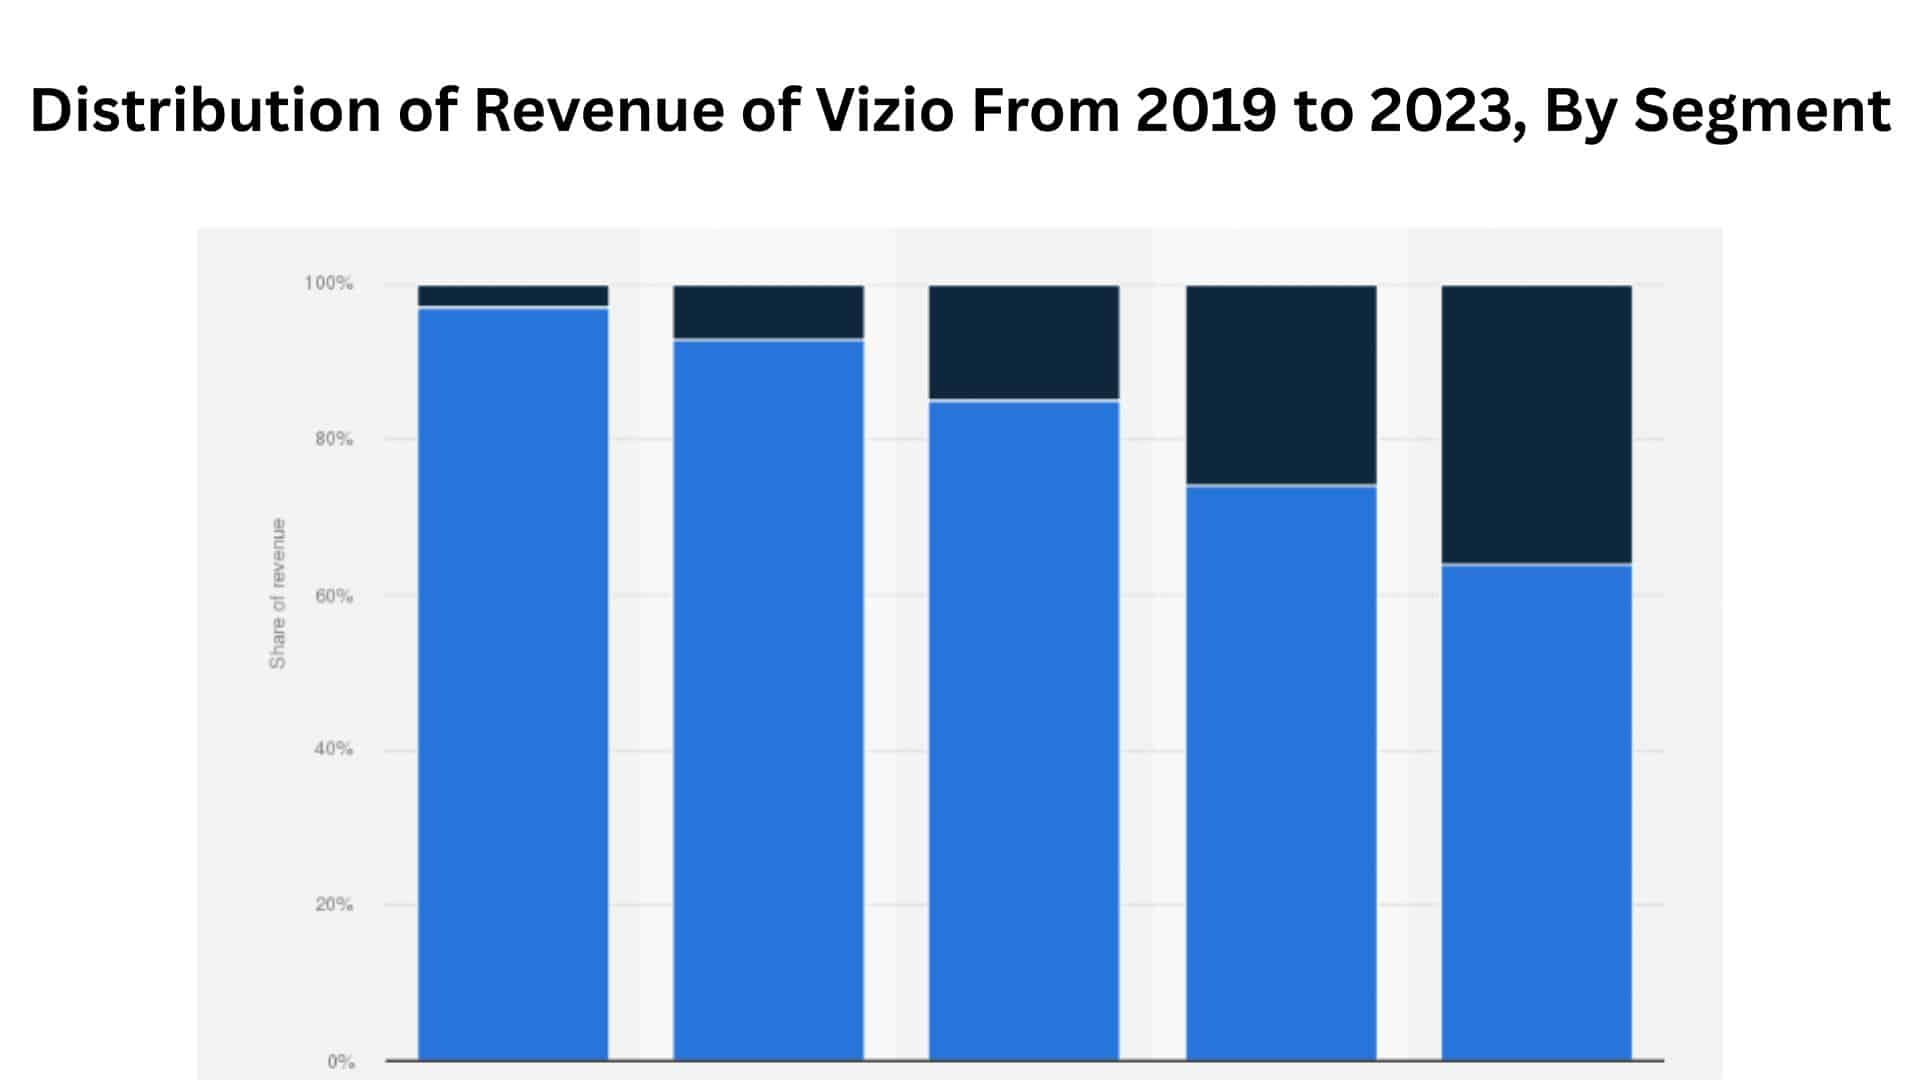
- In 2023, total net revenue stood at about US$1.68 billion, indicating a modest decline from the previous year’s $1.86 billion.
- Device revenue covering TVs and soundbars dipped approximately 22%, slipping to roughly US$1.08B.
- In contrast, Vizio’s Platform+ revenue (streaming & ads) grew around 25%, totaling nearly US$598 million in 2023.
- Platform+ revenue now represents roughly 36% of total income, up from under 30% in prior years.
- Device-driven sales showed a decline pressure from unit volume drop and unit price compression.
- Quarter‑by‑quarter in 2024: Q1 net revenue flat; device down 16%, Platform+ up 27%.
- In Q2 2024, net revenue rose 11% year-over-year: device up 6%, Platform+ up 19%.
- By Q3 2024, overall revenue was up 4%: device down 8% while Platform+ soared 26%.
- Device revenue decline reflects a shipment volume drop of 15% and 9% ASP.
- Platform+ growth is driven by rising ad deals and higher per-user monetization.
| Period | Device Rev | Platform+ Rev | Total Rev | Device Δ | Platform+ Δ |
| 20222023 | $1.08B (‑22%) | $598M (+25%) | $1.68B (‑10%) | ‑22% | +25% |
| Q1 2024 vs Q1 2023 | device ‑16% | +27% | flat (‑1%) | ‑16% | +27% |
| Q2 2024 vs Q2 2023 | +6% | +19% | +11% | +6% | +19% |
| Q3 2024 vs Q3 2023 | ‑8% | +26% | +4% | ‑8% | +26% |
Gross Profit and Margins in Vizio Statistics
 (Reference: nscreenmedia.com)
- In 2023, total gross profit rose to approximately US$356 million, a 14% increase over the prior year.
- Device gross profit turned slightly negative (to US$8.6M), reflecting razor‑thin or loss‑leading hardware margins.
- Platform+ gross profit, by contrast, came in near US$365 million, plumbing 65 to 70% margins.
- The shift means Platform+ delivers most profits now, even as device sales shrink.
- In Q2 2024, total gross profit rose 16%, with Platform+ contributing nearly all of it.
- The device segment posted minimal gross gain (US$0.9M) in Q2, showing severe margin constraints.
- Q3 2024 gross profit climbed 13%, Platform+ grossed nearly US$116M, while the device lost again.
- Device margins hover near zero or negative, while Platform+ margins consistently exceed 60%.
- This margin model enables Vizio to reinvest in content/data while manufacturing costs erode device profits.
- The gross margin dynamics validate the strategic push toward monetizing streaming hours, not hardware.
| Period | Device GP | Platform+ GP | Total GP | Device Margin | Platform+ Margin |
| 2023 | to $8.6M | $364.9M | $356.3M | 0% | 65 to 70% |
| Q2 2024 | +$0.9M | $98.6M | $99.5M | negligible | 60%+ |
| Q3 2024 | to $6.7M | $115.8M | $109.1M | negative | 65% |
SmartCast User Engagement Metrics
 (Reference: nscreenmedia.com)
- Active SmartCast accounts reached about 19.1 million by Q3 2024, up 7% year‑over‑year.
- Total streaming hours via SmartCast in 2023 topped 20.5 billion hours, an 18% jump over 2022.
- In Q3 2024 alone, users streamed 5.8 billion hours, nearly matching full-year numbers of early years.
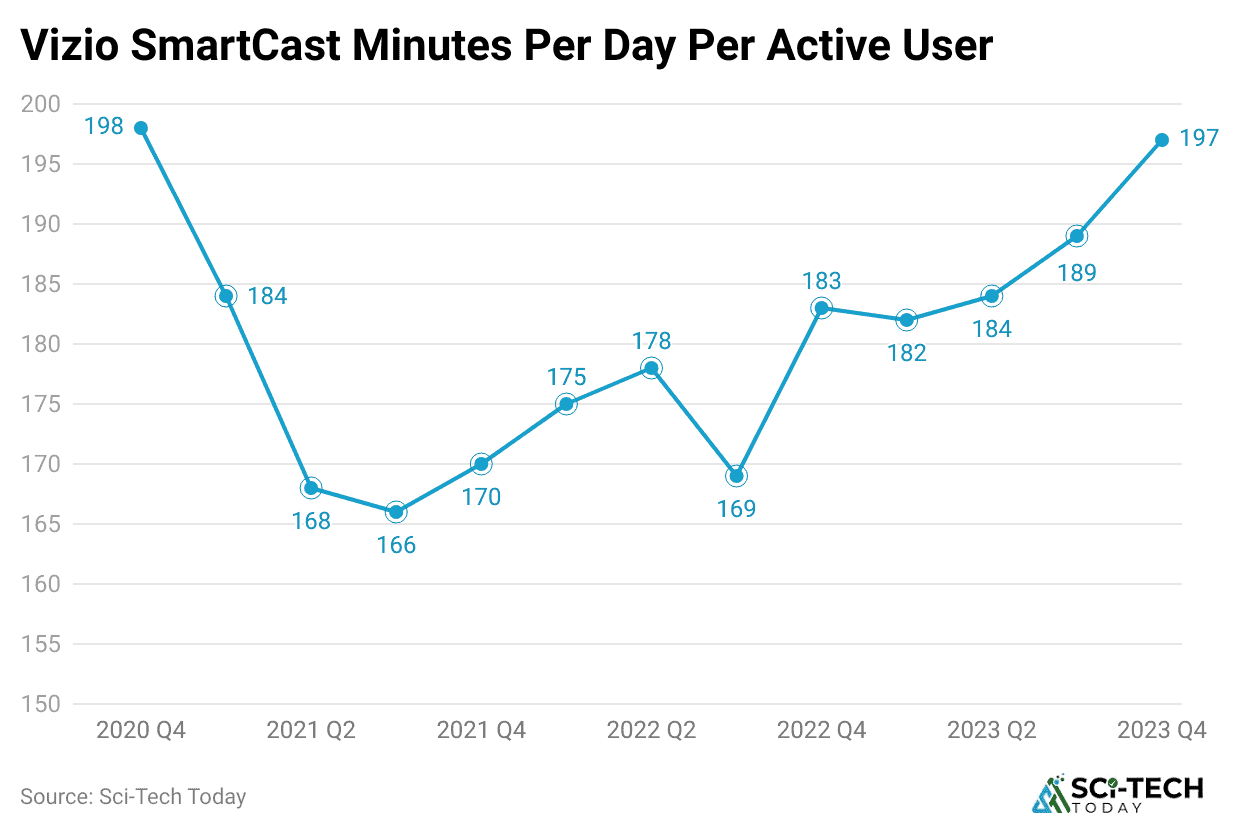
- Average usage per account per month hit 101 hours in Q3, indicating high engagement and stickiness.
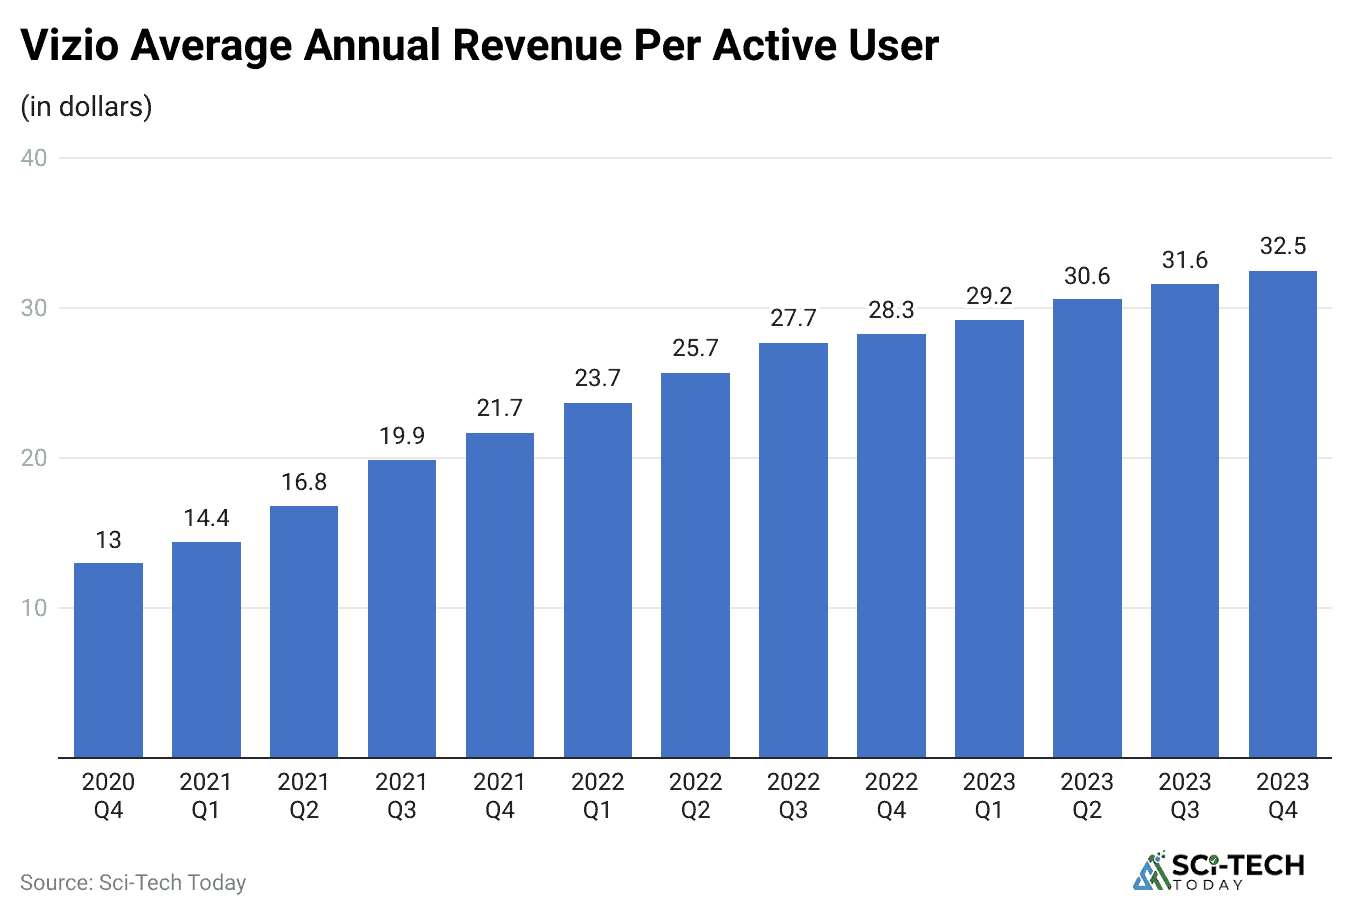
- During 2023, average annual revenue per user (ARPU) was about $32.48; in Q3 2024, it rose to $37.17.
- That 18% growth in ARPU shows effective monetization strategies are scaling.
- Roughly 96% of Vizio TVs sold come with SmartCast built in, giving a massive reach into living rooms.
- Daily SmartCast use averages 1.4 hours per user, well above ad delivery thresholds for advertisers.
- SmartCast now rivals standalone streaming platforms in time spent per user inside its OS.
- These high engagement and ARPU metrics are critical to the Platform+ revenue uptrend.
| Period | Active Accounts | Streaming Hours (b) | Avg hrs/account/mo | ARPU ($) |
| 2023 Annual | 18.5M | 20.5B | 92 hrs | 32.48 |
| Q1 2024 | 18.6M | 5.6B | 101 hrs | 34.24 |
| Q2 2024 | 18.8M | 5.6B | 100 hrs | 35.39 |
| Q3 2024 | 19.1M | 5.8B | 101 hrs | 37.17 |
Advertising and Platform Growth Trends
 (Source: platformplus.vizio.com)
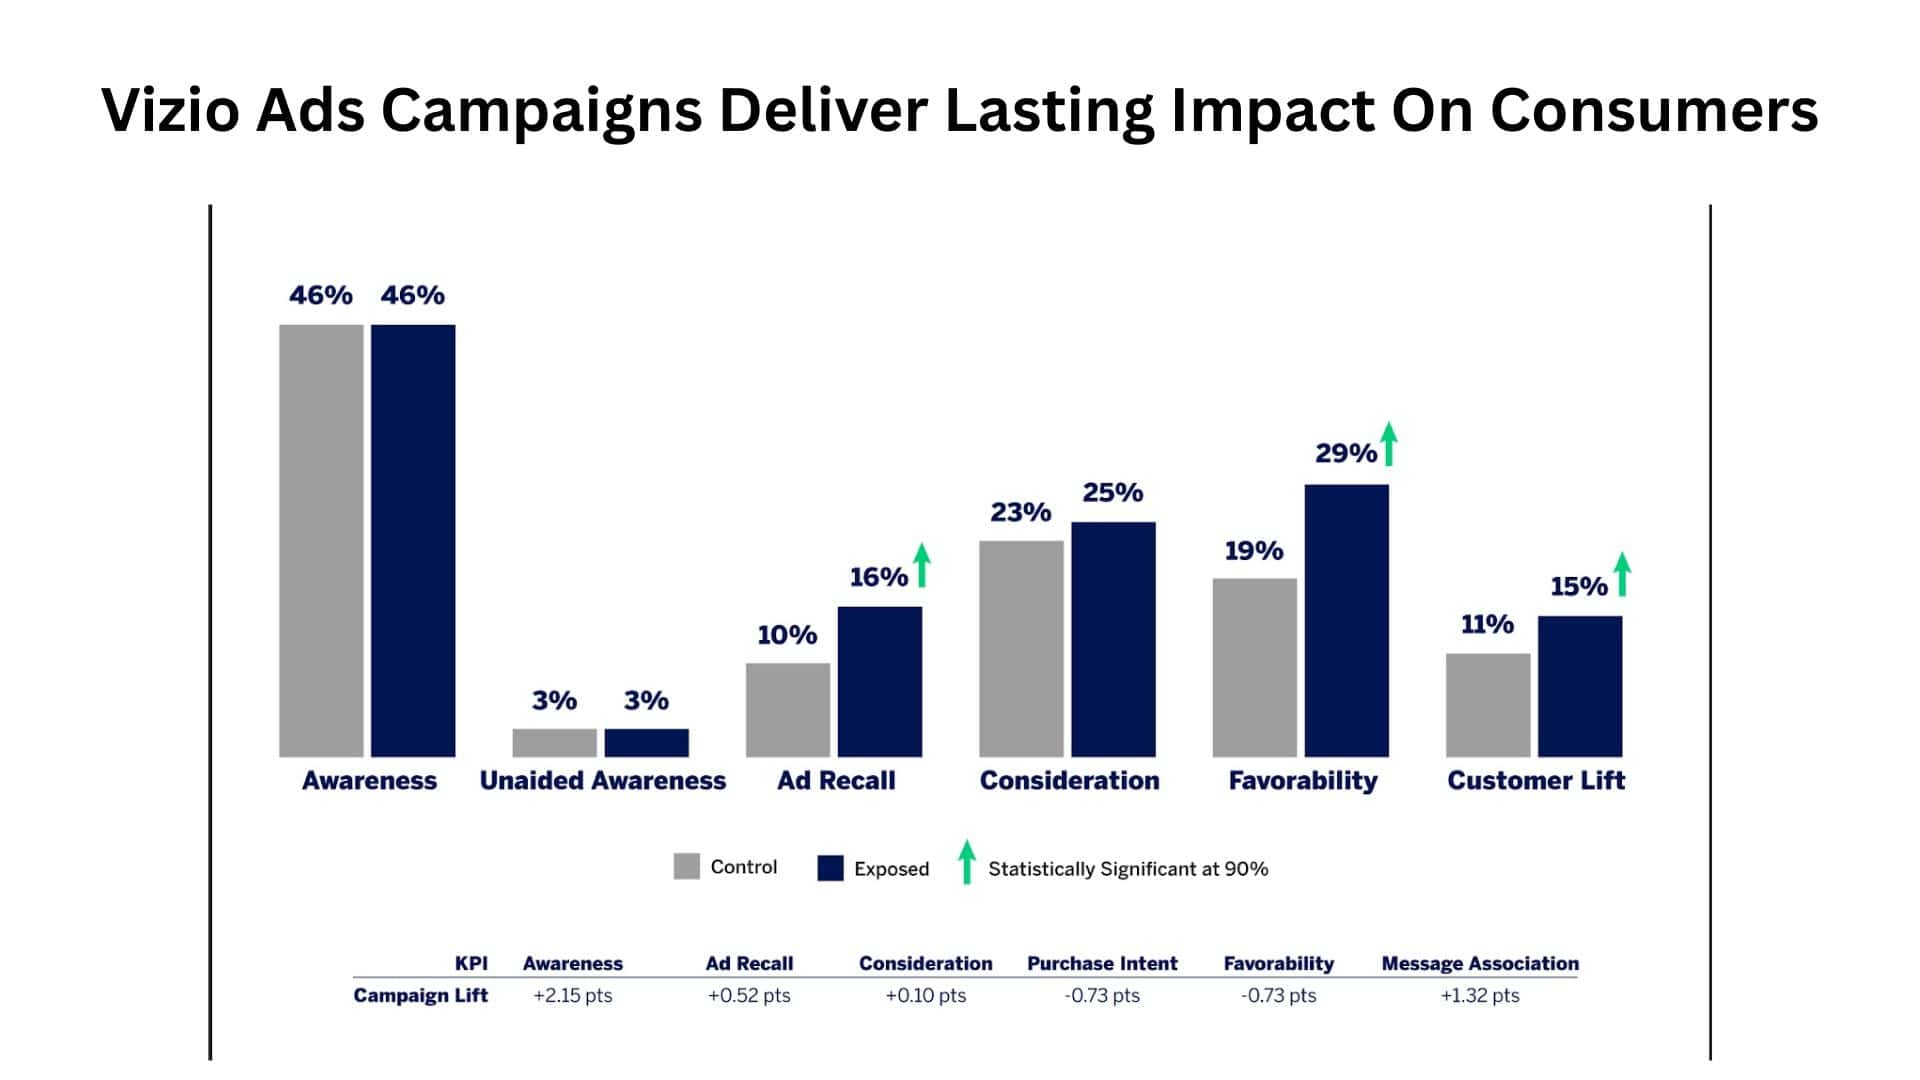
- Ad revenue grew roughly 31% YoY in 2023, marking stronger direct relationships with brands.
- The number of direct advertising deals surged 40% in Q1 2024, then 13% in Q2, and 20% in Q3.
- Vizio now tracks more than 20 million devices via its Inscape ACR tech for targeting.
- Average CPM (cost per thousand ad impressions) on SmartCast is $18, up year‑over‑year.
- Platform+ revenue growth outpaces hardware decline. 2023 ad revenue alone neared $466 million.
- Non‑ad Platform+ revenue (licensing, CRO, etc.) grew 9% YoY in 2023, adding layers to growth.
- With Walmart integration, advertisers’ reach can leverage retail purchase data, plus household viewing.
- Platform+ margins above 60% let Vizio reinvest in ad tech and reduce dependence on thin hardware.
- SmartCast’s ad targeting is richer than Roku’s, thanks to combined viewer + retail data post‑2024.
- Ad-driven revenue is projected to drive 30%+ growth per quarter into 2025, as device sales flatten.
| Metric | Recent Value / Trend |
| Ad Revenue Growth 2023 | 31% YoY ($466M total) |
| Direct Deals YoY (Q1 to Q3) | +40% in Q1, +13% in Q2, +20% in Q3 |
| Devices Tracked by Inscape | 20 million |
| Avg CPM | $18 |
| Platform+ Margins | 60 to 70% |
| Device vs. Platform Shift | Platform+ revenue now 36% of total revenue |
Shipment and Device Performance Metrics
 (Reference: nscreenmedia.com)
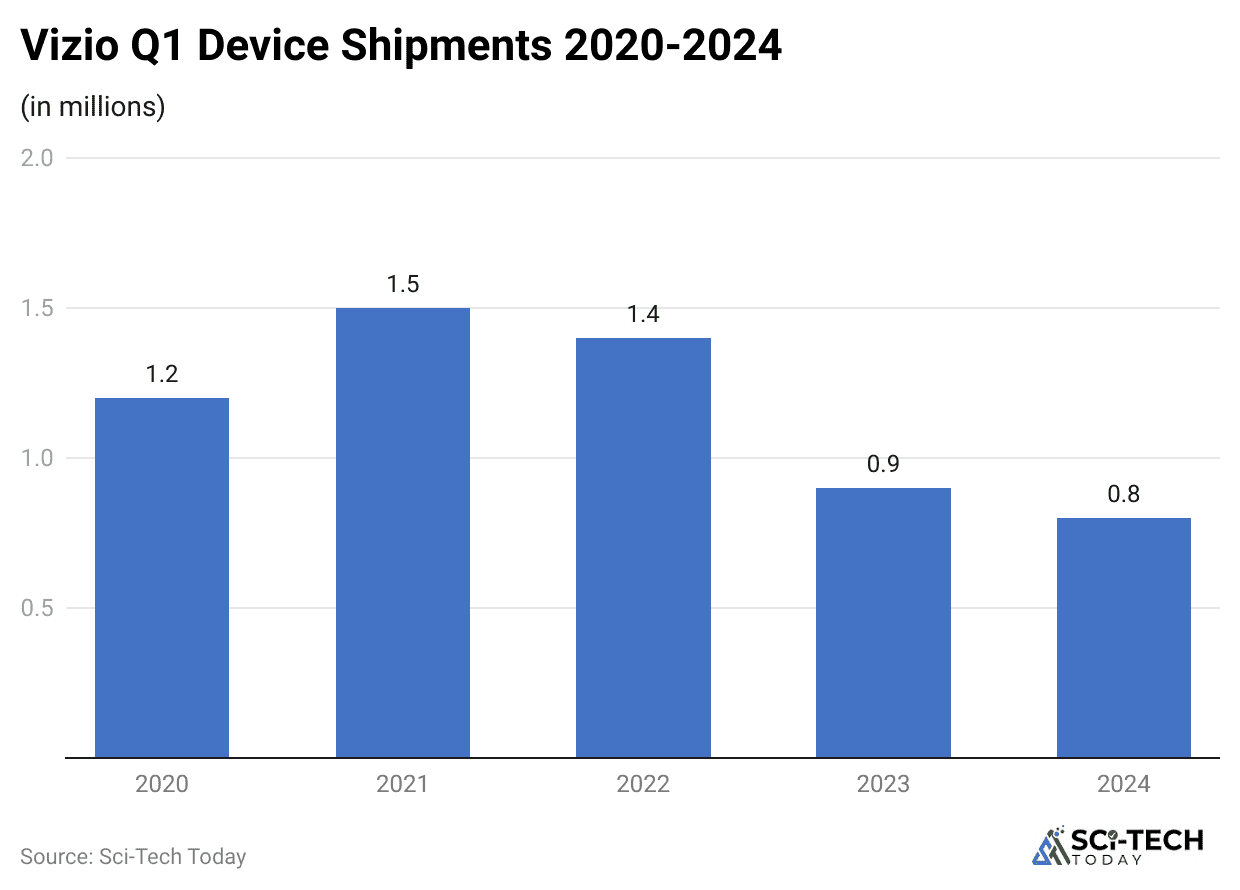
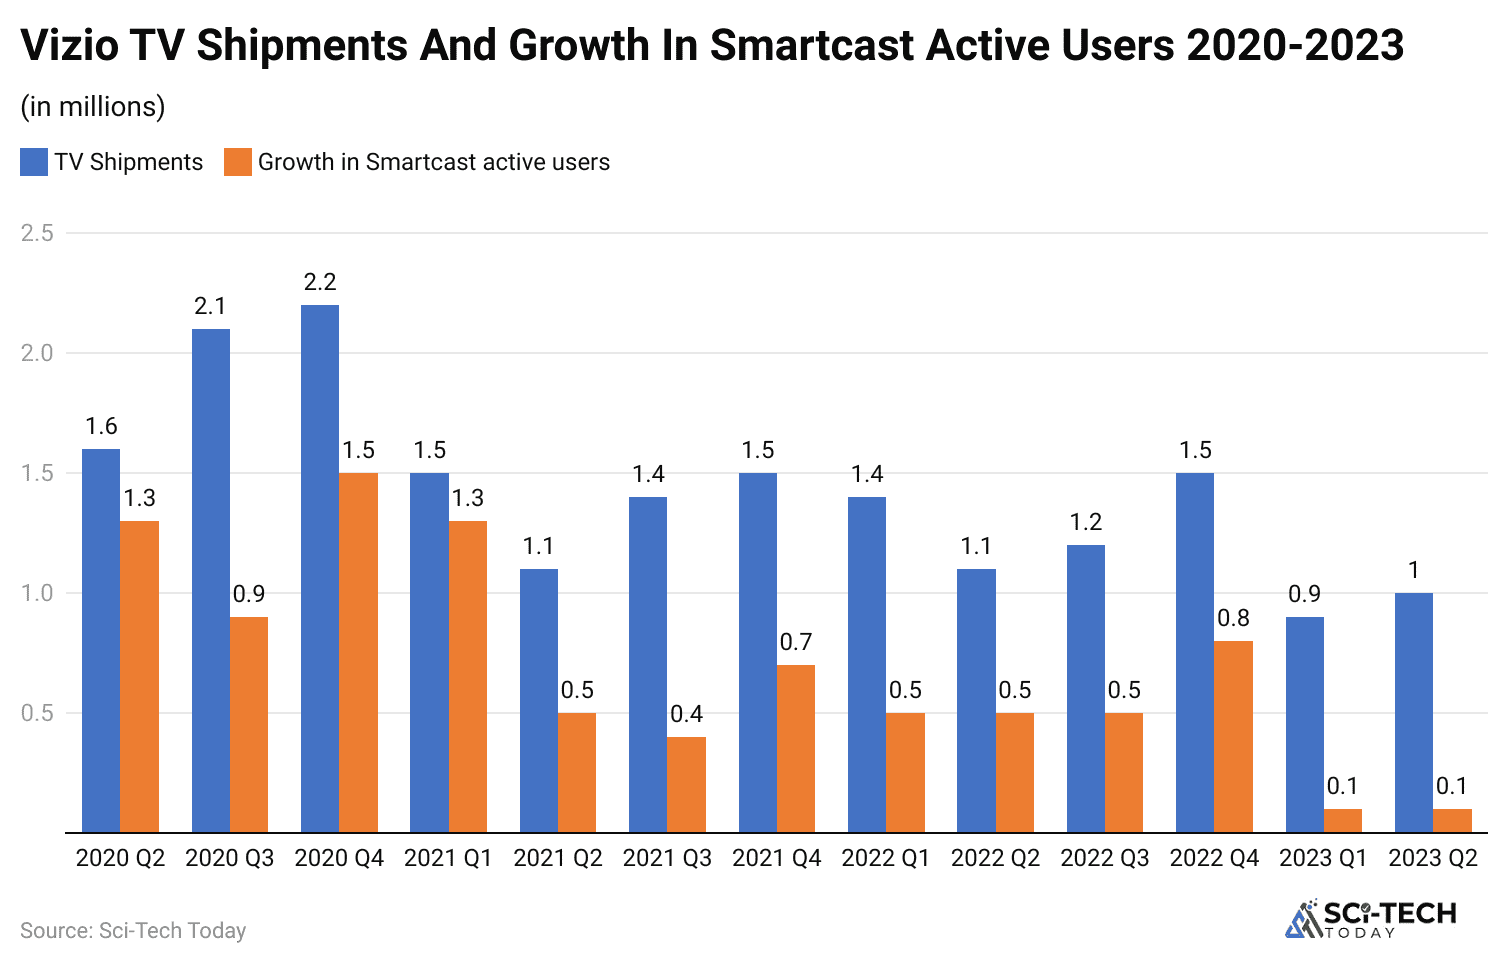
- In 2023, Vizio shipped around 4.3 million smart TVs, down 16% from 5.2M units in 2022.
- In 2024, Q1 unit shipments dropped 14%, and Q3 about 5%, impacting device revenue directly.
- Average selling price (ASP) for Vizio TVs fell around 9% in 2023, squeezing device margins.
- Soundbar shipments declined along with TVs, further dragging device segment results.
- Device revenue decline stems from both volume reduction and increased discounting pressure.
- Trade‑in programs and seasonal discounting pushed down ASP in late 2023 and early 2024.
- Emerging competition from brands like TCL, Hisense, and Amazon’s Fire TVs accelerated device decline.
- Global shipment figures show limited expansion, and Vizio remains largely North American‑centric.
- Despite the decline, Vizio remains among the top 5 sellers of smart TVs in the U.S., retaining a 13% share.
- Forecasts suggest stabilized shipments only if hardware quality improves or new flagship lines arrive.
| Period | TV Units Shipped | YoY Δ | ASP Δ | Device Rev Trend |
| 2022 2023 | 5.2M 4.3M (‑16%) | ‑16% | ‑9% | Declining |
| Q1 2024 vs Q1 2023 | 0.8M (‑14%) | ‑14% | lower | Device down 16% |
| Q3 2024 vs Q3 2023 | 1.0M (‑5%) | ‑5% | lower | Device down 8% |
Market Share and Competitive Position
 (Source: businesswire.com)
- In 2023, Vizio accounted for about 13 to 15% of the U.S. smart TV market, making it a perennial top‑5 brand.
- Vizio also holds roughly 14% of the U.S. soundbar market, positioning it as a reliable volume leader.
- While Samsung and LG dominate the premium TVs, Vizio undercuts them on price with a healthy market reach.
- Roku and TCL brands gained ground in smart TVs, putting pressure on Vizio’s hardware share.
- In ad-tech, Vizio’s Platform+ revenue-per-user metrics compare well to Roku’s $41 ARPU (Vizio 37).
- Walmart’s backing gives Vizio the potential to integrate retail shopper data with TV viewing data for targeting.
- Emerging Chinese OEMs are eroding market share in entry-level segments with aggressive pricing.
- Platforms like Roku and Amazon Fire still lead OS engagement, but SmartCast has a strong growth cadence.
- Vizio holds elevated relevance in the U.S. but remains small globally, unlike Samsung or LG, with wider distribution.
- Moving forward, its comp advantage comes from combining hardware reach with Walmart/advertiser synergy.
| Segment | Vizio Share (U.S.) | Competition and Strategic Position |
| Smart TV Market | 13 to 15% | 2 to 5 vs Samsung, LG, TCL/Roku |
| Soundbar Segment | 14% | Among the top U.S. brands |
| ARPU (Q3 2024) | $37/user | Slightly below Roku ($41) |
| Platform Strength | Growing rapidly | Strong ad-tech vs Roku |
| Global Reach | North America only | Lags Samsung/LG globally |
User Experience and Public Sentiment
 (Reference: zippia.com)
- Many user reports describe SmartCast as slow or unreliable, prompting some to bypass it for external devices.
- Common complaints include issues with Wi-Fi connectivity, interface glitches, and missing profile features.
- Some users praise Vizio’s early models (2012 to 2016) for build quality, contrasting them with recent hardware.
- There’s consistent chatter that newer Vizio TVs have more screen defects or component failures.
- Forums show users regularly plugging in Roku sticks or Fire TVs rather than opening SmartCast directly.
- Yet many reviews still highlight Vizio’s unbeatable price-to-spec value, especially in entry-level 4K TVs.
- Poor app experience on SmartCast can affect user retention and reduce ad impressions per device.
- Soundbars generally earn better user ratings than TVs, with high marks for performance at a low cost.
- User sentiment often reflects a trust trade-off: affordability at the cost of a polished software experience.
- Unless UX improves, hardware risk could damage SmartCast’s growth and future Platform+ engagement.
| Feedback Area | Common Themes |
| SmartCast Reliability | Slow, glitchy connectivity issues |
| Hardware Quality Trend | Earlier models praised, newer ones mixed |
| UX & Interface Issues | Missing profiles, clunky menus |
| App Utilization Behavior | Users often use external streaming sticks |
| Value Proposition | Widely appreciated for the price-to-features |
Strategic Shifts and Business Model Evolution
 (Reference: nscreenmedia.com)
- Since around 2018, Vizio has pivoted from hardware-first to platform-first as revenues and margins have shifted.
- Platform+ margins consistently hover around 60 to 70%, while hardware margins remain tight or negative.
- Advertising & data services now account for 36% of total company revenue, up from under 30%.
- Founder William Wang stayed in charge through the Walmart acquisition, ensuring platform continuity.
- Inscape underpinned the shift, capturing video viewing data for personalized ad targeting.
- The Walmart deal locks Vizio into a broader retail-advertising ecosystem via Walmart Connect.
- Vizio will operate semi-independently with Walmart’s backing, keeping tech and product identity intact.
- Future growth is expected to come primarily through ad monetization rather than new product lines.
- Potential for branded hardware upgrades (mini-LED or OLED) exists, but dependent on margin appetite.
- The evolving model focuses on viewer hours, ad yield per user, and broader household analytics, not just TV sales.
| Period | Strategic Focus Shift | Resulting Business Model |
| Pre‑2018 | Hardware-first manufacturing model | TV and soundbar product focus |
| 2018 to 2021 | Launch of Platform+ (SmartCast, Inscape) | Ads & data grew in importance |
| 2021 IPO – 2023 | Public scaling of platform revenue | Device decline, platform rise |
| Post‑2024 Acq. | Joined Walmart’s ad-tech/retail ecosystem | Ad-first integrated business model |
Future Outlook and Forecasts in Vizio Statistics
 (Reference: nscreenmedia.com)
- Demand for ad‑driven TV ecosystems continues to grow platform ad revenues are expected to grow 20 to 30% quarterly.
- SmartCast user base likely to exceed 20 million by the end of 2024, based on current growth trajectory.
- ARPU trending upward by Q4 2024, could surpass US$38 to US$40 per user annually.
- Device sales are likely to remain flat or decline unless hardware reliability or innovation improves.
- Walmart integration offers powerful data synergy linking shopper behavior to viewing segments.
- Competition from TCL, Hisense, Roku, and Amazon may further squeeze hardware ASP and margins.
- Vizio could launch higher‑end models (mini‑LED, OLED) to regain market share and lift ASP.
- International expansion remains limited growth potential tied to the U.S. ad and retail ecosystem.
- Ad/Platform+ revenue may break US$750M by 2025 if growth projections hold.
- Ultimately, Vizio Statistics evolve into measures of engagement, ads served, and audience scale, not just TVs sold.
| Forecast Factor | Expected Trend by 2025 |
| SmartCast Users | 20M+ users |
| ARPU | US$38 to US$40 per year/user |
| Platform+ Revenue | US$750M+ if growth sustains |
| Hardware Segment | Flat/decline unless new quality models |
| Retail/Data Integration | Deep integration with Walmart Connect |
Conclusion
Wading through Vizio Statistics reveals a company that has evolved from selling budget TVs to building a scalable ad-tech platform wrapped in SmartCast. The story isn’t just about units shipped, it’s about viewer hours, active accounts, and monetization per user.
As hardware revenue fades, Platform+ is surging. Walmart’s acquisition cements Vizio’s transformation into a retail media asset. If you’re looking at Vizio today, don’t just count TVs; they’re selling attention, and that’s gold in the connected-TV age. I hope you guys like these statistics. If you have any comments, kindly let me know in the comments section.
