








Lead-in
Workplace Violence Statistics: Workplace violence is a growing concern for employees and employers across many industries. It can happen in different forms, including threats, verbal abuse, harassment, bullying, and physical attacks. These incidents can make employees feel unsafe, stressed, and less confident at work. They can also affect productivity, employee well-being, and overall workplace culture. However, recognizing the warning signs and understanding the common causes can help organizations prevent serious incidents. Strong workplace policies, proper training, clear reporting systems, and quick action can make a real difference.
In this article, we explore key workplace violence statistics, major causes and risk factors, its impact on employees and businesses, and practical ways to build a safer workplace.
Best of the Editors
- Nearly 23% of workers worldwide have experienced workplace violence or harassment.
- 17.9% experienced psychological violence, making it the most common form.
- 8.5% experienced physical violence or harassment at work.
- 6.3% experienced sexual violence or harassment.
- 59% of affected workers experienced violence or harassment more than once.
- 84.8% of nurses surveyed in 2025-26 experienced workplace violence.
- Healthcare accounted for 72.8% of private-industry workplace-violence cases in the 2021-22 BLS data.
- U.S. hospitals spent USD 18.27 billion on workplace and community violence in 2023.
- 733 fatal workplace injuries resulted from violent acts in the U.S. in 2024.
- 74.8% of employers provided workplace-violence training in 2026, but only 38.4% offered a clear incident-reporting method.
Global Workplace Violence Statistics
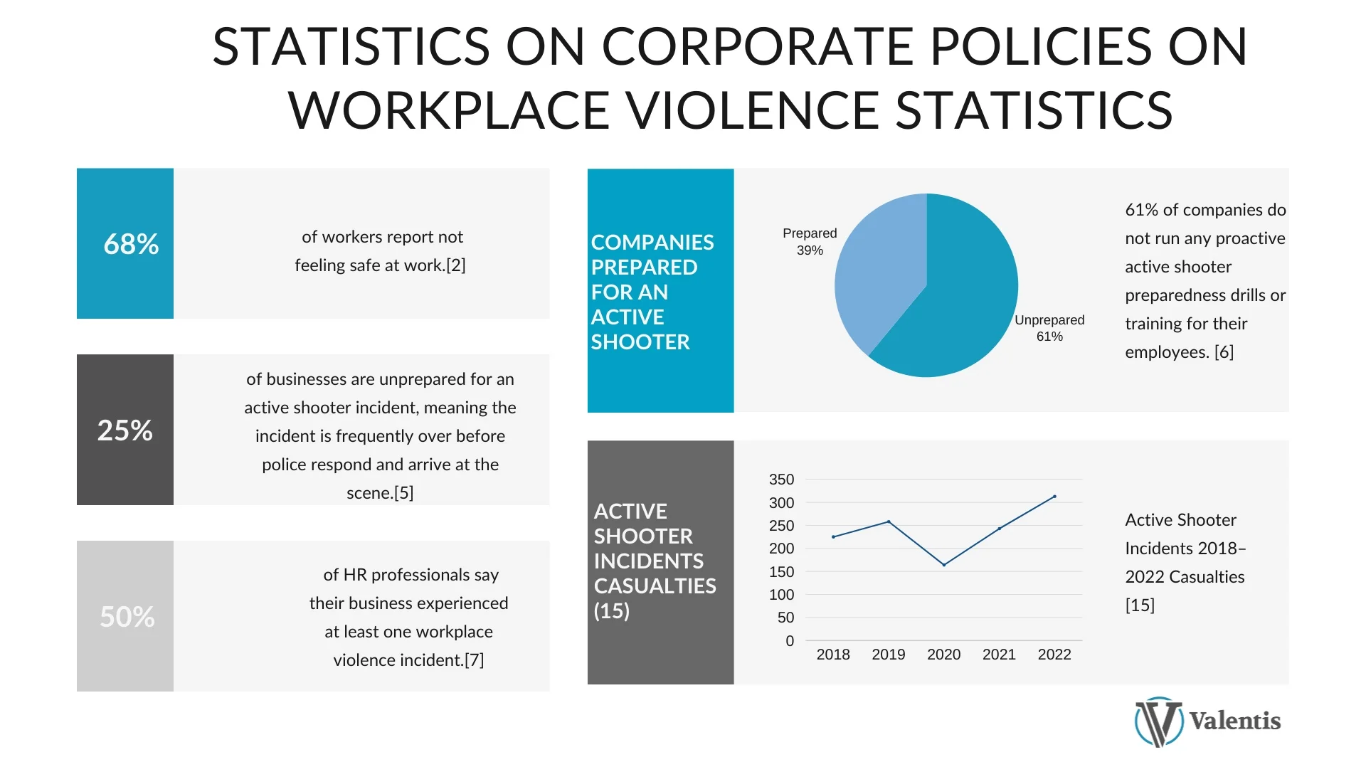
(Source: valentisinc.com)
- Around 23% of workers worldwide have reported experiencing at least one form of workplace violence, showcasing the global magnitude of this issue across all sectors.
- Psychological violence is the most common type, affecting 17.9% of the global workforce, often in the form of repeated bullying, verbal abuse, or intimidation.
- Physical violence has been experienced by 8,5% of workers globally, including incidents like pushing, hitting, or other bodily threats in the workplace.
- Sexual violence at work, which includes verbal and physical harassment, has impacted 6.3% of workers across different countries and professional levels.
- More than 60% of victims have experienced workplace violence more than once, highlighting its repetitive and ongoing nature in organizational settings.
- Approximately 32% of victims have encountered more than one form of violence, indicating overlapping psychological, physical, or sexual abuse at work.
- Nearly 6% of employees reported suffering from all three major forms of violence, pointing to deeply entrenched and complex abuse environments.
- In high-income countries, 32% of workers report workplace violence, significantly higher than in low-income regions, suggesting greater transparency and reporting access.
- Workers in low-income countries still face a substantial 17% exposure rate, but underreporting due to a lack of systems may mean actual figures are even higher.
- Americans report the highest regional rate, with 34% of employees stating they’ve experienced workplace violence during their careers.
Workplace Violence by Gender
| Group | Sexual Harassment (%) | Psychological Violence (%) | Physical Violence (%) | Reporting Rate (%) |
| Women | 2.7x more than men | 19 | 38 | 11 |
| Men | Lower | 16 | 62 | 25 |
| LGBTQ+ | 34 | 28 | 22 | 14 |
| Transgender Employees | 47 | 39 | 18 | 9 |
By Age Group
| Age Group | Any Violence (%) | Physical Violence (%) | Psychological (%) | Verbal Abuse (%) | Reporting Rate (%) |
| 18 to 24 years | 31 | 19 | 22 | 26 | 25 |
| 25 to 34 years | 28 | 16 | 21 | 24 | 30 |
| 35 to 44 years | 22 | 12 | 18 | 21 | 38 |
| 45 to 54 years | 18 | 9 | 14 | 17 | 42 |
| 55+ years | 11 | 5 | 8 | 11 | 50 |
Workplace Violence by Job Role/Position
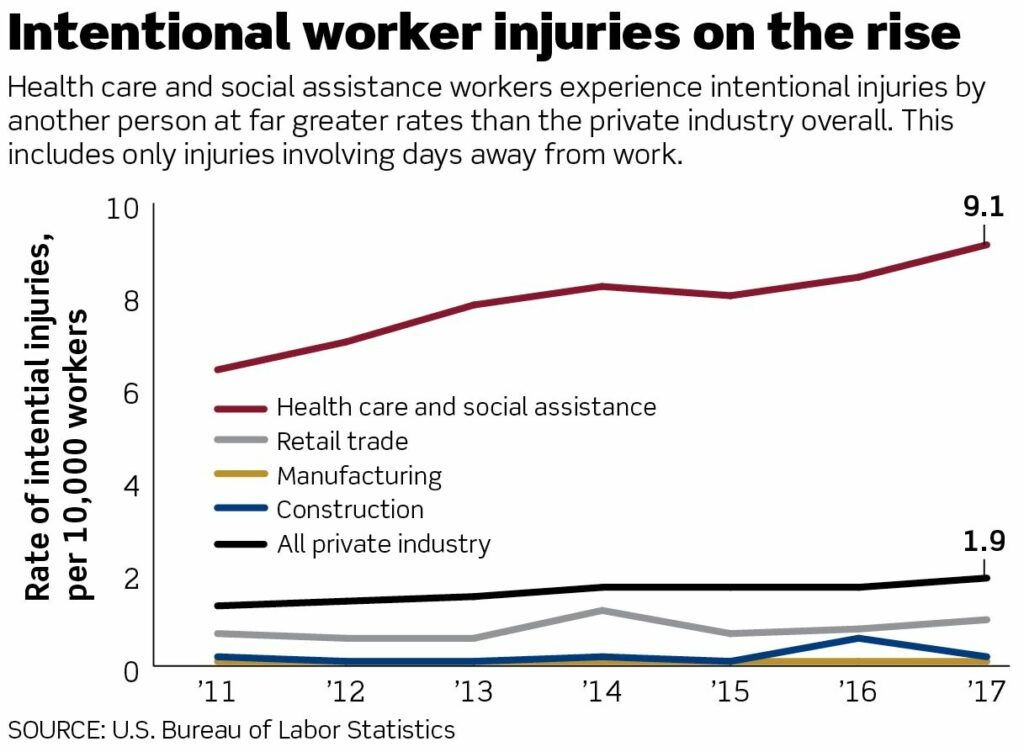
(Source: everbridge.com)
- Customer service staff, cashiers, and call-center employees have the highest exposure rate at 38%.
- Supervisors and managers experience workplace violence at a rate of about 24%.
- Senior executives and C-suite leaders report a lower exposure rate of 12%.
- Interns and entry-level employees face a 31% exposure rate.
- Freelancers and contract workers report workplace violence at around 17%.
- HR professionals experience violence in about 22% of cases.
- IT and technical employees report a 13% exposure rate.
- Security personnel record a 28% violence rate despite receiving training to manage confrontational situations.
- Educators and academic staff experience workplace violence at a rate of 14%.
- Remote freelancers report the lowest rate at 6%.
| Job Role/Position | Any Violence (%) | Physical (%) | Verbal (%) | Psychological (%) |
| Frontline Workers | 38 | 22 | 35 | 29 |
| Interns/Entry-Level | 31 | 16 | 28 | 24 |
| Supervisors/Managers | 24 | 12 | 20 | 21 |
| C-Suite Executives | 12 | 4 | 10 | 11 |
| Freelancers/Contractors | 17 | 6 | 14 | 15 |
| HR Professionals | 22 | 7 | 18 | 20 |
| IT/Technical Staff | 13 | 5 | 11 | 9 |
| Security Personnel | 28 | 20 | 18 | 16 |
| Educators/Academic Staff | 14 | 3 | 12 | 10 |
| Remote Freelancers | 6 | 1 | 4 | 5 |
Workplace Violence Trends Across Employment Types
- According to nationalnursesunited.org, healthcare registered nurses experienced significant workplace violence, with 84.8% of 1,267 RNs reporting at least one incident in NNU’s 2025–26 survey, while 70.3% faced verbal threats.
- Physical injuries and symptoms were reported by 23.4% of nurses following workplace-violence incidents.
- Violence levels increased according to 36.4% of nurses, while only 6.8% reported a decrease in violence on their units.
- Workplace violence affected retention, with 25.5% of nurses considering leaving the profession and 18.6% taking time off after an incident.
- Hospitality workers also faced considerable exposure, with nearly 50% reporting that they had witnessed workplace violence.
Workplace Violence Rates
| Employment Type | Any Violence (%) | Physical (%) | Verbal (%) | Psychological (%) |
| Full-Time Employees | 26 | 12 | 23 | 19 |
| Part-Time Workers | 19 | 8 | 17 | 15 |
| Gig Workers | 21 | 10 | 18 | 16 |
| Temporary Staff | 17 | 7 | 14 | 13 |
| Seasonal Workers | 24 | 11 | 21 | 18 |
| Interns/Apprentices | 29 | 14 | 25 | 22 |
| Remote Full-Time | 9 | 2 | 6 | 7 |
| Freelancers (Online) | 11 | 3 | 9 | 8 |
| Unionized Workers | 15 | 5 | 13 | 10 |
| Non-Union Workers | 30 | 13 | 27 | 21 |
Categories of Workplace Violence
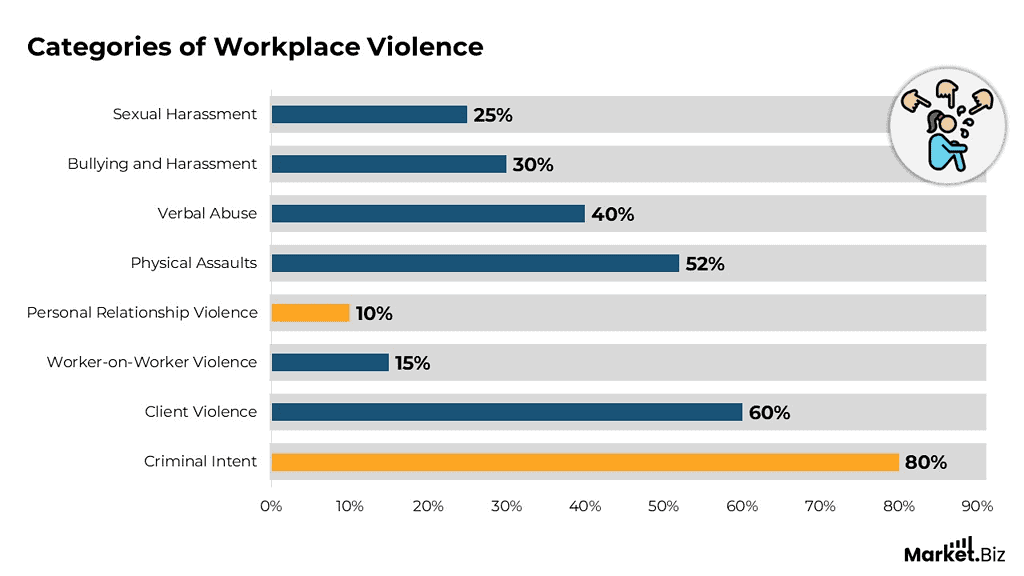
(Source: market.biz)
- Criminal-intent violence is the most common category, accounting for 80% of reported workplace violence cases.
- Client violence ranks second at 60%, showing higher risk in customer-facing roles.
- Physical assaults represent 52% of cases, followed by verbal abuse at 40%.
- Bullying and harassment account for 30%, while sexual harassment represents 25%.
- Worker-on-worker violence makes up 15% of incidents.
- Personal-relationship violence is the least common category at 10%.
Workplace Demographics: Violence by Gender
- Women accounted for 52,970 workplace-violence cases, compared with 24,200 cases among men, in private industry during 2023-2024; women therefore represented about 67.6% of cases in this dataset.
- In the BLS 2021-2022 dataset, women represented 72.5% (41,750 cases) of nonfatal workplace-violence cases, with an annualized rate of 5 cases per 10,000 FTE workers, compared with 1.4 cases for men.
- A 2026 study of 1,095 nursing interns found that 40.0% experienced workplace psychological violence, including 41.4% of female interns and 30.6% of male interns.
- In 2024, women accounted for 413, or 8.1%, of all U.S. workplace fatalities but 72, or 15.3%, of workplace homicide fatalities.
By Age
- The 2026 University of Maryland T2V study found that workplace-violence perpetrators had an average age of 37.1 years, with ages ranging from 15 to 77 years.
- People younger than 18 accounted for approximately 0.8% of workplace-violence perpetrators in the T2V dataset covering 2023-2025.
- BLS recorded 15 fatalities among workers under 16, 25 among workers aged 16-17, 66 among those aged 18-19, 314 among those aged 20-24, and 851 among those aged 25-34 in 2024.
- 977 fatalities among workers aged 35-44, 967 among those aged 45-54, 1,031 among those aged 55-64, and 824 among workers aged 65 and older in 2024.
By Race and Ethnicity
- BLS recorded 2,821 fatal workplace injuries among non-Hispanic White workers, 624 among non-Hispanic Black or African American workers, and 1,229 among Hispanic or Latino workers in 2024.
- Fatal workplace injuries among Black or African American workers declined from 659 in 2023 to 624 in 2024, while their fatality rate fell from 3.6 to 3.4 deaths per 100,000 FTE workers.
- Hispanic or Latino workers had a fatality rate of 4.3 deaths per 100,000 FTE workers in 2024, down from 4.4 in 2023.
- Of the 1,229 Hispanic or Latino worker fatalities in 2024, 68.5% (842 deaths) involved foreign-born workers.
- Around 183 deaths among non-Hispanic Asian workers, 20 among American Indian or Alaska Native workers, 11 among Native Hawaiian or Pacific Islander workers, and 24 among workers of multiple races in 2024.
Perpetrator Demographics
- The 2026 University of Maryland T2V study found that 89.5% of workplace-violence perpetrators were men, while the average perpetrator age was 37.1 years.
- Current employees accounted for 54.6% of perpetrators, former employees for 40.7%, and other individuals for 4.7%.
- About 31.7% of perpetrators had evidence of mental-health concerns in the T2V dataset, although this figure should not be interpreted as showing that mental-health conditions cause workplace violence.
- Job loss was the leading identified grievance at 31.4%, followed by disciplinary action at 6.3%, retaliation for reporting at 4.8%, complaints about an employer at 4.8%, and bullying at 3.7%, while 35.4% of grievances were unknown.
Industry and Occupation
- Healthcare and social assistance recorded 41,960 workplace-violence cases, representing 72.8% of all private-industry cases in the BLS 2021-2022 dataset, with an annualized rate of 14.2 cases per 10,000 FTE workers.
- The AFL-CIO’s 2026 analysis reported 78,340 workplace violence incidents that resulted in days away from work, job transfers, or restrictions during 2023-2024.
- Healthcare support occupations recorded 22,180 cases, healthcare practitioners and technical occupations recorded 20,290, and protective-service occupations recorded 6,900 cases in the 2023-2024 data.
- Patients accounted for 45,310 cases, students for 8,830, and other clients or customers for 7,710.
Fatal Workplace Violence
- In 2024, the BLS recorded 733 fatal injuries from violent acts, down from 740 in 2023.
- Homicides accounted for 470 deaths, or 64.1%, of fatal violent acts, while suicides accounted for 263 deaths, or 35.9%.
- Another person using a firearm caused 379 workplace homicide deaths, while stabbing, cutting, or slashing by another person caused 43 deaths.
- Protective-service occupations recorded 281 total workplace fatalities in 2024, including 97 homicides, meaning homicides represented 34.5% of fatalities in that occupation.
Workplace Violence by Job Level
(Source: woodruffsawyer.com)
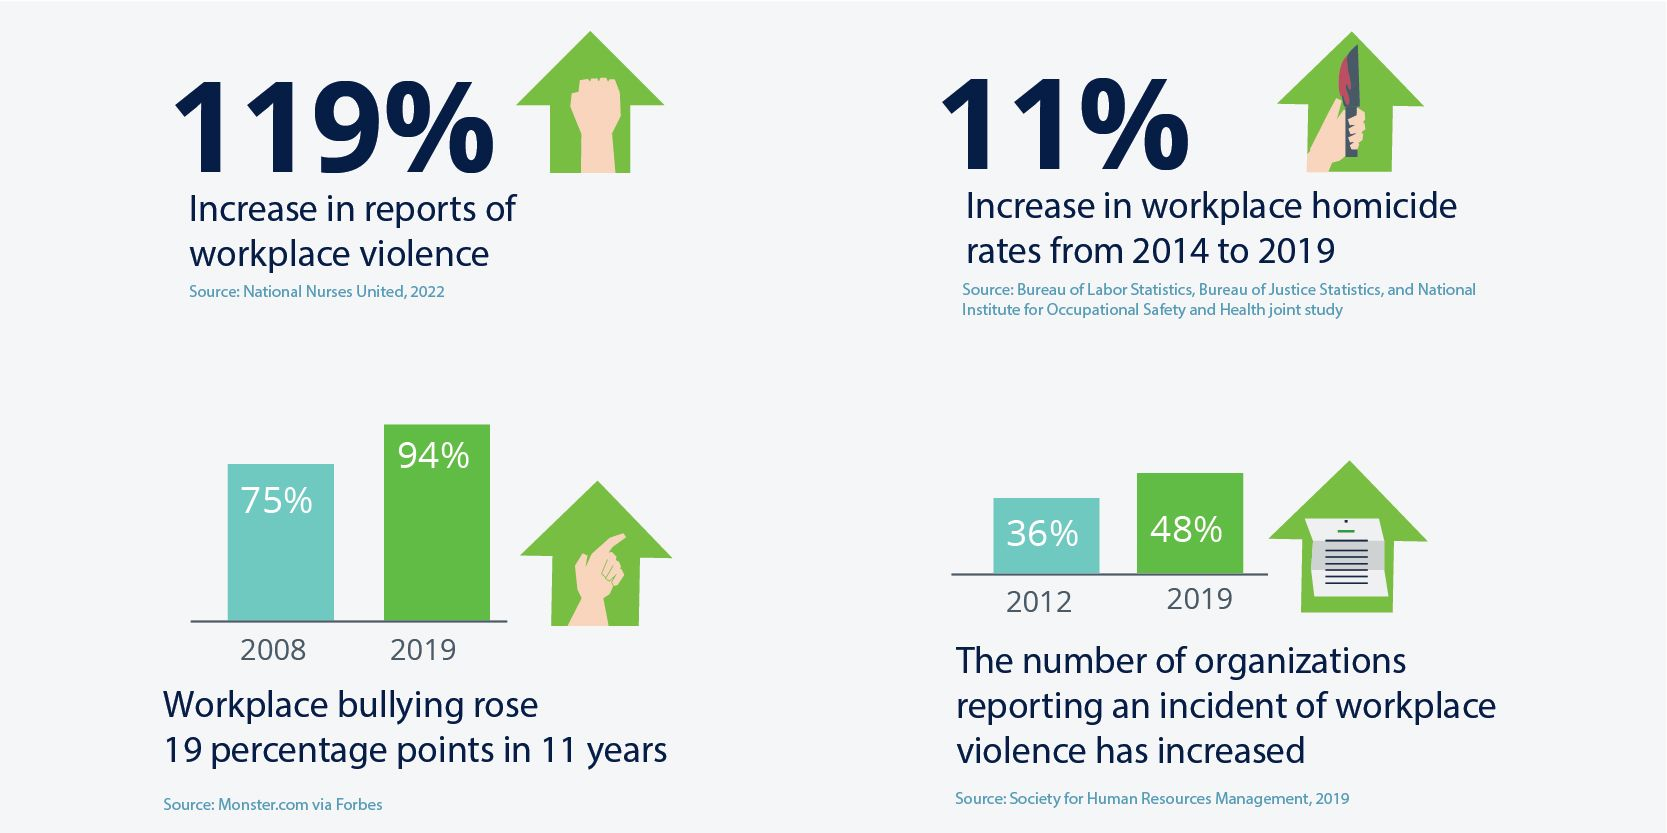
- Entry-level employees face the highest rate of workplace violence, with 38% reporting incidents in their first two years of employment, often due to a lack of authority and protection.
- Mid-level professionals report a 29% exposure to workplace violence, mostly related to peer rivalry, managerial pressure, and interdepartmental conflict.
- Senior-level employees report a lower overall rate of 18%, but the nature of incidents is often psychological, including power struggles and strategic undermining.
- Entry-level women are 2.4 times more likely to face sexual harassment than senior women, largely due to imbalanced power dynamics and a lack of reporting options.
- Mid-level managers are most likely to be caught in both upward and downward violence, receiving pressure from leadership and aggression from subordinates.
- Entry-level employees face the most physical violence from customers and clients, especially in frontline service roles like retail and hospitality.
- Senior leaders face unique psychological attacks such as exclusion from decision-making, internal sabotage, or character defamation by rivals.
- Workplace bullying is most common at the mid-level, with 41% reporting targeted humiliation, gossip, or social exclusion by peers.
- Only 9% of entry-level workers report violent incidents formally, often due to fear of job loss or not knowing how to escalate issues.
- Senior executives, although less frequently targeted, suffer more severe psychological outcomes from workplace violence due to the high stakes and public scrutiny involved.
| Job Level | Overall Violence (%) | Physical Violence (%) | Psychological Violence (%) | Reporting Rate (%) |
| Entry-Level | 38 | 21 | 27 | 9 |
| Mid-Level | 29 | 12 | 41 | 18 |
| Senior-Level | 18 | 6 | 33 | 24 |
Impact of Workplace Violence on Mental Health
(Reference: onlinelibrary.wiley.com)
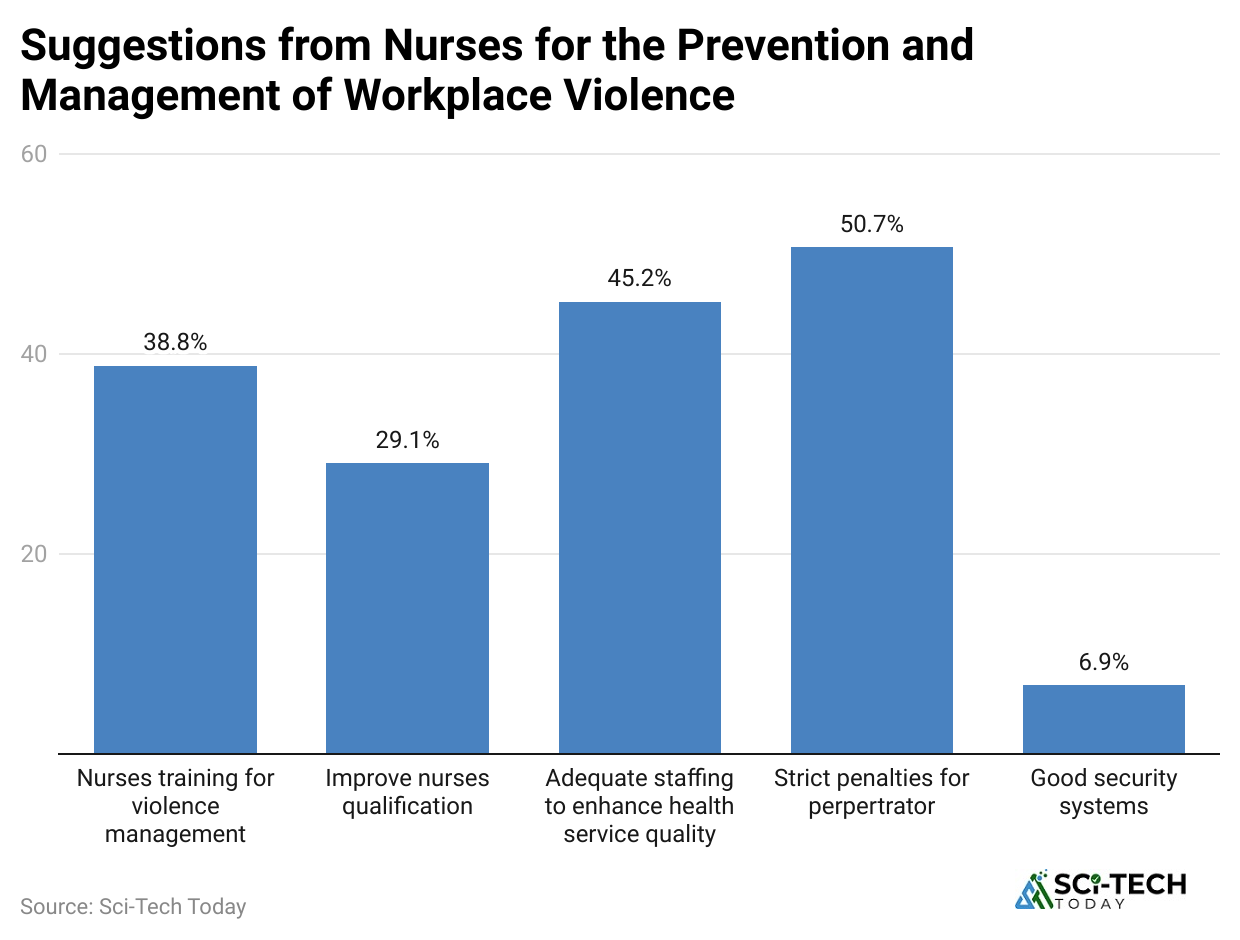
- Over 58% of employees who experience workplace violence report chronic stress symptoms, which can severely impact their cognitive performance and decision-making ability.
- Anxiety disorders affect 44% of victims of workplace violence, leading to reduced concentration, increased absenteeism, and long-term psychiatric needs.
- Depression is diagnosed in approximately 35% of individuals exposed to consistent verbal abuse or bullying at work, resulting in both emotional and physical fatigue.
- Post-Traumatic Stress Disorder (PTSD) is observed in 21% of workplace violence survivors, especially among those who faced physical or sexual assault.
- Victims of workplace violence are 4.7 times more likely to seek mental health counseling than those in non-violent workplaces, indicating a significant psychological toll.
- More than 40% of affected employees report sleep disturbances, including insomnia, which further compounds emotional instability and impairs productivity.
- Suicidal ideation has been reported in 7.5% of extreme cases of ongoing workplace violence, showing the potential life-threatening consequences of unchecked aggression.
- Around 32% of workers facing persistent harassment experience social withdrawal, distancing themselves from peers and family due to shame or trauma.
- Cognitive decline, such as forgetfulness and poor task execution, is documented in 18% of employees exposed to prolonged psychological abuse.
- Emotional burnout is found in over 53% of workplace violence victims, particularly in high-risk industries like healthcare, education, and public service.
Legal Frameworks and Reporting Rates
(Source: impriindia.com)
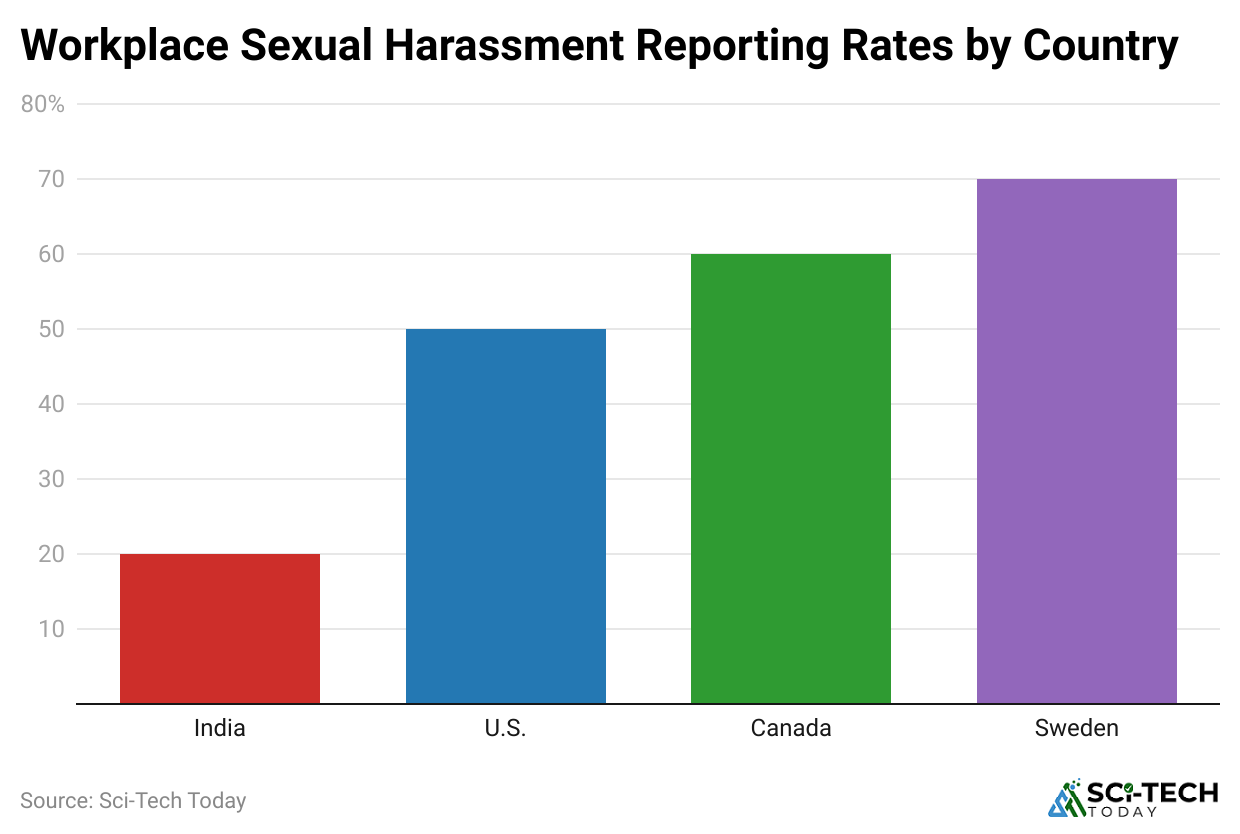
- Only 32% of workplace violence incidents are officially reported to employers or authorities, revealing a vast gap between actual events and documented cases.
- In low- and middle-income countries, underreporting exceeds 75%, primarily due to fear of retaliation, lack of legal support, or cultural normalization of abuse.
- According to the ILO, less than 50% of member states have dedicated laws addressing workplace violence, indicating global inconsistency in legal protection.
- 41% of employees feel that workplace violence complaints are not taken seriously by management, which discourages victims from coming forward.
- Companies with internal reporting protocols and zero-tolerance policies report 48% higher case disclosures, demonstrating the impact of supportive infrastructure.
- Legal frameworks that include anonymous reporting options have seen a 63% rise in reporting rates, especially in cases of sexual harassment or supervisor abuse.
- Only 18% of reported cases result in formal investigations or disciplinary action, showing the limited follow-through even when complaints are lodged.
- Women are 3 times less likely to report workplace harassment than men due to fear of victim-blaming and potential career repercussions.
- The European Union mandates that all member states implement Occupational Safety and Health Directives, yet enforcement varies widely across regions.
- In the United States, OSHA does not have a specific regulation addressing workplace violence, but it encourages employers to adopt voluntary prevention programs.
Workplace Violence Prevention Programs
(Source: proprofstraining.com)
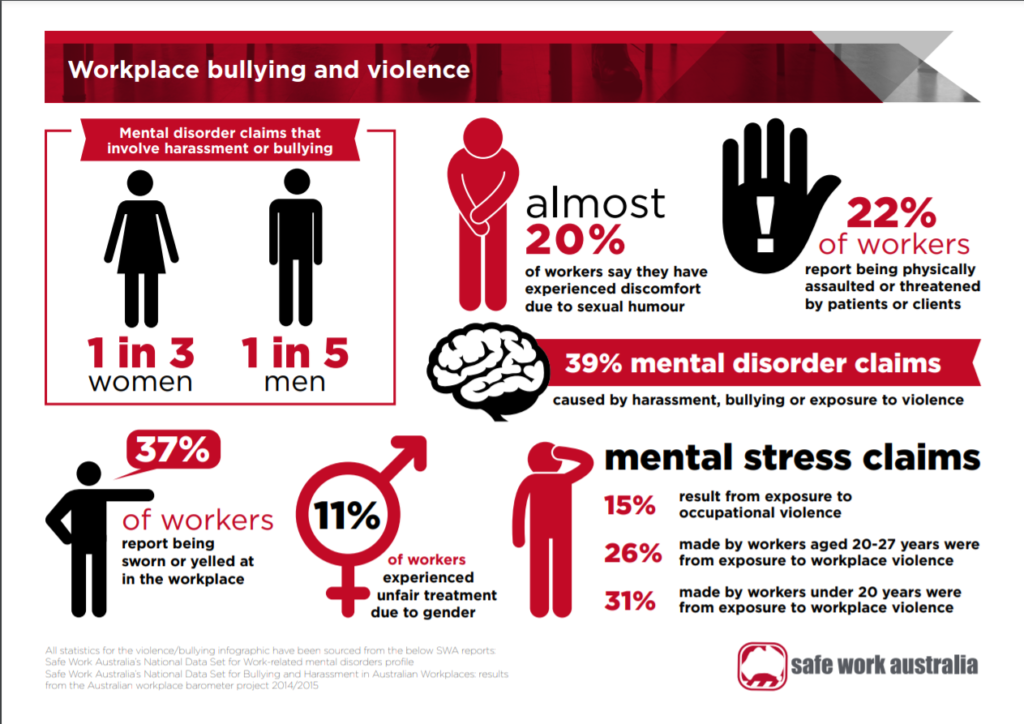
- Only 30% of global workplaces have a formalized workplace violence prevention program, despite increasing awareness of its importance.
- Among organizations with such programs, 79% report a measurable reduction in reported incidents within the first year of implementation.
- Training and education initiatives, when conducted quarterly, lead to a 56% decrease in verbal and psychological abuse cases, especially in high-stress sectors like healthcare and retail.
- Companies that provide de-escalation training to frontline staff (e.g., in hospitals, transport, and retail) report a 43% drop in physical altercations and confrontations.
- Prevention programs that include anonymous grievance channels see a 62% rise in early-stage reporting, helping identify patterns before escalation occurs.
- Organizations with a designated workplace safety officer or task force are 2.5 times more effective in addressing and resolving reported violence cases.
- Psychological counseling and trauma support services offered after violent events result in a 65% improvement in employee retention in affected teams.
- Regular workplace climate surveys that assess employee safety perception correlate with 48% fewer repeat incidents, emphasizing the value of feedback loops.
- Zero-tolerance policies, when communicated and enforced, improve workplace culture and reduce the normalizing of aggression by 37%.
- Despite proven effectiveness, budget constraints are cited by 58% of small and medium enterprises (SMEs) as a key reason for lacking such programs.
Workplace Violence Costs in U.S. Hospitals
- U.S. hospitals and health systems spent USD 18.27 billion on workplace and community violence in 2023, according to the American Hospital Association.
- Prevention before incidents costs USD 3.62 billion.
- Post-incident expenses reached USD 14.65 billion.
- Violence-related healthcare costs totaled USD 13.17 billion for treating fatal and nonfatal injuries.
- Hospital workers’ missed workdays cost about USD 79 million following violence-related injuries.
- Additional and replacement staffing cost hospitals approximately USD 541.3 million.
- Repairs and equipment replacement added USD 584.8 million in costs.
- Hospital violence-prevention programs cost an estimated USD 688.7 million annually.
- Violence-prevention training accounted for USD 1.40 billion, while de-escalation training cost USD 377.4 million.
- Security staffing linked to violence cost USD 404.3 million, while active-shooter training added USD 61.7 million.
Workplace Violence Prevention Planning Statistics
- In 2026, 74.8% of employers provided workplace violence training, according to a report shared by nationalnursesunited.org.
- Only 35.5% of employers had staff available at all times to respond to violence.
- Just 28.5% of employers added staff to reduce the risk of violence.
- Only 18.2% involved nurses or employees in violence-risk assessments.
- 38.4% of employers provided a clear incident-reporting method, meaning more than 60% lacked a clearly defined reporting pathway.
- While 59.0% investigated incidents, 41.0% did not consistently investigate reported violence.
- 42.5% of employers did not change workplace practices after an incident.
- 22.8% of employers ignored incident reports.
- 36.4% of nurses reported increased violence, while only 6.8% reported a decrease.
- Overall, 84.8% of nurses experienced at least one form of workplace violence in the previous year.
Key Facts and Economic Impacts of Workplace Violence
- Almost 23% of employed people worldwide have experienced workplace violence or harassment during their working lives.
- 17.9% reported psychological violence or harassment, making it the most common form.
- 8.5% experienced physical violence or harassment, including assault and other harmful behavior.
- 6.3% experienced sexual violence or harassment, with women facing particularly high exposure.
- 59% of affected people experienced violence or harassment more than once, showing that the problem is often repeated.
- In 2018, workplace sexual harassment caused USD 2.6 billion in lost productivity and USD 0.9 billion in other financial costs worldwide.
- Workplace stress and violence are estimated to cost 1%-3.5% of GDP in studies reviewed by the ILO.
- Depression and anxiety lead to 12 billion lost working days annually and nearly USD 1 trillion in global economic costs.
Wrap-up
Workplace violence can harm employees, affect productivity, and create fear at work. However, businesses can reduce these risks with clear safety rules, proper training, and open communication. Employees should feel safe reporting threats or warning signs without fear.
Employers must take every concern seriously and act quickly when problems arise. A strong focus on prevention, support, and safety can help create a healthier and more secure workplace for everyone.
FAQ
Common causes include workplace conflicts, stress, bullying, harassment, job insecurity, personal disputes, and disagreements with coworkers or customers
Warning signs include threats, aggressive behavior, bullying, intimidation, conflicts, and sudden changes in behavior.
Workplace violence can cause fear, stress, anxiety, low morale, and reduced productivity.

Sources


