









Beginning
Performance Management Statistics: Performance management is more than just checking how well employees are doing. It helps businesses set clear goals, track progress, give useful feedback, and help employees grow. A good performance management system can improve productivity, boost employee engagement, and connect individual efforts with company goals. Today, businesses are also using digital tools and data to make performance reviews faster, fairer, and more effective.
However, managing performance is not always easy, especially when teams work remotely or goals change quickly. Understanding the latest performance management statistics can help businesses spot key trends, measure what works, and improve their approach.
In this article, we explore important performance management statistics, trends, and insights shaping modern workplaces.
Top Recommendation
- 91.6% of organizations have a formal performance management process.
- 75.7% use a single performance management process across the organization.
- 72% of employees want reviews to focus more on their strengths.
- 63% say performance reviews do not accurately reflect their actual work.
- 80% of employees prefer real-time, ongoing feedback over annual reviews.
- 67% of high-performing teams rely on continuous feedback.
- 69% of high-performing companies prefer continuous performance models.
- 39% of employees find their performance goals unclear.
- The global employee performance-management software market is valued at USD 4.7 billion in 2026.
- Only 20% of employees strongly agree that performance management is effective.
Key Performance Management Data and Insights
- According to Yomly, 72% of employees want performance reviews to focus more on their strengths than weaknesses.
- 63% say reviews do not accurately reflect their actual work, creating a trust gap.
- 59% of managers feel stressed by review deadlines, which can affect review quality.
- After the shift to remote work, 54% of companies increased the frequency of employee feedback.
- 57% of companies improved review transparency by using technology.
- 67% of high-performing teams rely on continuous feedback to improve performance.
- 69% of high-performing companies now prefer continuous performance models over traditional annual reviews.
- 46% of HR leaders redesigned review systems to better support hybrid work.
- 39% of employees find their goals unclear, which can reduce alignment and performance.
- 74% of high-growth companies use real-time evaluation models, highlighting the shift toward more frequent performance management.
Historical Evolution of Performance Management Statistics
(Source: darwinbox.com)
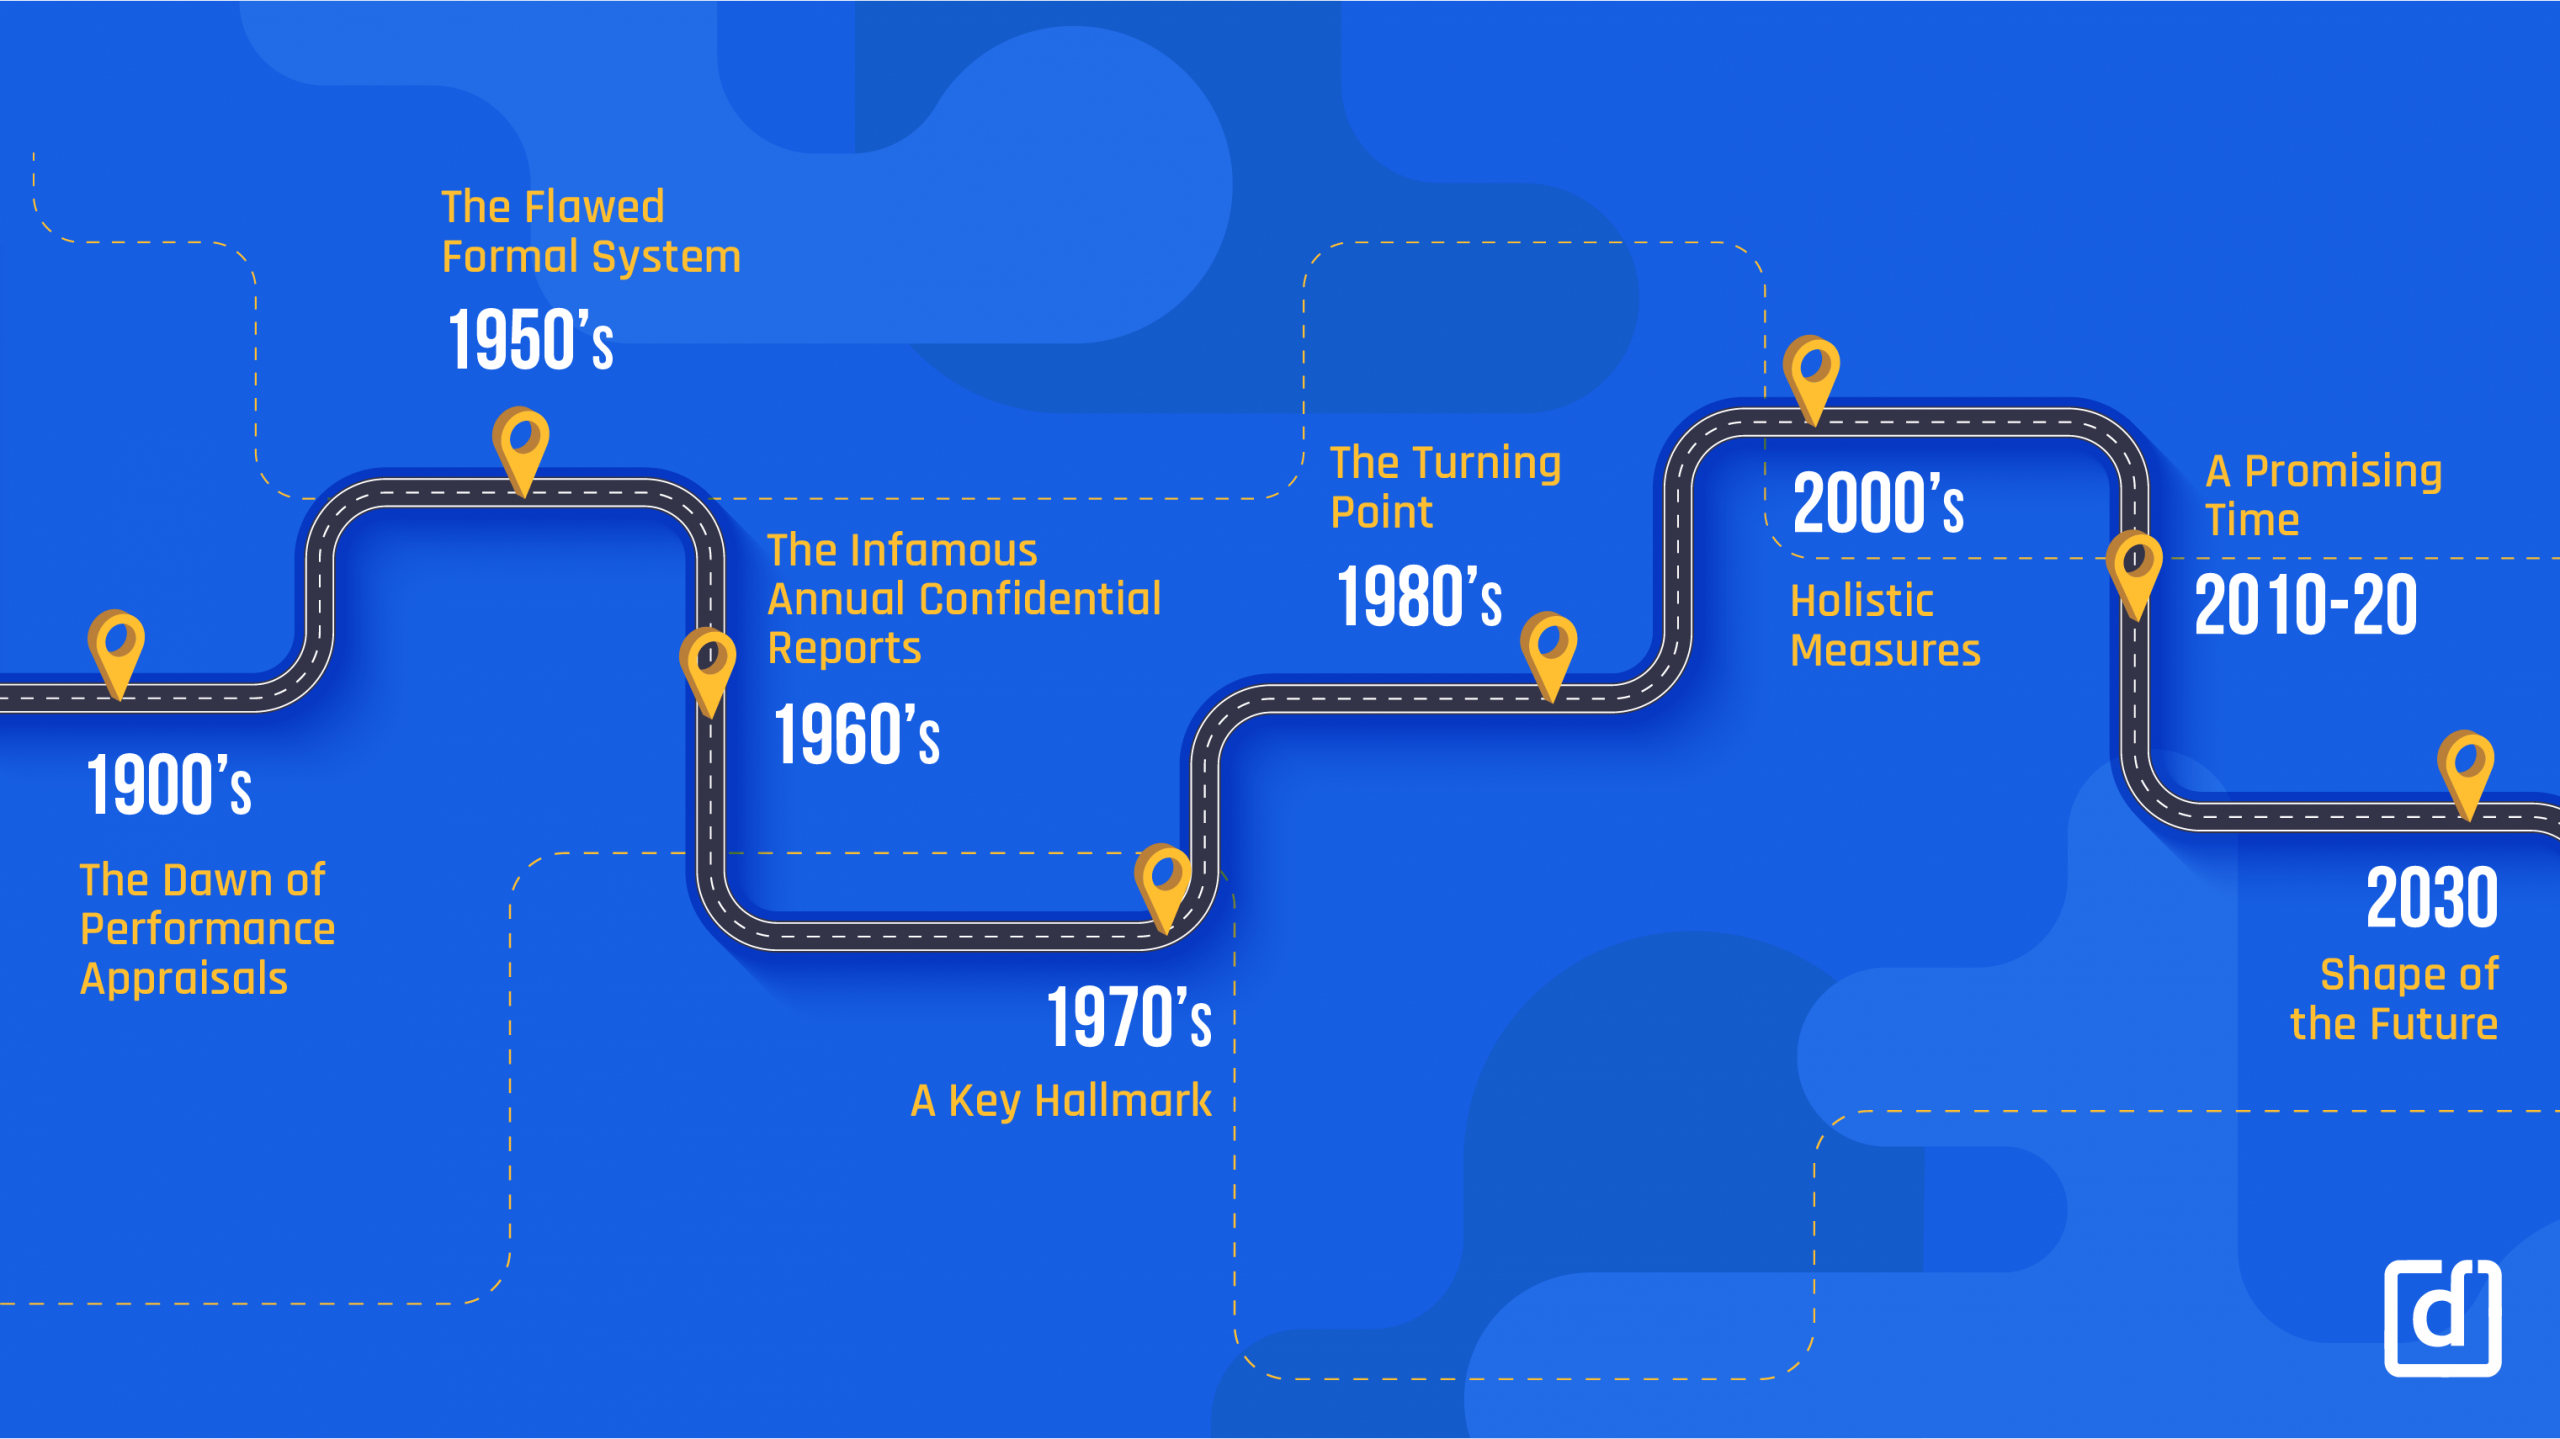
- In the 1950s, 60% of US firms used annual performance appraisals, marking the formalization of performance measurement.
- In the 1980s, 90% of firms adopted rating scales, with forced ranking rising to a peak usage of 33% by 2006.
- Balanced Scorecard, a strategic performance framework, was introduced in 1992 and adopted by over 50% of Fortune 500 companies by 2005.
- The rise of 360-degree feedback in the 1990s saw 85% of Fortune 500 companies integrating multi-rater feedback by 2010.
- The early 2000s brought multiple check-ins; yet annual reviews remained dominant with 70%+ usage until the 2010s.
- Cloud-based performance platforms emerged around 2010, growing to 65% adoption among new implementations in 2025.
- AI tools started appearing in performance systems around 2018, expanding from 5% adoption to 52% by 2025.
- In the 2020s, the trend shifted decisively to continuous feedback, with 48% of companies planning full adoption by 2028.
Performance Management Process Statistics
(Source: talentstrategygroup.com)
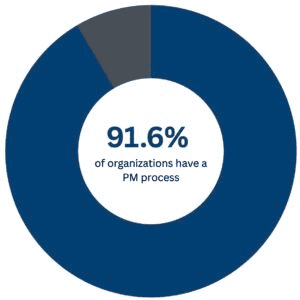
- 91.6% of surveyed organizations have a formal performance management process, while 8.4% do not.
- Among organizations without a formal process, 63.2% have fewer than 1,000 employees, and 50% report annual revenue below USD 1 billion.
- 84.2% of organizations without a formal process plan to introduce one within three years.
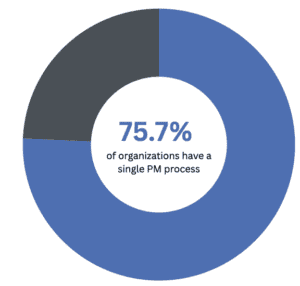
- 75.7% use a single performance management process across the organization, compared with 24.3% who use multiple processes.
- Organizations with one process report 17% higher effectiveness in improving individual performance and 14% higher goal alignment.
- A single process is also linked to 8% higher feedback and coaching effectiveness, 14% higher assessment effectiveness, and 19% higher compensation distribution effectiveness.
- 28% redesigned their process within the past year, 27.4% did so one to two years ago, 19.6% three to four years ago, and 25% five or more years ago.
Single Performance Management Process Is More Common
(Source: talentstrategygroup.com)
- 75.7% of organizations use a single Performance Management process for all full-time employees, while 24.3% use two or more processes.
- Organizations using a single process report better perceived results across all measured areas.
- They report 17% higher effectiveness in improving individual performance and 14% higher effectiveness in aligning goals.
- They also report 8% higher effectiveness in feedback and coaching and 14% higher effectiveness in assessing performance.
- Additionally, organizations with a single process report 19% higher effectiveness in distributing performance-based compensation.
Business Impact and Competitive Advantage of Performance Management Statistics
(Source: mdpi.com)
- Companies that prioritize performance management are 4.2x more likely to financially outperform industry peers.
- Employees with well-defined performance expectations report 69% greater engagement, directly affecting productivity.
- Organizations with structured performance systems experience up to a 25% reduction in turnover, improving retention.
- Regular feedback cycles boost team productivity by approximately 21%, enhancing operational responsiveness.
- Businesses using SMART goals see 24 to 33% improvements in goal achievement and alignment metrics.
- High-performing organizations report 27% higher earnings and 38% greater productivity versus low-performing peers.
- Nearly 83 to 91% of business leaders believe effective performance management is essential for organizational success.
- Only about 32% of companies say their approach enables timely, high-quality decisions on talent.
- Companies investing in performance technology are 2.5x more likely to track performance analytics effectively.
- Continuous feedback systems deliver 39% better talent attraction and 44% improved retention versus annual reviews.
Feedback Frequency and Performance Review Cadence Statistics
(Source: quantumworkplace.com)
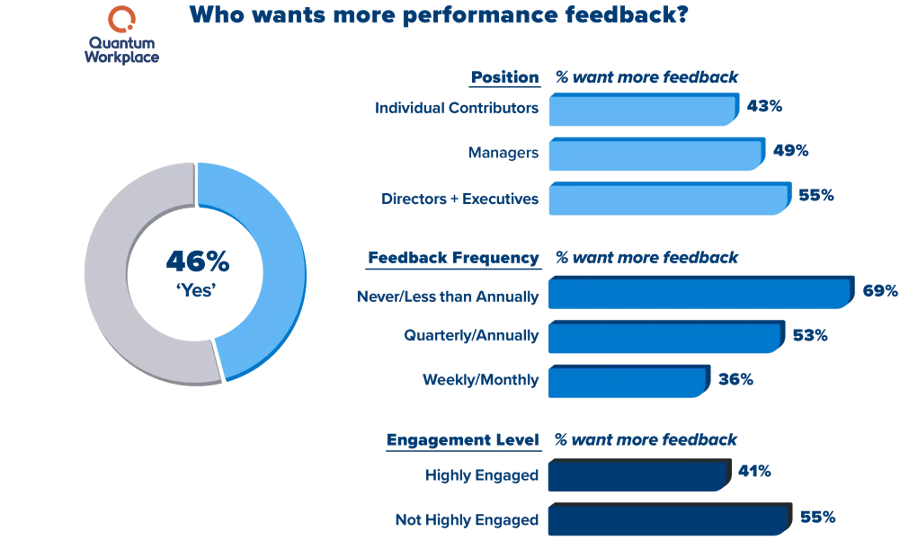
- About 63 to 71% of organizations still rely on annual or bi-annual reviews instead of ongoing feedback.
- Nearly 19% of employees receive feedback just once a year, hindering timely course correction.
- Only 41% of firms have shifted to frequent one-on-one check-ins, leaving 59% stuck in legacy systems.
- Workers reporting feedback weekly are 5.2x more likely to experience meaningful performance guidance.
- Employees receiving quarterly or monthly reviews are 4× more likely to feel supported. Regular signals of performance reduce ambiguity and anxiety.
- A full 80% of employees prefer real‑time, ongoing feedback compared to annual-only reviews. Employees seek responsiveness and recognition in the flow of work.
- Only 5% of HR leaders say they are satisfied with traditional review systems in place. The high dissatisfaction reflects outdated approaches and low impact.
- Less than 35% of employees believe current appraisal systems reflect their actual contributions.
- Managers spend, on average, 210 hours per year per team preparing traditional appraisals. Time investment is high, yet remains disconnected from day-to-day realities.
- Continuous feedback systems correlate with 2× higher employee performance compared to annual review users.
Engagement, Retention, and Productivity Metrics in Performance Management Statistics
(Source: rcademy.com)
- Disengaged employees cost economies about $8.8 to $8.9 trillion annually, nearly 9% of global GDP.
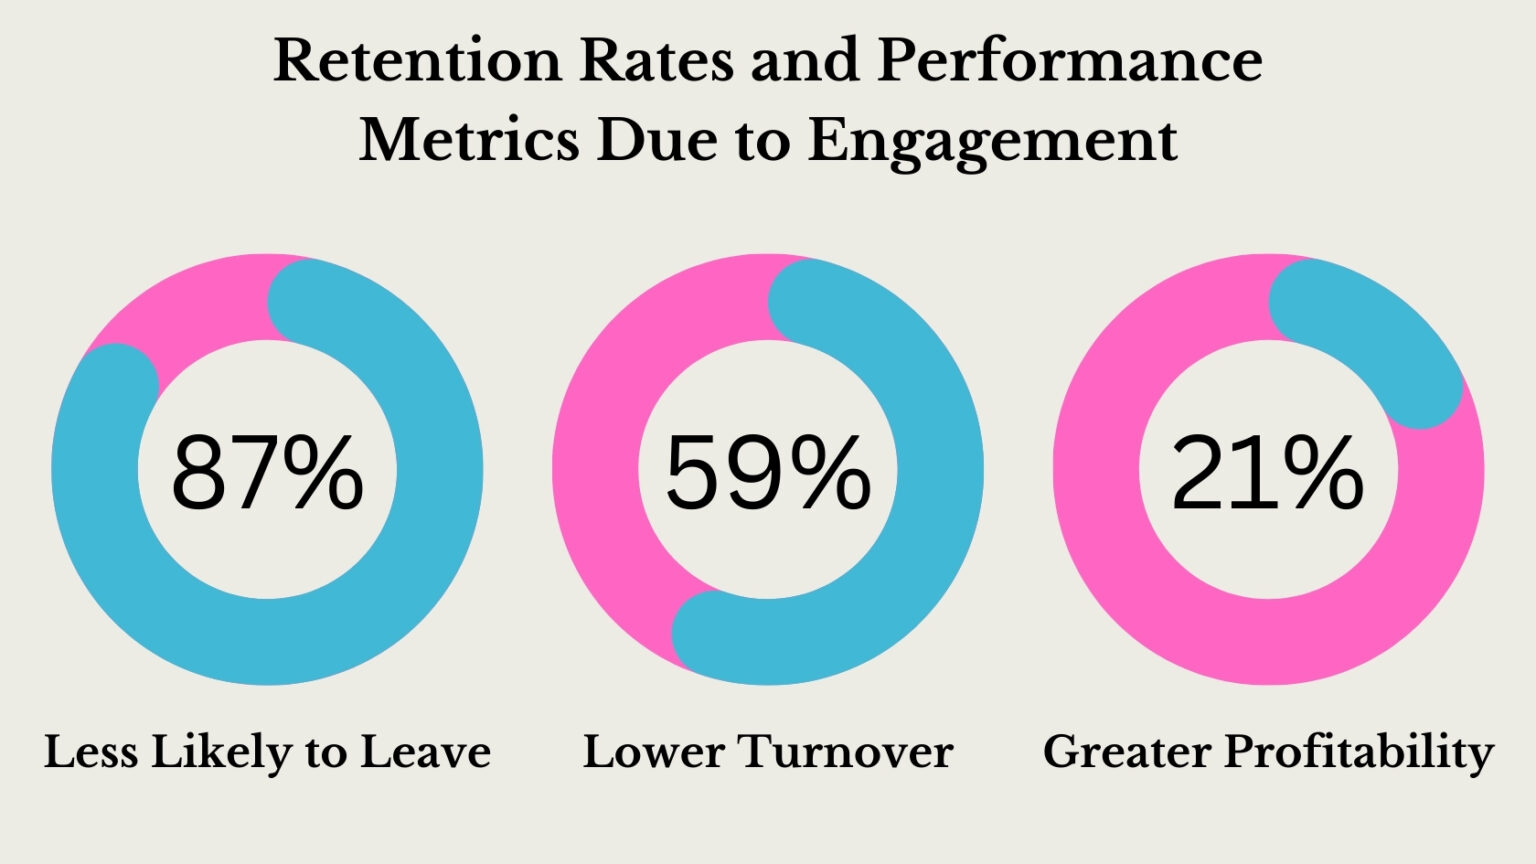
- Highly committed employees are 20% more productive and 87% less likely to quit their jobs. Commitment drives loyalty and significantly higher output.
- Organizations using high‑involvement management practices outperform peers by 47% to 200%.
- Firms with high engagement increase sales per square foot by 10% and operating income by 36%.
- Employees who feel unrecognized are 31% more likely to voluntarily leave their employer. Recognition plays a huge role in retention and long-term satisfaction.
- Feedback cultures that prioritize appreciation reduce turnover by 25 to 34%. Positive reinforcement significantly steadies headcount.
- About 85% of employees report higher productivity when recognition is clear and timely. Appreciation drives motivation, performance, and discretionary effort.
- Organizations with strong engagement report 86% healthy peer relationships, compared to just 45% among disengaged groups.
- In culture‑focused firms, average turnover is 13.9%, versus 48.4% where culture is weak. Cultural investment yields retention and organizational stability.
- High‑performing companies are 21% more profitable when managers frequently coach and communicate.
Employee Perception and Experience
(Source: yomly.com)
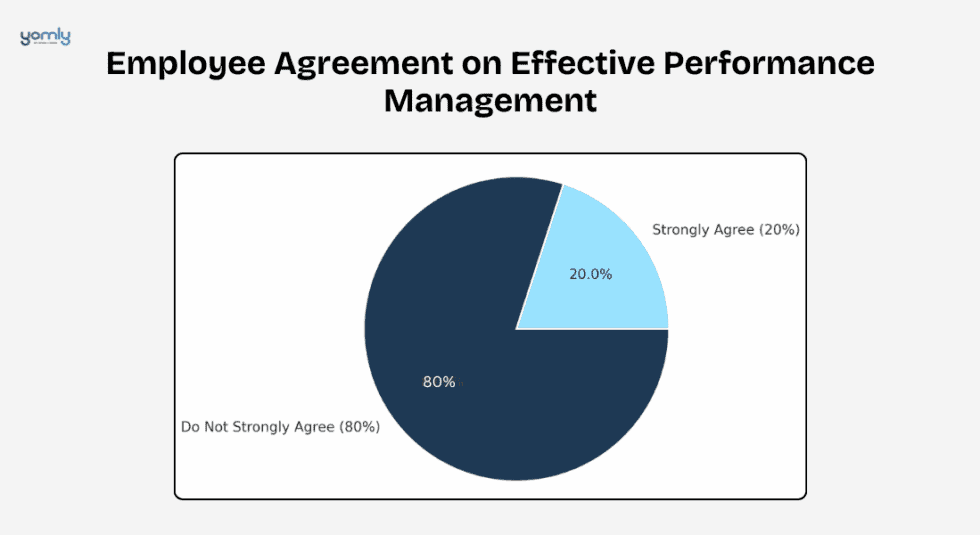
- Only 20% of employees strongly agree that performance management is effective, while 80% do not.
- About 15% feel the review process takes too much time but provides little value, while 22% believe it supports real improvement.
- Managers provide helpful feedback to only 17% of employees, and just 29% consider reviews fair.
- Only 32% say managers track performance fairly, while 35% believe their review system is outdated.
- Clear goals are missing for 41% of employees, and 45% feel their managers do not understand their daily work.
- 48% want more frequent check-ins, while 52% experience review-related stress.
- 58% prefer continuous feedback over yearly reviews, and 63% say reviews do not reflect their real work.
- The review process feels too time-consuming for 68%, while 72% want reviews to focus more on strengths.
Manager Behavior and Impact
- Only 13% of managers feel confident about managing team performance, while 24% lack proper review training.
- 26% struggle to give clear feedback, and 36% avoid difficult performance discussions.
- Time limits make regular check-ins difficult for 38% of managers, while review work takes key-task time from 42%.
(Source: yomly.com)
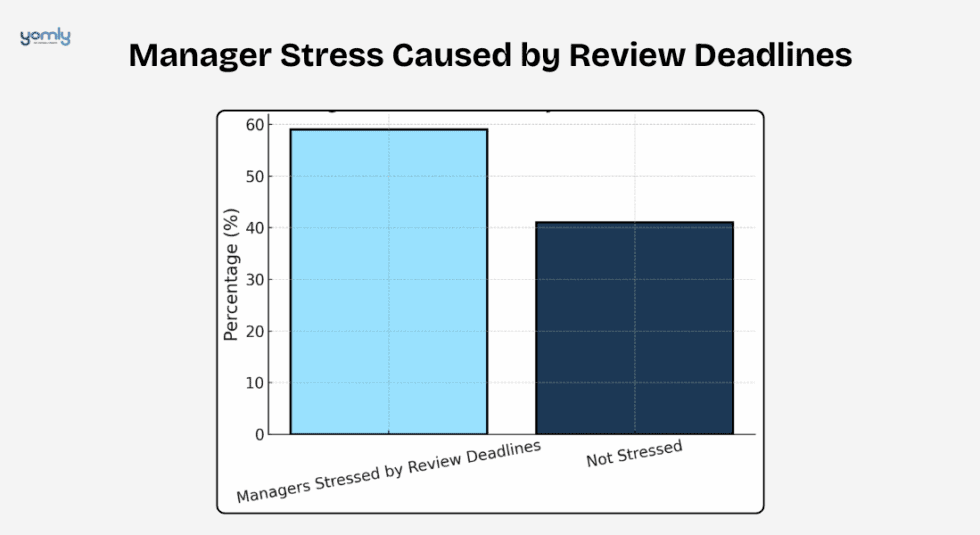
- 47% say better performance tools are needed, and 59% feel stressed by review deadlines.
- Outdated systems frustrate 61% of managers.
Goal Setting and Alignment
- A report published by Yomly suggested that only 11% of companies changed their goal-setting process to improve clarity.
- Just 21% of employees report having aligned goals, while 27% of organizations use quarterly goal cycles.
- Frequent goal changes confuse 33% of employees, and 39% find their goals difficult to understand.
- 44% of managers see inconsistent goal systems, while 56% of companies use OKRs or similar frameworks.
Feedback Frequency and Quality
- 14% of companies simplified their rating systems, while 19% use monthly feedback cycles.
- Weekly feedback reaches 23% of employees, but annual feedback still affects 31%.
- 37% of employees prefer coaching-style discussions.
- After shifting to remote work, 54% of companies increased the frequency of feedback.
- Continuous feedback supports performance in 67% of high-performing teams.
Employee Performance Management Software Market
(Source: grandviewresearch.com)
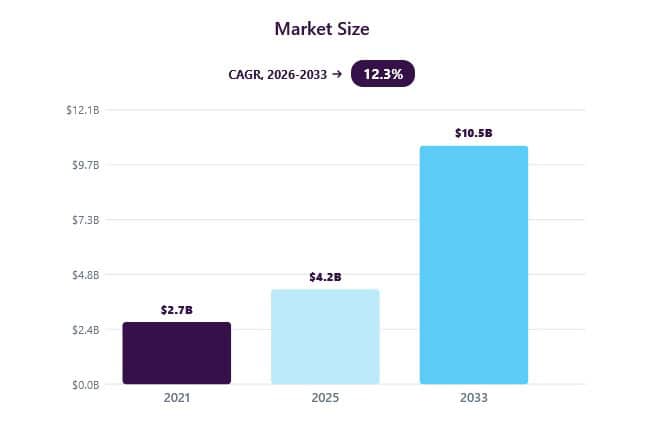
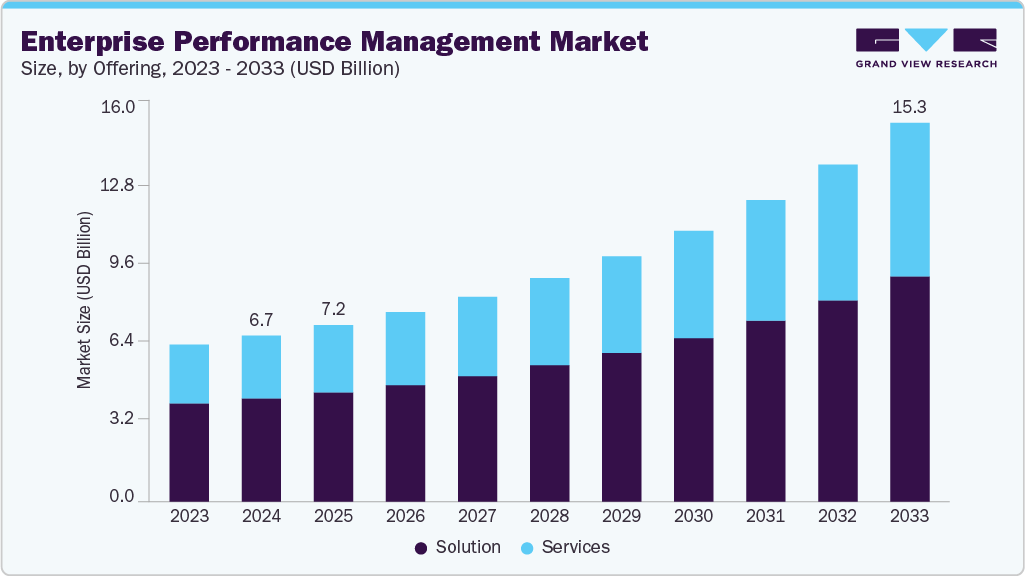
- The global employee performance-management software market is valued at USD 4.7 billion in 2026.
- The market is projected to reach USD 10.5 billion by 2033.
- The market is expected to grow at a CAGR of 12.3% from 2026 to 2033.
- Asia-Pacific is forecast to grow faster, with a 13.9% CAGR from 2026 to 2033, supporting continued digital HR adoption in India and other markets.
- Software accounted for 79.2% of the market in the 2025 baseline.
- North America held the largest regional share at 38% in the 2025 baseline.
Performance Management Statistics in Technology Adoption
- 91.6% of organizations have a formal performance-management process, while 91.1% include goal setting as a core function, according to talentstrategygroup.com.
- Technology is required for documenting goals in 80.7% of organizations, optional in 16.7%, and unavailable in 2.7%.
- 75.7% use a single enterprise-wide process, and 76.0% use structured goal cascading to connect individual and company goals.
- Performance calibration meetings are used by 84.7% of organizations, while 93.6% have a formal performance-review component.
- Rating-based reviews remain common at 92.4%. Review frequency is once a year for 56.3%, twice a year for 36.1%, and more than twice a year for 7.6%.
- Feedback documentation is required for all formal feedback in 13.6% of cases, for some conversations in 20.1%, and is not required in 66.2% of cases.
- More than 50% of companies still use spreadsheets as their primary performance-management system.
In Artificial Intelligence
- For goal setting, 48.3% report no AI use, while only 3.3% say AI is nearly fully embedded.
- For feedback and coaching, 49.3% report no AI use, compared with just 2.0% with near-full AI adoption.
- 69.2% do not use AI for formal performance reviews, while 88.7% do not use it for compensation decisions.
- HR AI adoption shows only 0–6 percentage-point increases across domains, suggesting gradual progress.
- More than 50% of workers receive feedback only once a year or not at all, leaving room for AI-supported continuous feedback.
Leadership and Coaching Impact in Performance Management Statistics
(Source: clemmergroup.com)
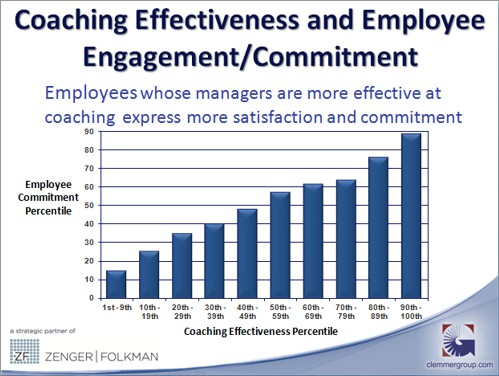
- Leadership training programs boost business performance by 25% while increasing overall job performance by 20%, providing direct ROI in team output.
- Participants also saw a 28% rise in leadership behaviors and an 8% increase in direct report results.
- Executive coaching is now the third most sought-after service among business students, strengthening leadership capabilities across sectors. It’s enhancing reflection, communication skills, and job performance among upcoming leaders in global firms.
- The global coaching market is currently valued at $6.25 billion, projected to reach $7.30 billion by 2025, with 145,500 active coaches expected to rise to 167,300 by next year.
- Sustained 17% CAGR (2019 to 22) and a 13.9% growth outlook through 2034 confirm long-term demand.
- A study combining GenAI with traditional coaching found that AI tools are mainly used for administrative support and research, with coaches emphasizing the importance of AI literacy and ethical use.
- AI-driven “task-time” coaching systems like Socratic have demonstrated measurable performance gains in real-time teamwork scenarios, validating technology-aided interventions.
- Public sector managers using executive coaching saw an 88% boost in productivity, highlighting strong returns even outside private sector contexts.
- Only 44% of managers have received formal training, and trust in managers declined from 46% to 29% between 2022 to 24, indicating an urgent need for coaching and development.
- Companies with strong leadership development report 25% stronger business results, showing a correlation between internal capability building and organizational success.
- New research shows coaching-centric companies enjoy 22% higher employee engagement; their teams are 18% more engaged, with 12% more productivity, plus turnover falls by 28%.
- Shared leadership models, where decision-making is distributed, have proven to positively predict team effectiveness and confidence, outperforming traditional hierarchical leadership.
360-Degree Feedback: Key Performance Management Metrics
- According to People Managing People, organizations using multi-rater feedback report a 10% improvement in overall performance.
- More than 85% of Fortune 500 companies use 360-degree feedback for leadership development, showing strong enterprise adoption.
- A report published by PeopleGoal, a 360-degree review typically works best with 6-10 raters, including managers, peers, direct reports, and the employee.
- An alternative survey design uses 25- 35 questions and typically remains open for around 2 weeks.
- After reviewing the results, employees should focus on 1-3 development goals to turn feedback into practical improvement.
- Organizations should include at least 2-3 peers and select raters who have worked with the employee for 6+ months.
- Surveys should contain no more than 30-40 items and focus on 8-10 key competencies to reduce fatigue, as per Qualtrics.
Recognition and Rewards Metrics in Performance Management Statistics
- Employees whose managers consistently acknowledge them for good work are 5× more likely to stay with the company.
- Recognition programs lower voluntary turnover rates by 31%, improving long‑term workforce stability.
- Manager-driven recognition increases employee engagement by 43%, creating momentum for performance.
- Companies that prioritize recognition report a 14 to 21% boost in productivity, a clear ROI.
- From individual contributors to teams, recognized work spurs creativity and focus. Some studies even show recognition yields gains of over 21% in efficiency.
- Fair recognition makes employees 4× more likely to feel engaged, far beyond monetary rewards alone.
- Employees recognized at least monthly are 2× more likely to feel productive and committed. Regular acknowledgment reinforces performance behaviors and sustains momentum.
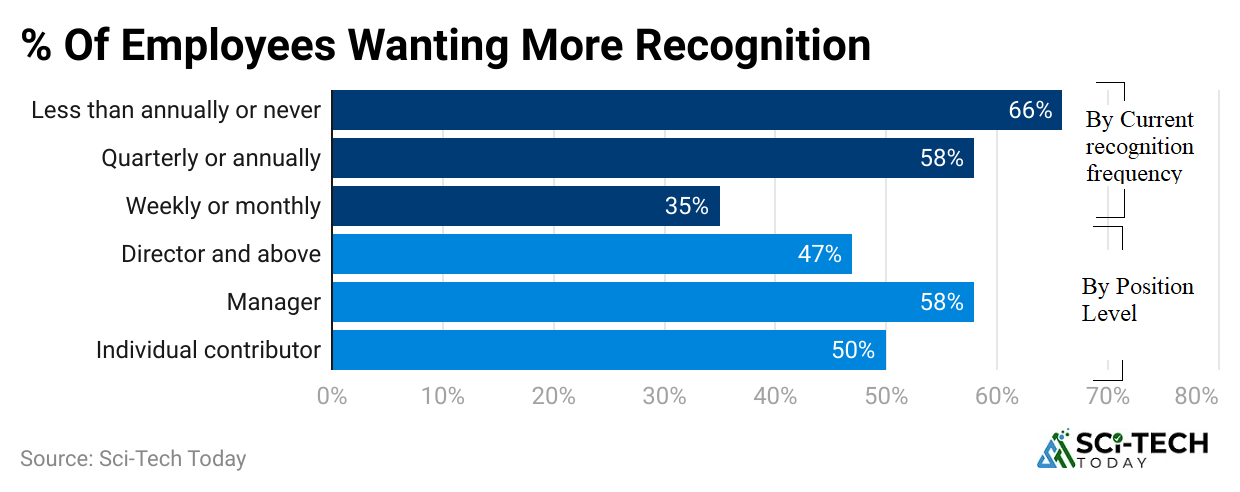
- Just 40% of employees say they receive consistent recognition, indicating a large gap. Infrequent or uneven praise undermines motivation and trust in leadership.
- 50% of employees cite a lack of appreciation as a key reason for quitting their jobs. Even competitive salaries can’t compensate for a failed emotional connection. Recognition emerges as a core driver of retention and satisfaction.
- Organizations with recognition programs see 27% lower absenteeism and reduced shrinkage. Appreciated employees take fewer sick days and are more careful in their roles. These improvements benefit workplace well‑being and bottom‑line productivity.
- Employees who receive strong recognition are 33% more likely to be proactive and innovative. Feeling appreciated fosters initiative and creative problem-solving. Organizations benefit from more ideas and higher adaptability.
Key Diversity, Equity, and Inclusion Statistics
- 50% of U.S. workers say DEI improves their work experience, down from 57% in 2024 to 50% in 2025, based on a report published by PR Newswire
- DEI is important to 77% of U.S. respondents, 70% of Asia-based respondents, and 67% of Europe-based respondents, while 63% of U.S. workers would avoid or hesitate to join employers that do not take DEI seriously.
- More resources are reported by 71% of executives, 57% of managers, and 41% of employees, showing a 30-point perception gap.
- Positive DEI impact is reported by 62% of executives, 50% of managers, and 48% of employees, while 66% of executives, 57% of managers, and workers see better business outcomes.
- The US share saying DEI efforts are “about right” fell from 58% to 47%, while the share saying they are “too much” rose from 21% to 31%.
- 21% of leaders lack commitment to diversity, and 17% lack commitment to inclusion.
- D&I mentoring benefits gender diversity at 63% of participating companies, as per 5app
- Promotion clarity is 83% for men versus 71% for women and non-binary, transgender, and gender-nonconforming employees, a 12-percentage-point gap.
- According to HR Stacks, for every 100 men promoted, 87 women and 73 women of color are promoted. Women hold 63% of entry-level roles but only 29% of C-suite roles.
- Diverse leadership generates 45% of revenue from innovation versus 26% for less-diverse teams, while top-quartile ethnic diversity is linked to 39% greater financial outperformance.
- Employees experiencing bias are 1.4× more likely to consider leaving, and 33% of LGBTQ+ employees would leave for a more inclusive workplace.
- S&P 500 leadership gender disclosure fell to 62.2% in 2026 from 86.0% in 2024, while race/ethnicity disclosure fell to 47.6%.
- Among 1,449 CEI-rated employers, 1,208 provide at least 3 LGBTQ+ diversity practices, while 1,416 have an LGBTQ+-inclusive ERG or diversity council.
Global Employee Well-Being, Burnout, and Workplace Stress
- In 2025, only 20% of employees globally were engaged, while 64% were not engaged and 16% were actively disengaged. Gallup estimates that low engagement costs the global economy USD 10 trillion in lost productivity.
- Globally, 34% of employees were thriving, 56% were struggling, and 9% were suffering.
- Managers reported 40% thriving, compared with 32% of individual contributors. Both hybrid and remote-capable employees reported a 45% thriving rate.
- Thriving was highest in Latin America and the Caribbean at 56%, followed by Australia and New Zealand at 55%, the US and Canada at 51%, and Europe at 49%. South Asia recorded the lowest rate at 16%.
- In 2025, 40% of employees experienced significant daily stress, while 23% felt sadness, 22% felt anger, and 22% experienced loneliness.
- Managers reported 45% daily stress, compared with 39% among individual contributors. Both hybrid and on-site remote-capable employees reported 46% stress.
- In February and May 2026, 27% of US employees reported feeling burned out very often or always.
- Employees who were engaged but not thriving had a 61% higher likelihood of frequent burnout, 48% higher daily stress, 66% higher daily worry, and 2× the rate of daily sadness and anger.
- Mercer found that only 44% of employees were thriving at work in 2026, down from 66% in 2024. Meanwhile, concern about AI-related job loss rose from 28% to 40%.
- 62% of employees said leaders underestimate AI’s emotional impact, while only 19% of HR leaders include these effects in digital implementation strategies.
- Frontline workers represent nearly 80% of the global workforce, and 76% reported burnout in 2025. O.C. Tanner found that supportive, high-expectation workplaces can reduce burnout by 88%.
- In IMEA, 40% reported burnout, with rates of 44% in India, 35% in Saudi Arabia, 35% in South Africa, and 38% in the UAE. Burnout odds were 93% lower when employees felt their supervisor was approachable and willing to help.
(Reference: prnewswire.com)
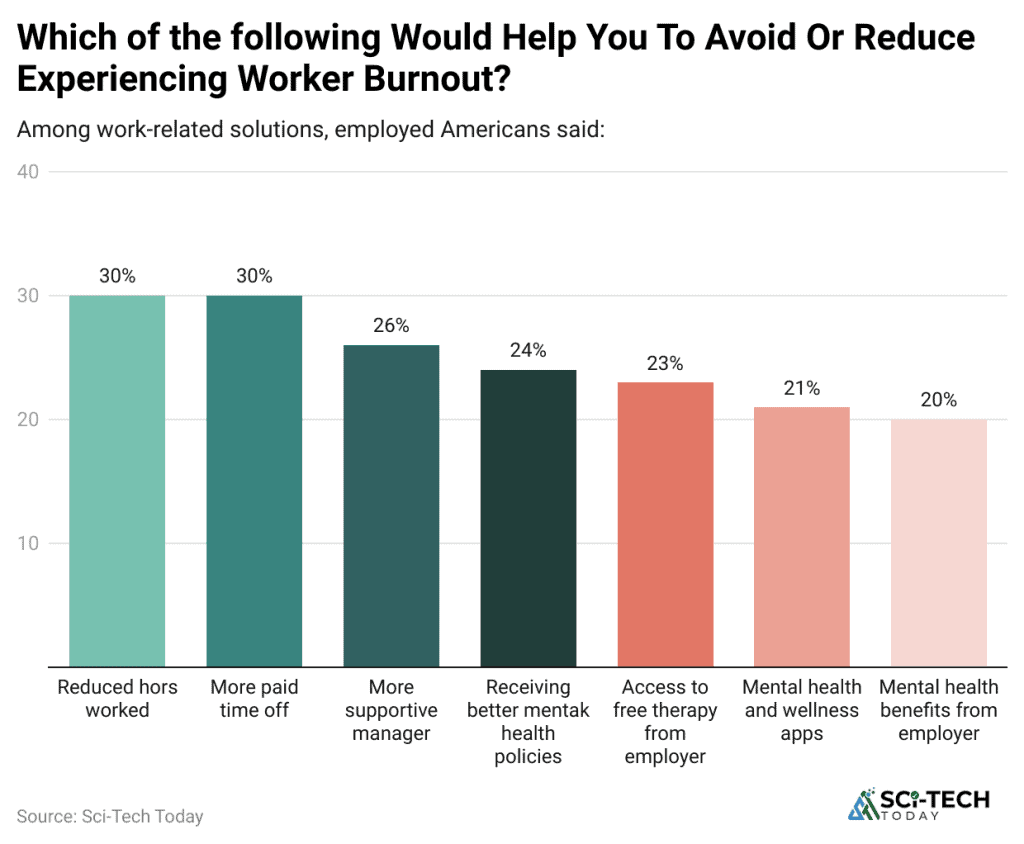
- In the United States, 30% of workers said reduced working hours and more paid time off would help prevent burnout.
- Better manager support was selected by 26%, while 24% preferred stronger mental-health policies at work.
- Access to free employer therapy was cited by 23%, mental-health apps by 21%, and employer mental-health benefits by 20%.
Remote and Hybrid Team Performance Management Statistics
(Source: selectsoftwarereviews.com)
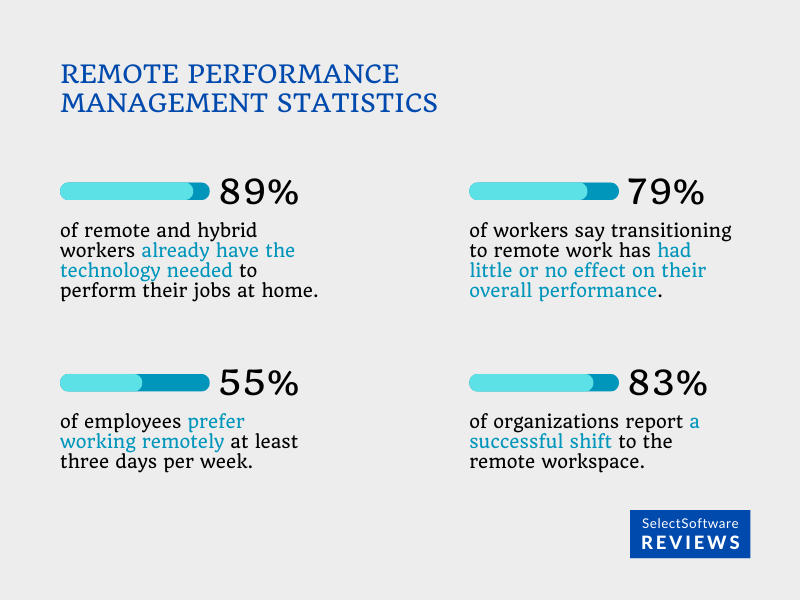
- Remote work boosted employee productivity by 13%, as uninterrupted focus and flexibility led to better output.
- Hybrid teams that balance remote and in-office work consistently show 9% higher engagement than all-on-site teams.
- Organizations that support hybrid models experience 26% higher employee retention, showing performance benefits beyond cost savings.
- In globally remote-enabled companies, 75% of employees report increased work-life balance, directly supporting job satisfaction.
- Productivity spikes when workers can tailor environments and schedules to personal needs. These teams also report 15% fewer unscheduled absences, reinforcing resilience and reliability.
- Hybrid team members receive feedback 34% more frequently than their fully remote or in-office counterparts.
- Increased touchpoints stem from required check-ins and workflow management tools. This contributes to stronger alignment, clarity, and performance consistency.
- Managers of remote/hybrid teams spend about 30% more time on coaching and development, driving improved outcomes.
- Intentional development time offsets issues stemming from informal interaction loss. Better coaching leads to stronger retention and performance in distributed environments.
- Tech-centric remote firms report a 22% uplift in innovation outcomes, attributed to varied perspectives and asynchronous collaboration.
- Innovation gains result in tangible performance delivered via diverse communication channels.
- Hybrid teams with robust tools (like Slack, Microsoft Teams) have 1.8× greater collaboration frequency than traditional teams.
- Remote teams that use performance dashboards report 24% fewer alignment issues during quarterly reviews.
- Distributed teams with structured performance metrics are 33% more likely to meet or exceed quarterly revenue targets.
- In hybrid companies, peer-to-peer recognition is 45% more frequent than in traditional setups.
- Employers offering hybrid flexibility see a 29% increase in internal promotions over two years.
Onboarding and Succession Planning Statistics in Performance Management
(Source: zinghr.com)
- Highly effective onboarding programs improve new-hire retention by 82% and productivity by over 70% within the first year.
- Structured approaches like mentorship, check-ins, and clear goals accelerate employee readiness. This early momentum fuels long-term performance through clarity and cultural assimilation.
- A strong onboarding experience delivers 62% higher new-hire performance, measured six months post-hire.
- Comprehensive orientation and tailored training boost early confidence and alignment with performance expectations. This early success significantly reduces time-to-competence.
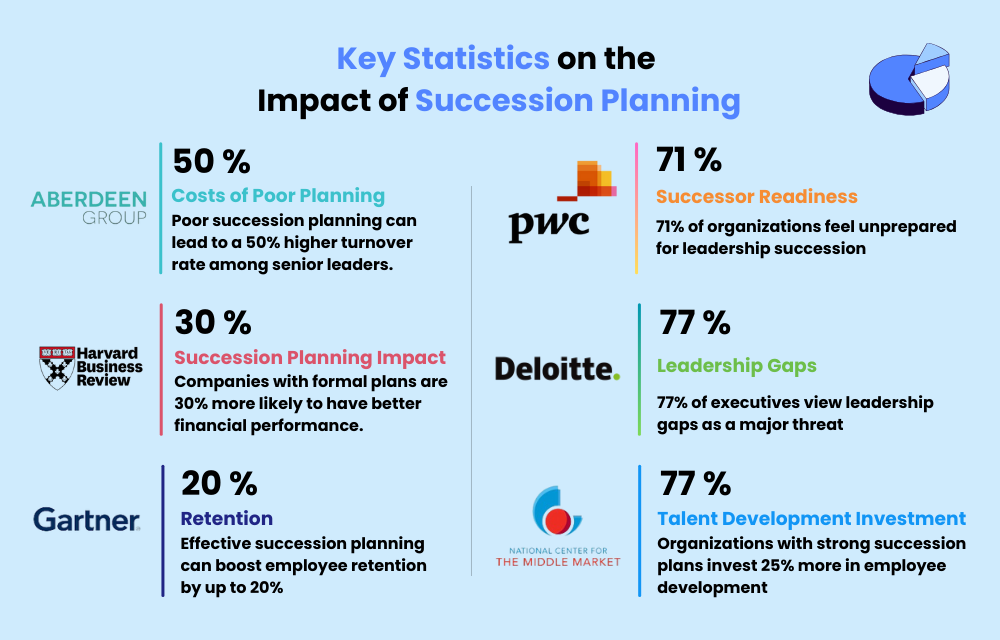
- Organizations with documented succession plans are 1.9× more likely to have strong internal bench strength for critical roles.
- Goal clarity, performance metrics, and readiness frameworks support seamless role transitions and continuity. Internal candidates often outperform external hires due to institutional understanding.
- Companies with effective succession strategies reported 32% higher readiness for unplanned leadership changes.
- Planning ensures skills alignment, coverage, and ongoing leadership development. Preparedness reduces disruption and improves performance under uncertainty.
- Succession planning that includes performance data correlates with 24% faster promotion rates.
- Objective metrics identify high-potential talent earlier and more accurately. This clarity supports career development and internal mobility.
- Organizations that integrate onboarding data into performance systems report 18% faster time-to-productivity overall.
- Visibility into completion rates, goal progress, and skill acquisition drives early impact. Momentum builds quickly as performance elements align with culture and role demands.
- New hires with onboarding mentors are 23% more likely to remain beyond their first year. Mentorship complements formal onboarding, supporting social integration and performance.
- Firms actively promoting internal succession see 41% lower recruiter costs due to reduced external hiring.
- Companies tying onboarding metrics to long-term performance see 30% better retention of high performers.
- When succession candidates leverage goal-setting and feedback tools, 45% advance to leadership roles in under two years.
Performance Improvement Plans (PIP) and Underperformance Stats
(Source: fastercapital.com)
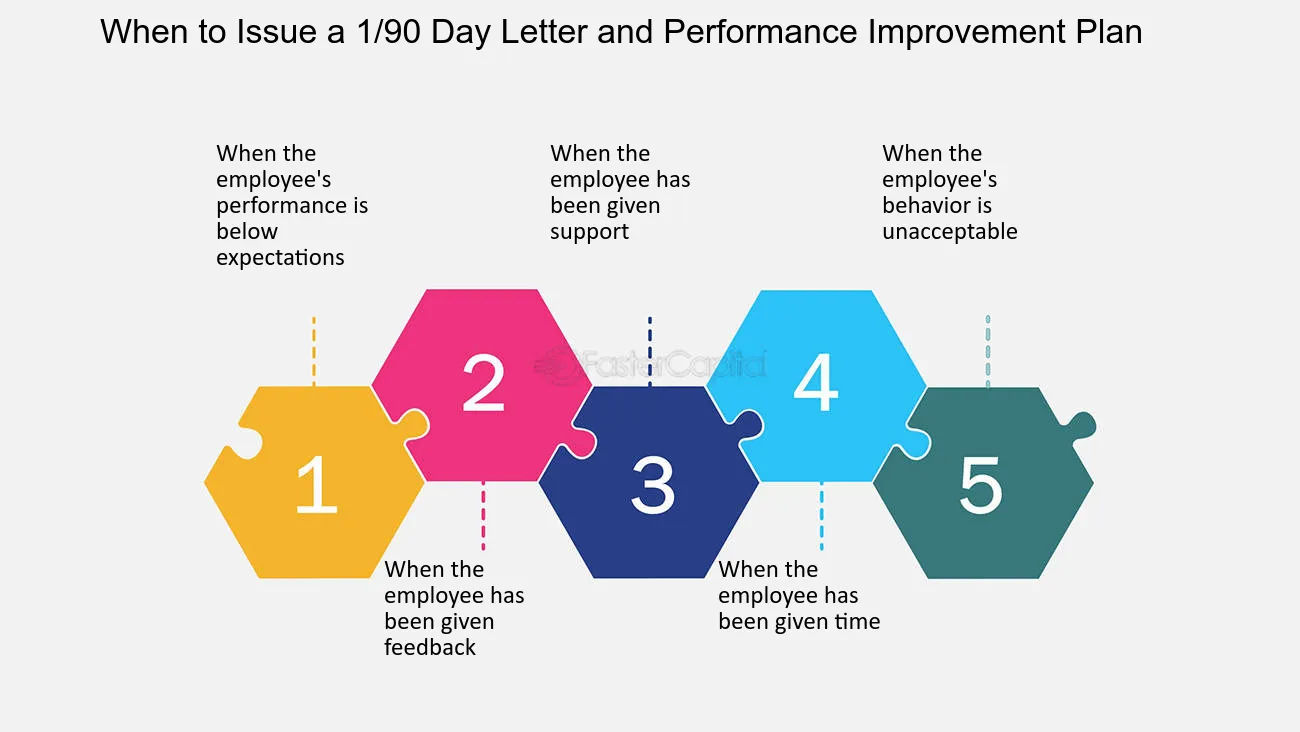
- Around 28% of companies use Performance Improvement Plans (PIPs) as a formal intervention for underperformance issues.
- PIPs set structured timelines, expectations, and metrics for improvement. Effective PIPs guide struggling employees to regain performance or exit gracefully.
- Only 38% of employees complete PIPs and meet improvement goals within three to six months. Lack of support or unclear expectations often leads to incomplete outcomes.
- 62% of PIP participants do not meet the outlined criteria and may transition out of the organization.
- Underperformers receiving consistent coaching show 23% greater improvement than those left on traditional PIPs.
- Formal PIP systems reduce turnover drag by 15 to 20%, compared to informal underperformance tracking.
- Teams with cumulative underperformance reviews see 12% higher rating accuracy in evaluations.
- If poorly managed, 45% of employees rate PIPs as demotivating or discipline-driven. The balance between accountability and support must be patient-focused.
- PIP-driven exits cost companies 25% less in severance when compared to unstructured departures.
- Using PIP participation as performance data contributes to 22% better hiring calibration over time.
- PIP cycles paired with frequent manager check-ins improve success rates by 30%. Ongoing feedback ensures real-time corrective actions and adaptive support.
Learning and Development (L&D) Effectiveness Statistics
- Companies investing $1,500+ per employee annually in training see 24% higher profit margins, driven by improved skills.
- L&D investment ties directly to competitive advantage and performance capability. Ongoing training closes skill gaps faster, accelerating goal achievement.
- High-performing firms spend 30% more on learning and development than average, correlating with growth outcomes. Greater investment indicates prioritization of upskilling for future readiness.
- Access to on-demand learning improves performance: employees report 44% faster skill uptake versus scheduled training.
- Training programs integrated with employee performance dashboards boost proficiency by 18%.
- Peer-led learning increases engagement with development by 59%, tapping into internal social learning.
- Only 40% of companies consider their development programs highly effective, suggesting room for refinement.
- Skills-based promotion pipelines tied to learning histories increase internal fill rates by 48%.
- Employee growth translates into succession-ready talent benches. L&D underpins performance-based career advancement.
- Microlearning modules reduce knowledge retention loss by 50%, compared to traditional formats.
- Learning with clear application objectives mediates a 30% higher transfer of learning into practice.
- Organizations with strong L&D cultures outperform others by 2.3× in key performance metrics. Strategic alignment between learning and outcomes drives measurable results.
Future Trends and Predictions for Performance Management Statistics
(Source: grandviewresearch.com)
- By 2028, 48% of companies are projected to adopt continuous performance models over annual systems.
- AI adoption in performance management is expected to surpass 75% by 2030, offering unbiased insights and predictive analytics.
- Augmented Reality (AR)/Virtual Reality (VR) tools are anticipated in 15% of companies by 2027 for role simulation and skills testing.
- The usage of sentiment analytics in performance software will grow by 48% by 2026, enabling mood-based feedback loops.
- Blockchain-enabled credentialing is expected to be implemented by 22% of firms by 2028, ensuring transparency in achievement records. Immutable training and certification proofs build trust in promotions and mobility.
- Gamification of goals and feedback through apps will be used by 35% of HR teams by 2026 to boost engagement and motivation.
- Predictive performance systems will be used by 60% of enterprises by 2029 to anticipate skill gaps, development needs, and retention risks. Early identification leads to proactive coaching and better talent pipelines.
- Cross-functional peer review platforms are projected to be adopted by 44% of companies by 2027. Transparency in feedback fosters collective performance accountability.
- Use of mobile-first performance tools will rise to 70% by 2027, supporting real-time on-the-go feedback and check‑ins.
- By 2030, 80% of companies will tie ESG (Environmental, Social, Governance) metrics into performance reviews.
Closing Remarks
Performance management helps employees understand their goals and how their work supports the company. Regular feedback, clear expectations, and recognition can improve both performance and motivation. It also helps managers identify problems early and support employees in improving their skills.
Overall, a simple and effective performance management system creates a more productive workplace, helps employees grow, and allows businesses to achieve better results and reach their long-term goals.
FAQ
The main components include goal setting, performance tracking, feedback, reviews, employee development, and recognition.
Performance reviews should be conducted regularly, ideally quarterly, with ongoing feedback throughout the year.
Managers can improve employee performance by setting clear goals, giving regular feedback, recognizing achievements, and offering support.

Sources


