
Expeditors reported Q1 2026 EPS of $1.71 on revenue of $2.78 billion, both growing solidly year over year and handily topping consensus EPS expectations of around $1.33 per share. Shares traded in a wide intraday range around the release date, with investors digesting stronger customs and airfreight trends against continued ocean freight weakness and a logistics backdrop that remains volatile.
About Expeditors
Expeditors International of Washington, Inc. is a global third party logistics provider listed on the NYSE under the ticker EXPD. The company operates a non asset based model, coordinating air and ocean freight forwarding, customs brokerage, distribution, and a range of other supply chain solutions for customers across technology, industrial, retail, and other sectors.
Expeditors is headquartered in Bellevue, Washington, and runs a worldwide network of 171 district offices plus numerous branches across six continents, supported by an integrated information management system. As of March 31, 2026, the firm employed 20,361 full time equivalents globally, up from 19,203 a year earlier. Based on recent trading around 139 to 146 dollars per share and an equity value near 19 to 20 billion dollars, Expeditors currently trades on a mid 20s P E multiple with a dividend yield of roughly 1.0%, reflecting steady profitability and balance sheet strength.
Top Financial Highlights
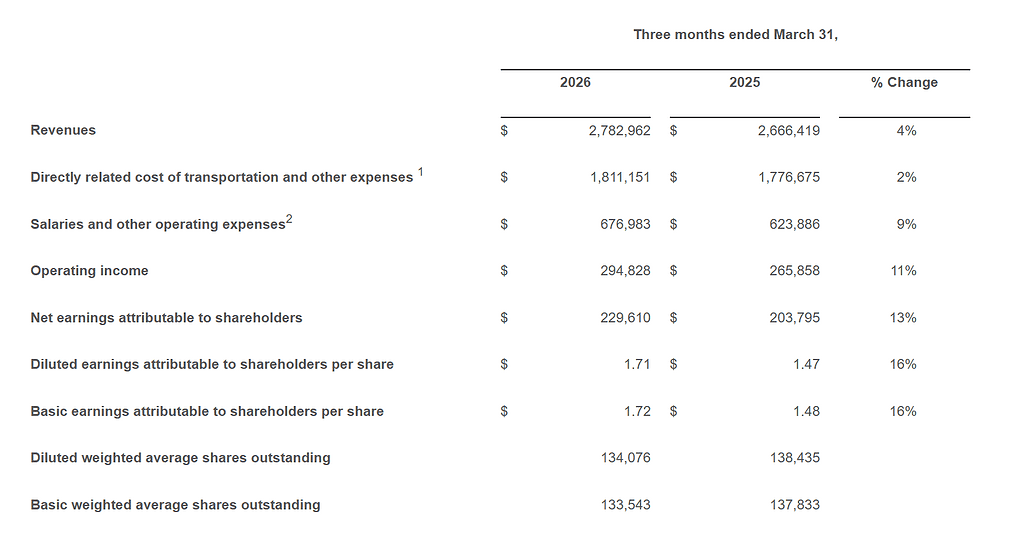
- Q1 2026 total revenues rose 4% year over year to $2.78 billion, compared with $2.67 billion in Q1 2025.
- Net earnings attributable to shareholders increased 13% to $230 million, up from $204 million a year earlier.
- Diluted EPS grew 16% to $1.71 versus $1.47 in the prior year quarter, significantly ahead of pre release analyst expectations around $1.32 to $1.33.
- Operating income improved 11% to $295 million, reflecting higher gross profit and disciplined cost management.
- Total operating expenses increased to $2.49 billion, up about 4%, with salaries and other operating expenses up 9%, but transportation related costs rising only 2%.
- Airfreight services revenue climbed to $1.03 billion from $902 million, with tonnage up 5% and higher per kilo profitability supporting stronger gross margins.
- Ocean freight and ocean services revenue declined to $599 million from $782 million, driven by lower pricing and volume, particularly on exports from Asia amid an oversupplied ocean market.
- Customs brokerage and other services revenue advanced to $1.15 billion from $983 million, with customs, Transcon, distribution, and order management all delivering double digit revenue growth.
- Directly related cost of transportation and other expenses totaled $1.81 billion, up 2%, helping expand operating margin as revenue grew faster than freight costs.
- Cash provided by operating activities reached $309 million, slightly below $343 million in Q1 2025 but still robust relative to net income and capex needs.
- Cash and cash equivalents stood at $1.32 billion at March 31, 2026, roughly flat versus year end 2025 and prior year Q1 levels.
- The company repurchased 2.0 million shares in the quarter for $288 million at an average price of $145.90 per share, reducing diluted weighted average shares outstanding to 134.1 million from 138.4 million a year ago.
- Management highlighted that operating expenses excluding transportation related costs rose less than one percent sequentially versus Q4 2025, supporting a return to the firm’s historical 30% operating efficiency target.
- While formal numeric guidance for Q2 2026 was not provided, leadership flagged a strong pipeline of new business and expected continued robust demand for customs brokerage services amid elevated tariff complexity and shifting trade flows.
Beat or Miss?
| Metric | Reported Q1 2026 | Estimated / Expected | Difference / Analysis |
| Revenue | $2.78 billion | ~$2.70 to $2.73 billion consensus (pre release context) | Modest top line beat, aided by customs brokerage growth offsetting ocean softness. |
| Diluted EPS | $1.71 | $1.32–$1.33 consensus | Clear earnings beat, with EPS roughly 29% above expectations, helped by margins and buybacks. |
| Net Earnings Attributable to Shareholders | $230 million | N A | Strong double digit profit growth despite continued disruption in ocean markets. |
| Operating Income | $295 million | N A | Operating profit up 11% year over year as revenue growth outpaced cost increases. |
What Leadership Is Saying?
“During a period marked by significant disruption in the final month of the quarter, we continued to demonstrate our ability to bring solutions to our customers. This quarter also demonstrates the resilience of our non asset based model, as we grew revenues and margins in most of our products and geographies. We relied heavily on the hard work of our people, especially those close to the conflict in the Middle East. We were well prepared for disruption and adapted quickly. As soon as hostilities began, we developed strategies and solutions for our customers to keep freight moving out of and around impacted areas.” – Daniel R. Wall, President and Chief Executive Officer
“With headcount sequentially flat versus the prior quarter, coupled with our revenue and margin growth, we meaningfully increased our productivity from the fourth quarter of 2025 as our operating efficiency achieved our 30 percent historical target. In 2025, we made strategic investments in headcount aimed at higher growth opportunities, particularly in customs brokerage, as well as essential investments in technology, including artificial intelligence. We are starting to achieve benefits from these investments, which are helping to drive our productivity gains. For a second sequential quarter, operating expenses, excluding transportation related costs, increased less than one percent compared to the fourth quarter of 2025.” – David A. Hackett, Senior Vice President and Chief Financial Officer
Historical Performance
Year over year company comparison
| Category | Q1 2026 | Q1 2025 | Change (%) |
| Revenue | $2,782.9 Million | $2,666.4 Million | 4% |
| Net Earnings | $229.6 Million | $203.8 Million | 13% |
| Operating Income | $294.8 Million | $265.9 Million | 11% |
| Diluted EPS | $1.71 | $1.47 | 16% |
| Salaries and OpEx | $677.0 Million | $623.9 Million | 9% |
| Operating Cash Flow | $309.2 Million | $342.6 Million | (−10% approx.) |
YoY Segment Mix Detail
| Segment | Q1 2026 Revenue | Q1 2025 Revenue | Change (%) |
| Airfreight services | $1,030.9 Million | $901.8 Million | ≈14% increase |
| Ocean freight and ocean services | $598.9 Million | $781.7 Million | ≈24% decline |
| Customs brokerage and other | $1,153.2 Million | $983.0 Million | ≈17% increase |
How the Market Reacted?
The press release emphasizes a strong operational performance with EPS and net earnings growing at double digit rates despite an unpredictable freight environment and continued weakness in ocean shipping. Analysts had expected a much lower EPS figure near $1.33, so the sizable earnings beat, coupled with robust customs and airfreight growth and ongoing buybacks, is likely to be viewed as supportive for the stock.
The document does not specify same day share price movement, so after hours trading and subsequent sessions will determine whether investors focus more on the beat and improved productivity or on ongoing macro and ocean market risks flagged in the forward looking statements.
