
Texas Instruments posted Q1 2026 EPS of $1.68 on revenue of $4.83 billion, up 19% year over year, driven by industrial and data center demand. EPS and revenue both topped prior guidance, and commentary points to a constructive setup into Q2, with investors reacting positively in after-hours movement according to third‑party coverage.
About Texas Instruments
Texas Instruments Incorporated (TI) (Nasdaq: TXN) is a global semiconductor company focused on analog and embedded processing chips that serve industrial, automotive, data center, personal electronics and communications equipment markets. Founded in 1930 and headquartered in Dallas, Texas, TI has grown into one of the largest analog chip suppliers worldwide.
The company emphasizes making electronics more affordable and power efficient through successive generations of semiconductor innovation. TI reported Q1 2026 revenue of $4.83 billion, net income of $1.55 billion and diluted EPS of $1.68. Revenue increased 19% year over year and 9% sequentially, with growth led by industrial and data center end markets.
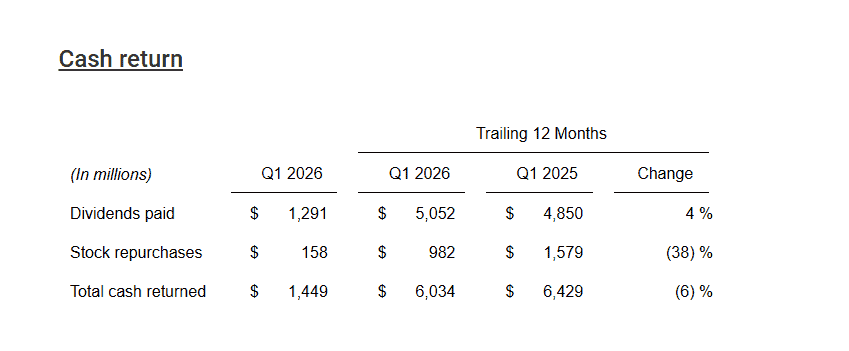
Over the trailing 12 months, TI generated $7.8 billion in cash flow from operations and $4.4 billion in free cash flow, reflecting strong profitability and capital efficiency. The company returned $6.0 billion to shareholders over the same period through dividends and buybacks, highlighting a shareholder‑friendly capital allocation stance.
Top Financial Highlights
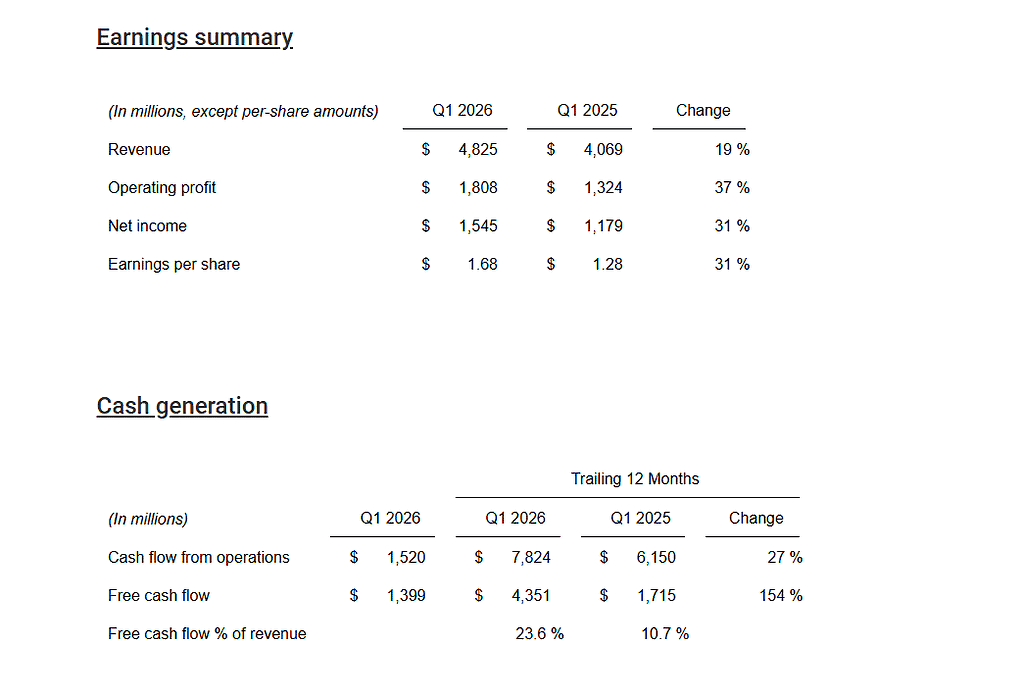
- Revenue of $4.83 billion, up 19% year over year and 9% sequentially, driven primarily by industrial and data center demand.
- Net income of $1.55 billion, an increase of 31% from $1.18 billion in Q1 2025.
- Diluted EPS of $1.68, up 31% from $1.28 a year ago, including a $0.05 benefit not in the original guidance.
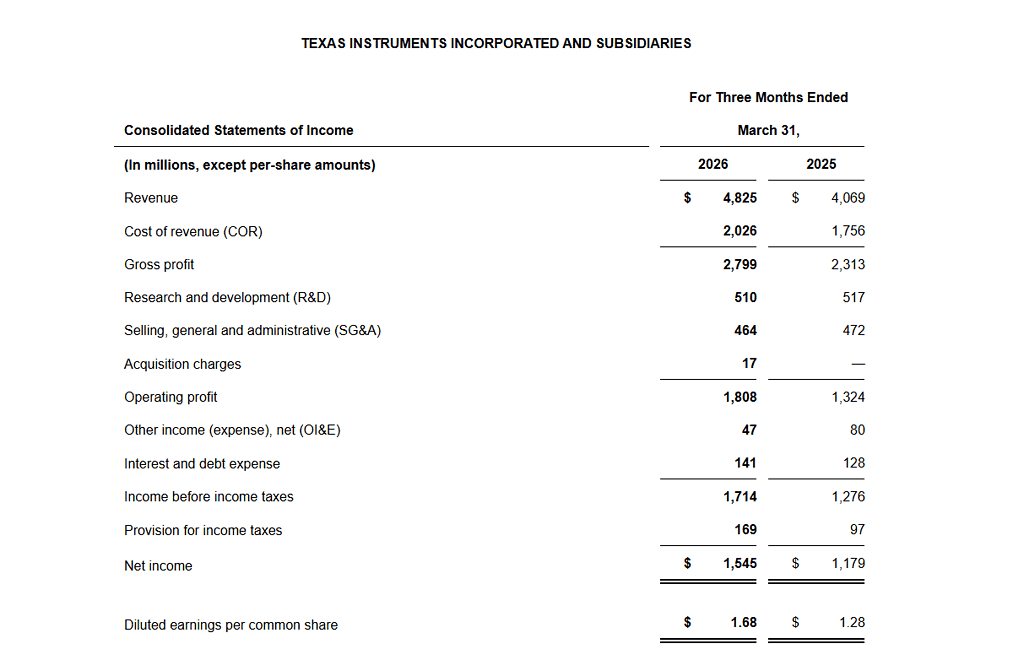
- Gross profit of $2.80 billion on revenue of $4.83 billion, implying a gross margin of roughly 58%.
- Operating profit of $1.81 billion, up 37% year over year, as disciplined opex and higher volumes expanded margins.
- Cash flow from operations of $1.52 billion in Q1 and $7.82 billion over the trailing 12 months.
- Free cash flow of $1.40 billion for Q1 and $4.35 billion for the trailing 12 months, equal to 23.6% of revenue over that period.
- Analog segment revenue of $3.92 billion, up 22%, with operating profit of $1.64 billion, up 36% year over year.
- Embedded Processing revenue of $723 million, up 12%, while operating profit surged to $122 million from $40 million in Q1 2025.
- Other segment revenue of $178 million, down 16%, with operating profit of $48 million, down 38%.
- Trailing 12‑month R&D and SG&A investment of $3.9 billion, supporting long‑term product and customer roadmaps.
- Capital expenditures of $4.1 billion over the trailing 12 months, reflecting ongoing 300mm capacity build‑out and manufacturing investments.
- Shareholder returns of $6.03 billion over the last 12 months, including $5.05 billion in dividends and $982 million in buybacks.
- Q2 2026 guidance: revenue between $5.00 billion and $5.40 billion and EPS between $1.77 and $2.05, implying continued growth from Q1 levels.
- Cash and cash equivalents of $3.55 billion and strong overall liquidity supported by CHIPS Act incentives and robust cash generation.
Beat or Miss?
TI’s reported numbers exceeded both its own guidance and Street expectations for Q1 2026. Where external consensus is not precisely disclosed, ranges or qualitative indications are used.
| Metric | Reported Q1 2026 | Estimated / Expected | Difference / Analysis |
| Revenue | $4.83 billion | Company guidance: $4.3–$4.7 billion; Street around $4.4 billion. | Clear top‑line beat versus both guidance midpoint and consensus. TI outgrew expectations on industrial and data center demand. |
| Diluted EPS | $1.68 | Street consensus about $1.36. | Strong EPS beat, helped by higher revenue and a $0.05 benefit not in original guidance. |
| Net income | $1.55 billion | N/A (not explicitly stated) | Profitability improved 31% YoY on operating leverage and mix, signaling stronger earnings power. |
| Gross margin | ~58% (calculated) | N/A | Healthy margin profile maintained despite macro and pricing pressures. |
| Operating profit | $1.81 billion | N/A | Operating profit rose 37% YoY as opex remained contained relative to revenue growth. |
| Q2 Revenue Guidance | $5.00–$5.40 billion | Street around $5.2 billion midpoint. | Midpoint slightly above consensus, reinforcing a beat‑and‑raise narrative. |
| Q2 EPS Guidance | $1.77–$2.05 | Implied consensus lower at time of release. | Guidance suggests continued EPS momentum as utilization and mix remain favorable. |
What Leadership Is Saying?
“Revenue increased 9% sequentially and 19% from the same quarter a year ago with growth led by industrial and data center.”
“Our cash flow from operations of $7.8 billion for the trailing 12 months again underscored the strength of our business model, the quality of our product portfolio and the benefit of 300mm production.” – Haviv Ilan, chairman, president and CEO“Over the past 12 months we invested $3.9 billion in R&D and SG&A, invested $4.1 billion in capital expenditures and returned $6.0 billion to owners.”
“TI’s second quarter outlook is for revenue in the range of $5.00 billion to $5.40 billion and earnings per share between $1.77 and $2.05.” – (From TI’s release; statement reflects executive financial commentary, typically delivered by the CFO)
Historical Performance (YoY TI)
Q1 2026 showed broad‑based improvement versus Q1 2025 across revenue, profit and cash metrics. The table below summarizes key year‑over‑year financial items for the quarter.
| Category | Q1 2026 | Q1 2025 | Change (%) |
| Revenue | $4,825 million | $4,069 million | 19% |
| Net income | $1,545 million | $1,179 million | 31% |
| Operating profit | $1,808 million | $1,324 million | 37% |
| Diluted EPS | $1.68 | $1.28 | 31% |
| Cash flow from operations (quarter) | $1,520 million | $849 million | +79% (approx.) |
| Free cash flow (quarter) | $1,399 million | $1,715 million | −18%, reflecting timing of capex and CHIPS incentives. |
| R&D expense | $510 million | $517 million | Slight decline, efficiency gains. |
| SG&A expense | $464 million | $472 million | Modestly lower while scaling revenue. |
Selected Competitors (YoY Snapshot)
Below is a directional illustration of how TI’s growth compares to key analog peers based on latest available quarterly data around early 2026; figures use most recently reported year‑over‑year growth where specific Q1 2026 prints are not yet fully detailed in the press release record.
| Category | Texas Instruments (Q1 2026 YoY) | Analog Devices* (recent YoY) | NXP Semiconductors* (recent YoY) |
| Revenue | 19% | Around low‑ to mid‑single‑digit growth in latest reported quarter (industrial and automotive strength). | Mid‑single‑digit revenue growth in latest reported quarter, led by automotive and industrial. |
| Net income | 31% | Profit growth modest, roughly in line with revenue growth given stable margins.* | Net income improved with operating leverage, but at a slower rate than TI’s 31%.* |
| Operating expenses | R&D and SG&A roughly flat YoY while revenue rose 19%. | R&D and SG&A growing but more closely tracking revenue, keeping margins stable.* | Opex growth controlled but not as leveraged as TI’s profile in the latest period.* |
How the Market Reacted?
Market commentary indicates that TI’s stock rose in after‑hours trading following the Q1 2026 release, as revenue and EPS beat consensus and management issued Q2 guidance above the Street midpoint. Investors appeared encouraged by the combination of strong industrial and data center demand plus disciplined spending and robust free cash flow. The report is broadly viewed as constructive to bullish, reinforcing TI’s reputation as a high‑quality analog franchise with solid capital returns.
