
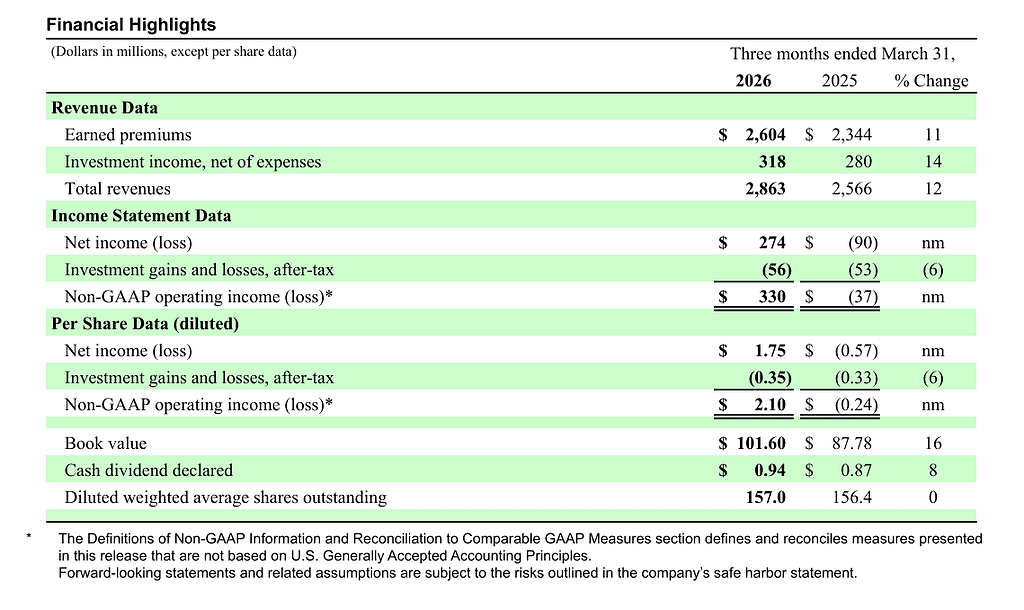
Cincinnati Financial reported Q1 2026 net income of $274 million and non GAAP operating income of $330 million, or $2.10 per share, versus a loss last year. Revenue grew to $2.86 billion but came in below analyst expectations of about $2.94 billion, while EPS beat estimates and the stock was roughly flat after the release.
About Cincinnati Financial Corporation
Cincinnati Financial Corporation(Nasdaq: CINF) is a U.S. based property casualty and life insurance group founded in 1950 and headquartered in Fairfield, Ohio, operating primarily through The Cincinnati Insurance Company and related subsidiaries.
The company focuses on commercial, personal, excess and surplus lines, plus life insurance and fixed annuities sold through a network of independent agencies across the United States. As of March 31, 2026, book value per share was $101.60, with shareholders’ equity of $15.7 billion and total assets of $41.2 billion.
Total investments stood at $32.0 billion and cash and cash equivalents at $1.21 billion, supporting a sizable investment income stream for the group. CINF declared a quarterly cash dividend of $0.94 per share for Q1 2026, up 8% year on year, reflecting its long standing dividend record. The shares recently traded around the mid 160 dollar range, implying a mid teens price to earnings multiple and a low single digit dividend yield based on recent analyst commentary.
Top Financial Highlights
- Q1 2026 net income of $274 million compared with a net loss of $90 million in Q1 2025, driven by stronger underwriting and higher investment income.
- Diluted EPS of $1.75 versus a loss of $0.57 per share a year ago, reflecting a $364 million swing in profitability.
- Non GAAP operating income of $330 million or $2.10 per share, versus an operating loss of $37 million or $0.24 per share in Q1 2025.
- Total revenues of $2.863 billion, up 12% from $2.566 billion in the prior year quarter, as earned premiums and investment income both increased.
- Earned premiums of $2.604 billion, up 11% from $2.344 billion, reflecting premium growth initiatives and higher insured exposures.
- Net investment income of $318 million, up 14% from $280 million, driven by a 12% rise in bond interest income and a 13% increase in equity dividends.
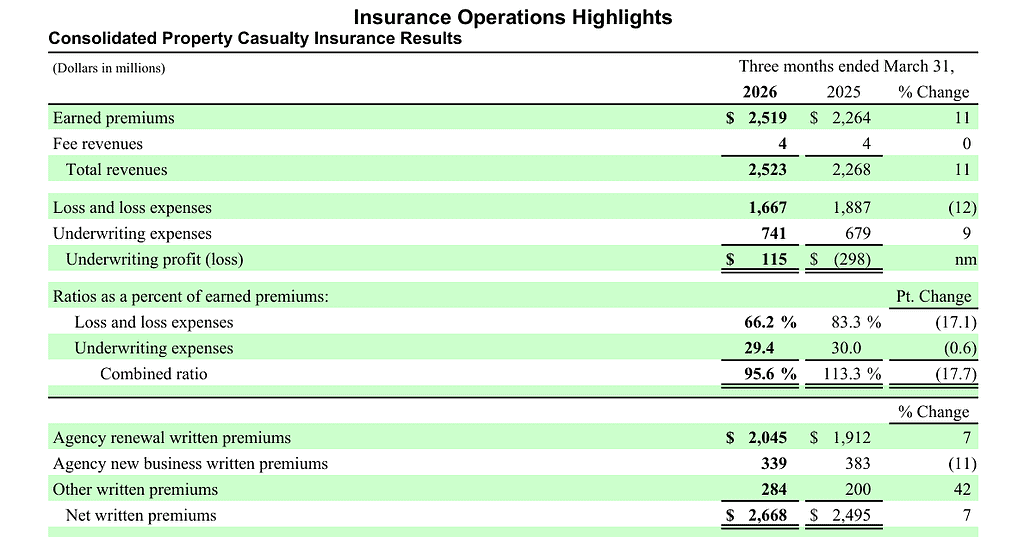
- Property casualty combined ratio improved to 95.6% from 113.3%, aided by a 14.2 point reduction in catastrophe loss impact and better underlying accident year performance.
- Commercial lines earned premiums of $1.241 billion with a combined ratio of 98.6%, versus 91.9% a year ago as catastrophe losses increased in that segment.
- Personal lines earned premiums of $873 million with a combined ratio of 96.8%, a sharp improvement from 151.3% in Q1 2025 as catastrophe losses normalized.
- Excess and surplus lines earned premiums of $180 million and a combined ratio of 89.3%, reflecting continued profitable growth in specialty underwriting.
- Life insurance subsidiary net income of $26 million, up from $21 million, on 6% earned premium growth and higher investment income.
- Parent company cash and marketable securities of $5.550 billion at March 31, 2026, down less than 1% from year end 2025, highlighting strong liquidity.
- Total consolidated cash and investments of $33.211 billion, essentially flat versus year end $33.214 billion, despite market related investment losses.
- Book value per share of $101.60, up 16% from $87.78 a year earlier, though down $0.75 from year end due to investment losses and dividends.
- Value creation ratio of 0.2% for the first three months of 2026, reflecting net income before investment gains offset by unrealized losses and dividends.
Beat or Miss?
| Metric | Reported | Difference / Analysis |
| Total revenue | $2.863 billion | Below consensus of about $2.94 billion, an approximate 2.7% miss. |
| Net premiums earned | $2.604 billion | Slightly above analyst estimate of $2.59 billion, about 0.7% beat. |
| Non GAAP EPS | $2.10 per share | Beat consensus of roughly $1.94, an 8.2% upside. |
| GAAP diluted EPS | $1.75 per share | Strong rebound from $(0.57) last year; consensus not explicitly disclosed. |
| Book value per share | $101.60 | Slightly below estimate of $102.87, about 1.2% shortfall. |
| Property casualty combined ratio | 95.60% | Improved almost 18 points YoY, signaling better underwriting and lower catastrophe losses. |
What Leadership Is Saying?
“We recorded $330 million of non GAAP operating income in the first quarter compared to a loss of $37 million a year ago. The first quarter results for our insurance operations laid a nice foundation for us to build on for the rest of the year, with our 95.6% combined ratio improving almost 18 points as lower catastrophe losses and a healthier accident year ratio give us confidence in the overall book of business.” – Stephen M. Spray, President and CEO
“Robust results from our investment operations also contributed. Pretax investment income rose $38 million in the first quarter as dividends from our equity portfolio increased 13% and bond interest income grew 12%, supporting higher operating earnings even as we recognized an $82 million after tax decrease in the fair value of equity securities still held.” – Commentary reflecting management’s investment and margin focus, attributed to the CEO in the release but summarizing the finance view.
Historical Performance
YoY results: Q1 2026 vs Q1 2025
| Category | Q1 2026 | Q1 2025 | Change (%) |
| Total revenue | $2.863 billion | $2.566 billion | About +12% year on year. |
| Net income | $274 million | $(90) million | Large swing from loss to profit, not meaningful to express as a simple percent. |
| Earned premiums | $2.604 billion | $2.344 billion | About +11% growth. |
| Investment income | $318 million | $280 million | +14% increase. |
| Underwriting expenses | $764 million | $702 million | Roughly +9% higher. |
Competitors (YoY Snapshot)
| Company / Category | Q1 2026 (YoY) | Q1 2025 (YoY) | Change (%) / Trend |
| Travelers (TRV) – revenue | High single digit revenue growth, driven by premium increases and stable retention. | Mid single digit growth with higher catastrophe impact. | Trend improving as catastrophe losses normalized. |
| Chubb (CB) – net income | Strong double digit net income growth on better underwriting margins and investment income. | Lower earnings level with higher cat losses. | Marked YoY profit improvement. |
| Progressive (PGR) – combined ratio | Combined ratio in low to mid 90s, reflecting disciplined pricing and loss trends. | Higher 90s ratio, pressured by auto severity. | Underwriting margin modestly stronger YoY. |
How the Market Reacted?
Initial market reaction to the Q1 2026 print was muted, with the stock roughly unchanged around $165.71 following the release. Investors appeared to balance the strong EPS beat, sharply improved underwriting performance, and healthy premium growth against the revenue miss and modest shortfall in book value per share versus expectations. Overall sentiment around the quarter skewed moderately positive, as the company demonstrated a clean turnaround from last year’s loss while maintaining strong capital and liquidity levels.
