Flowers Foods (NYSE: FLO) reported Q1 2026 adjusted EPS of $0.29, beating the consensus estimate of $0.27 by 8.2%. Net sales came in at $1.572 billion, meeting Wall Street’s revenue expectations. The stock gained approximately 1.2% the day following the earnings announcement, reflecting a cautiously positive market reaction to a mixed but in-line quarter.
About Flowers Foods
Flowers Foods, Inc. (NYSE: FLO) is one of the largest producers and marketers of packaged bakery foods in the United States, headquartered in Thomasville, Georgia. Founded in 1919 by brothers William Howard and Joseph Hampton Flowers, the company has a century-long legacy in the baking industry. The company was formerly known as Flowers Industries before rebranding as Flowers Foods in 2001.
As of May 2026, Flowers Foods carries a market capitalization of approximately $1.47 billion to $1.54 billion, with approximately 10,300 employees and 44 bakeries operating across 19 states. It ranks as the second-largest producer of packaged bakery foods in the U.S., with 2025 net sales of $5.3 billion. The company’s top brands include Nature’s Own, Dave’s Killer Bread, Canyon Bakehouse, Simple Mills, Wonder, and Tastykake, and it holds an 18.2% share of the U.S. fresh bread market.
At current price levels, FLO carries a dividend yield of approximately 13.7% and a P/E ratio near 18. The quarterly cash dividend was recently reset to $0.125 per share, or $0.50 annualized, reflecting management’s commitment to debt reduction following the Simple Mills acquisition.
Top Financial Highlights
- Net Sales rose $17.3 million, or 1.1%, year over year to $1.572 billion, driven by the Simple Mills acquisition contribution and favorable pricing/mix, partially offset by volume declines.
- Branded Retail Net Sales grew 3.4% to $1.045 billion, supported by a 3.6% acquisition contribution and 4.0% pricing/mix improvement, partly offset by a 4.2% volume decline.
- Other Net Sales (non-branded/foodservice) fell 3.1% to $526.2 million due to inflationary consumer pressure and margin optimization strategies.
- Net Income decreased 20.6% to $42.1 million, representing 2.7% of net sales, a 70-basis-point decline versus the prior year.
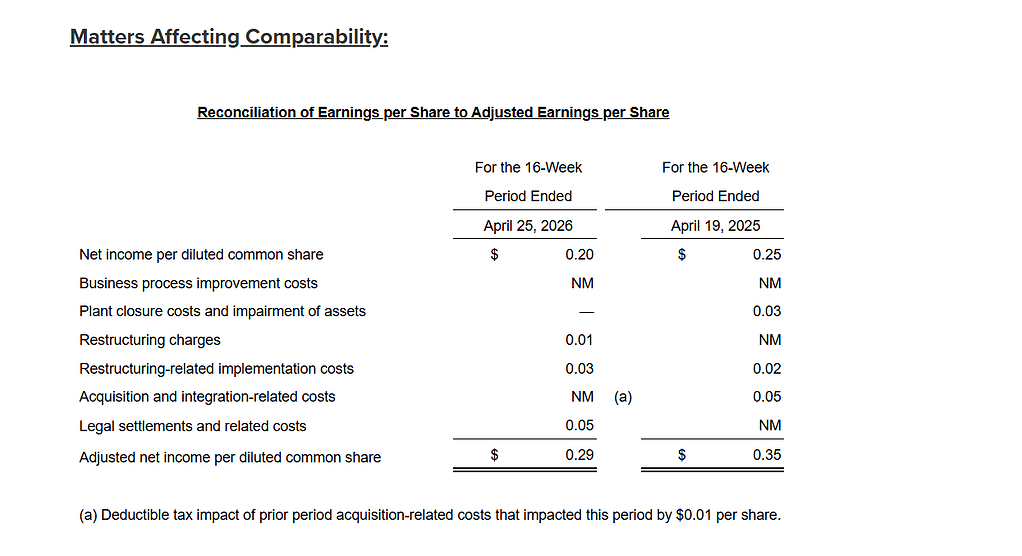
- Diluted EPS decreased $0.05 to $0.20; Adjusted Diluted EPS decreased $0.06 to $0.29.
- Adjusted Net Income declined 17.4% to $60.9 million, reflecting a challenging consumer environment and elevated interest expense.
- Adjusted EBITDA fell 1.8% to $159.0 million, representing 10.1% of net sales, a 30-basis-point decrease.
- Gross Margin (excluding D&A) was $776.2 million vs. $775.9 million in Q1 2025, essentially flat.
- Materials, Supplies, Labor, and Other Production Costs were 50.6% of net sales, a 50-basis-point increase, partly driven by higher outside product purchases.
- SD&A Expenses were 40.9% of net sales; adjusted SD&A improved to 39.3% of net sales, a 20-basis-point decrease.
- Operating Cash Flow decreased $27.8 million to $107.9 million; Capital expenditures declined to $20.6 million.
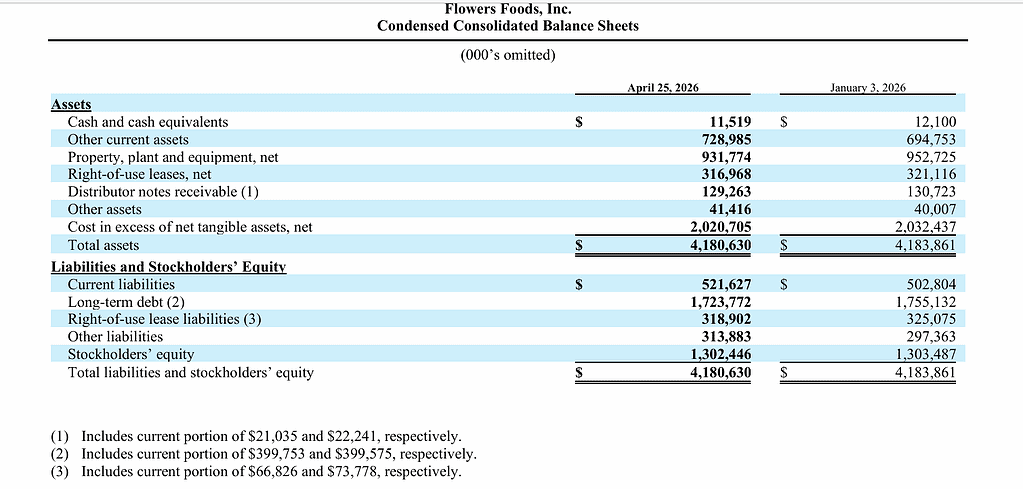
- Cash and Cash Equivalents stood at $11.5 million at quarter end.
- Full-Year FY2026 Guidance Reaffirmed: Net sales of $5.163 billion to $5.267 billion; Adjusted EBITDA of $465 million to $495 million; Adjusted Diluted EPS of $0.80 to $0.90.
- Quarterly Dividend Declared at $0.125 per share, payable June 26, 2026, representing the 95th consecutive quarterly dividend.
Beat or Miss?
| Metric | Reported | Estimated/Expected | Difference/Analysis |
| Net Sales | $1.572 billion | $1.56 billion | In line; slightly above consensus |
| Adjusted Diluted EPS | $0.29 | $0.27 | Beat by 8.2% |
| GAAP Diluted EPS | $0.20 | N/A | Below prior year Q1 ($0.25) |
| Adjusted EBITDA | $159.0 million | Above expectations | Beat; margin at 10.1% |
| Adjusted Operating Income | Below expectations | Consensus estimates | Missed adjusted operating income |
| Full-Year Revenue Guidance (midpoint) | $5.215 billion | $5.18 billion | 0.6% above analyst estimates |
| Full-Year Adjusted EPS Guidance | $0.80 to $0.90 | N/A | Reaffirmed |
What Leadership Is Saying?
CEO Ryals McMullian on Strategy and Vision
“Flowers’ first quarter reflects our team’s disciplined cost management, helping us deliver financial performance in-line with expectations despite softer top-line results driven by ongoing challenging macroeconomic conditions impacting the category. At the same time, we’ve made meaningful progress in strengthening our long-term position by evolving our product portfolio to better meet consumers’ needs, including the relaunch of Nature’s Own, now with simple ingredients and Non-GMO Project Verified certification, a mainstream category first.”
“The comprehensive review of our brand portfolio, supply chain, and financial strategy announced last quarter is well underway and helping to further clarify how we allocate resources to strengthen our position and support the growth of our strongest brands. As we move forward and execute our strategy, we expect dividends to remain an important component of our overall shareholder value proposition.”
CFO (Financial Commentary via Release)
“We reset our quarterly dividend to $0.125 per share, or $0.50 per share on an annualized basis, allowing us to prioritize meaningful debt reduction while continuing to invest behind the brands, innovation, and capabilities that we believe will drive sustainable above-category growth over time. With respect to our 2026 outlook, we are reaffirming guidance and our team remains focused on disciplined execution, managing the areas of the business we can directly influence and delivering against our strategic and financial objectives for the year.”
Historical Performance
| Category | Q1 2026 | Q1 2025 | Change (%) |
| Net Sales | $1,571.6 million | $1,554.2 million | 1.10% |
| Net Income | $42.1 million | $53.0 million | -20.60% |
| Adjusted Net Income | $60.9 million | $73.7 million | -17.40% |
| Adjusted EBITDA | $159.0 million | $162.0 million | -1.80% |
| Diluted EPS (GAAP) | $0.20 | $0.25 | -20.00% |
| Adjusted Diluted EPS | $0.29 | $0.35 | -17.10% |
| SD&A Expenses | $642.9 million | $633.5 million | 1.50% |
| Materials and Production Costs | $795.4 million | $778.3 million | 2.20% |
| Operating Cash Flow | $107.9 million | $135.6 million | -20.50% |
| Branded Retail Net Sales | $1,045.4 million | $1,011.3 million | 3.40% |
| Other Net Sales | $526.2 million | $542.9 million | -3.10% |
Competitor Historical Performance
The table below compares key competitors’ Q1 2026 results against Q1 2025, providing context for the broader packaged bakery and food industry.
| Category | Q1 2026 | Q1 2025 | Change (%) |
| Grupo Bimbo Net Sales (MXN millions) | 100,319 | 103,448 | -3.0% (FX-adjusted: +4.8%) |
| Grupo Bimbo Net Income (MXN millions) | 2,362 | 1,785 | 32.30% |
| Grupo Bimbo Adj. EBITDA Margin | 14.0% | ~12.4% | +160 bps |
| Campbell’s Net Sales (Q1 FY2026, Nov 2025) | $2.7 billion | $2.79 billion | -3.20% |
| Campbell’s Adjusted EPS (Q1 FY2026) | $0.77 | ~$0.89 (prior year) | -13.5% |
| Campbell’s Operating Income (EBIT) | $336 million | ~$378 million (est.) | -11.00% |
Grupo Bimbo’s fiscal Q1 ends March 31, 2026; Campbell’s fiscal Q1 2026 ended November 2025 (different fiscal calendars). Currency movements significantly affected Grupo Bimbo’s peso-denominated results, though its underlying constant-currency performance was strong. Campbell’s faced headwinds from tariffs on steel used in soup can production and declining organic sales.
How the Market Reacted?
Flowers Foods (NYSE: FLO) shares gained approximately 1.2% the day following the Q1 2026 earnings announcement on May 21, 2026. Prior to earnings, the stock had already been under significant pressure, trading near multi-year lows with a 52-week range of $6.80 to $17.24 as of late May 2026.
The market response was modestly positive, reflecting relief that adjusted EPS beat consensus by 8.2% and that the company reaffirmed its full-year 2026 guidance. Analyst sentiment remains cautious, with a consensus Hold rating and a 12-month average price target of $9.80, representing approximately 39.8% upside from current trading levels near $7.
