Customers Bancorp reported Q1 2026 diluted EPS of $1.97 on net income of $69.7 million, with net revenue driven by strong loan and deposit growth and a leaner efficiency ratio under 50%. Revenue of about $225.7 million modestly beat Wall Street expectations. The release did not specify an immediate stock price reaction, so after-hours movement was not disclosed.
About Customers Bancorp
Customers Bancorp, Inc.(NYSE: CUBI) is a bank holding company with approximately $25.9 billion in total assets as of March 31, 2026, making it one of the 80 largest bank holding companies in the United States. The company is headquartered in West Reading, Pennsylvania, and operates Customers Bank, which provides technology-enabled commercial and consumer banking services across key U.S. markets including the greater Philadelphia area, New York metropolitan region, Chicago, Columbus and South Florida.
Founded in the early 2000s, Customers Bancorp has expanded both organically and through targeted acquisitions while maintaining strong capital ratios, with a common equity Tier 1 ratio of 12.8% at the end of Q1 2026. The bank focuses on a single point of contact service model for mid-market companies, small businesses, professionals and individual consumers, offering products in C&I lending, commercial real estate, residential and personal lending plus national platforms in fund finance, venture banking, healthcare, mortgage finance and equipment finance.
As of Q1 2026, Customers Bancorp does not disclose a dividend yield in the release, but it reports book value per common share of $63.64 and tangible book value per share of $63.54, supported by robust profitability metrics including a ROAA of 1.13% and ROCE of 13.16%.
Top Financial Highlights
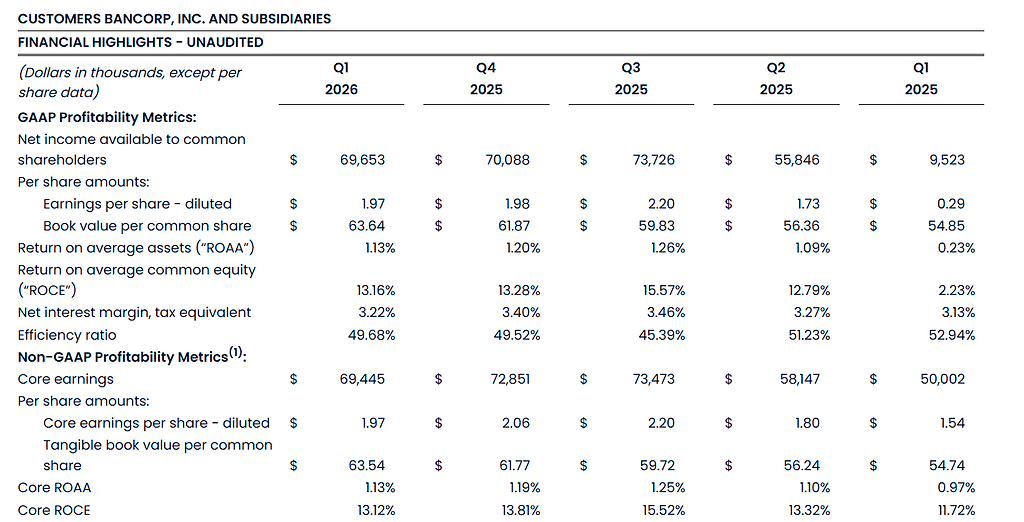
- Q1 2026 net income available to common shareholders was $69.7 million, or $1.97 per diluted share.
- Core earnings were $69.4 million, or $1.97 per diluted share, reflecting similar performance on a core basis.
- Net interest income totaled $191.4 million for Q1 2026.
- Reported non-interest income was $34.3 million, up from $32.5 million in Q4 2025, driven by higher loan fees, commercial lease income and gains on loan sales.
- Implied total revenue (net interest income plus non-interest income) for Q1 2026 was approximately $225.7 million, up sharply year over year.
- Q1 2026 net interest margin (tax equivalent) was 3.22%, down from 3.40% in Q4 2025 due to fading discount accretion and fewer days in the quarter.
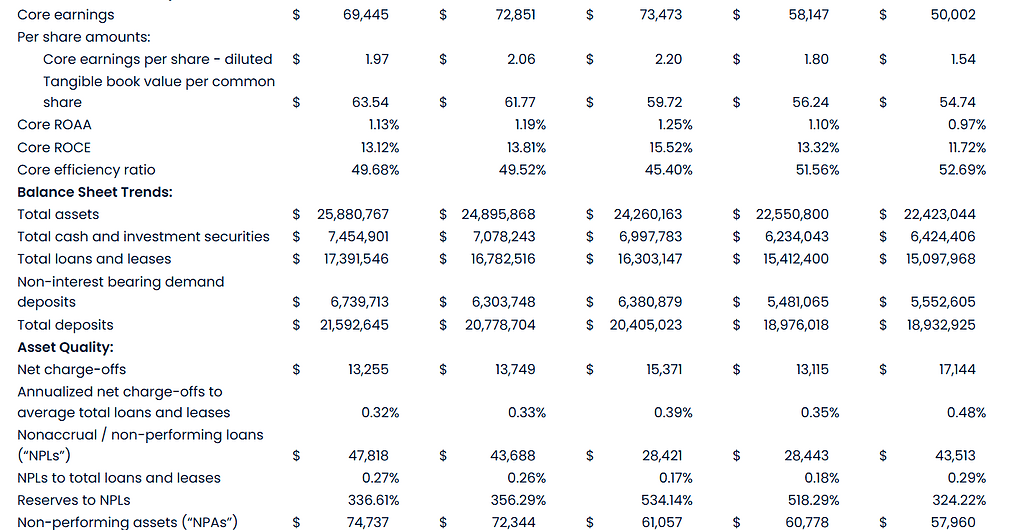
- Total loans and leases held for investment reached $17.4 billion, up 3.7% sequentially and 15.3% year over year, with strong growth in C&I specialized lending, mortgage finance and commercial real estate.
- Total deposits rose $814 million in the quarter to $21.6 billion, a 3.9% sequential increase and 14.0% growth versus Q1 2025, while average deposit costs fell to 2.46% from 2.82% a year earlier.
- Non-interest bearing deposits climbed to a record $6.7 billion, representing 31.2% of total deposits and supporting a favorable funding mix.
- Asset quality remained solid, with non-performing assets at 0.29% of total assets and non-performing loans at 0.27% of total loans and leases, while reserves covered about 337% of non-performing loans.
- The efficiency ratio improved to 49.68% in Q1 2026 from 52.94% in Q1 2025, reflecting positive operating leverage and disciplined cost control.
- Tangible common equity to tangible assets stood at 8.3%, up from 7.7% a year earlier, supported by earnings, capital issuance in 2025 and reduced unrealized securities losses.
- Book value per common share increased to $63.64 from $54.85 a year earlier, while tangible book value per share rose to $63.54 from $54.74.
- The company repurchased 621,668 common shares in Q1 2026 at a weighted average price of $68.04, totaling approximately $43 million.
- Management highlighted strong growth across revenue (up about 58% year over year), core earnings (up about 28%) and book value per share (up 16%) compared with Q1 2025.
Beat or Miss?
| Metric | Reported | Difference / Analysis |
| Revenue | $225.7 million (approx.) | Slight beat vs MarketBeat consensus of about $223.5 million; positive top-line surprise.marketbeat+1 |
| Diluted EPS | $1.97 | No specific EPS consensus cited in the release; third-party sources note strong EPS, but precise beat/miss not quantified.intellectia |
| Net Interest Income | $191.4 million | Down $13.1 million sequentially due to lower discount accretion and fewer days; up $23.9 million year over year. |
| Net Interest Margin (NIM) | 3.22% | Declined from 3.40% in Q4 2025; management attributes this to expected headwinds from discount accretion runoff and seasonality. |
| Efficiency Ratio | 49.68% | Improved versus 52.94% in Q1 2025, reflecting positive operating leverage. |
What Leadership Is Saying
“On January 1, 2026, I had the honor of succeeding Jay Sidhu as Chief Executive Officer of Customers Bancorp. This transition was the culmination of a deliberate, multiyear transition that our Board and leadership team planned carefully to ensure continuity for our clients, our team members and our shareholders.”
“We got off to a strong start to the year in what is typically a slower quarter, as we continued to strategically grow our loan and deposit portfolios with momentum throughout the organization. In Q1 2026, we once again delivered exceptionally strong growth across key metrics of revenue, core earnings, and book value per share when compared to Q1 2025.” – Sam Sidhu, CEO, Customers Bancorp
“Net interest income and net interest margin were impacted as expected by the sunsetting of the discount accretion that benefitted Q3 and Q4 2025 as well as a lower day count in the quarter. We continue to have positive drivers to net interest income on both sides of the balance sheet, with a strong loan pipeline and growing momentum from our primarily deposit-focused commercial banking team recruitment strategy.”
“We successfully achieved our initial operational excellence goal of $20 million in annual run rate revenue enhancements and expense savings, providing capacity for further investment in the franchise, and we are driving significant positive operating leverage with core revenue growth of 16% and core expense growth of only 9% versus Q1 2025.” – Mark McCollom, CFO, Customers Bancorp
Historical Performance
YoY Financial Comparison
| Category | Q1 2026 | Q1 2025 | Change (%) |
| Revenue (approx.) | $225.7 million | ~$143 million (implied) | About +58%, driven by higher net interest income and non-interest income. |
| Net Income | $69.7 million | $9.5 million | About +632%, reflecting improved margins, lower securities impairment and stronger core operations. |
| Operating Expenses (Non-interest expense) | $112.0 million | $102.8 million (Q1 2025) | Approximately +9%, primarily from higher salaries, benefits and commercial lease depreciation, partly offset by lower FDIC assessments. |
Historical Performance of Competitors
For peer context, a large U.S. regional banking competitor, U.S. Bancorp, reported more modest year over year net interest income growth in its recent Q1 2026 results, reflecting a different balance sheet and rate positioning than Customers Bancorp. Directly comparable line-item quarterly figures (revenue, net income and operating expenses) for a consistent peer set are not provided in the Customers Bancorp release and require external filings for precision.
Based on available summaries, Customers Bancorp’s approximate 58% revenue growth and very strong net income expansion appear above typical large-bank sector trends, which have seen mid-single to low-double-digit growth in core net interest income under current conditions. Because the Q1 2026 press release does not include a formal competitor table, the competitor view here is directional rather than a strict like-for-like numeric comparison
| Category | Q1 2026 (Customers Bancorp) | Q1 2025 (Customers Bancorp) | Direction vs large-bank peers (qualitative) |
| Revenue | Strong growth, about +58% YoY. | Baseline | Above typical mid-single to low-double-digit peer revenue growth. |
| Net Income | Very strong improvement, about +632% YoY. | Depressed by securities impairment. | Significantly stronger rebound than most large peers that did not face similar prior-year charges. |
| Operating Expenses | Up about 9% YoY. | Lower base | Similar or slightly above peer expense growth but with better efficiency ratio improvement. |
How the Market Reacted?
The Q1 2026 earnings release highlights a strong fundamental quarter with robust loan and deposit growth, double-digit revenue expansion and a more efficient cost structure, but it does not include any description of the immediate stock price move or intraday trading reaction.
In the absence of explicit share price data, the qualitative tone of management commentary and the improvement in profitability, asset quality and capital suggest a broadly constructive or bullish sentiment around the results. The company’s decision to repurchase common stock and its reiterated focus on AI, automation and payments capabilities further underpins confidence in future performance rather than signaling caution
