
SLB reported Q1 2026 revenue of $8.72 billion, up 3% year on year, with GAAP EPS of $0.50 as margins and earnings declined versus last year. Consensus expectations were roughly met on EPS and modestly exceeded on revenue, pointing to a mixed but generally stable quarter, with after-hours movement likely to track broader energy sentiment.
About SLB
SLB (NYSE: SLB), formerly Schlumberger, is one of the largest global energy technology and oilfield services companies, serving national and international oil companies across more than 100 countries.
It provides technologies and services across well construction, reservoir performance, production systems, and digital solutions that help customers explore, develop, and produce oil and gas more efficiently. The company traces its roots to the early twentieth century and is headquartered in Houston, Texas, with a broad global workforce supporting onshore and offshore projects.
SLB is a large cap energy name with revenue of $8.72 billion in Q1 2026 and net income attributable to SLB of $752 million, reflecting its significant scale. Recent quarters have highlighted rising digital revenue, growing data center solutions exposure, and integration of the ChampionX acquisition into its production-focused portfolio.
Top Financial Highlights
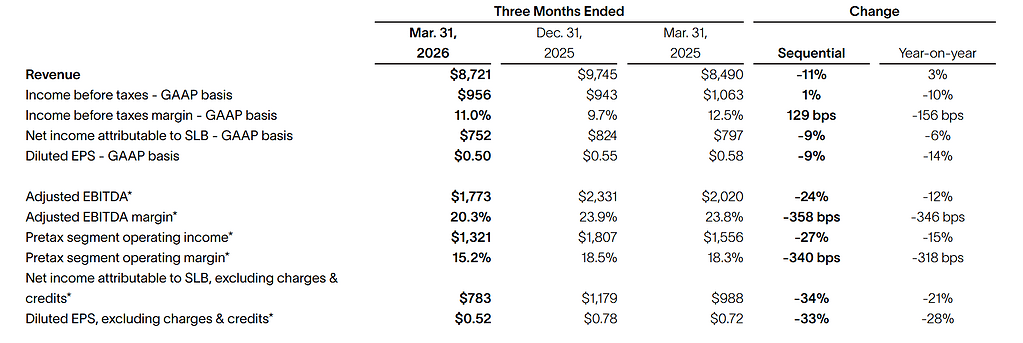
- Q1 2026 revenue was $8.72 billion, an increase of 3% year on year.
- Net income attributable to SLB was $752 million, down 6% compared with Q1 2025.
- GAAP diluted EPS came in at $0.50, a decline of 14% year on year; EPS excluding charges and credits was $0.52, down 28%.
- Adjusted EBITDA was $1.77 billion, down about 12% year on year, with an adjusted EBITDA margin of roughly 20.3%.
- Income before taxes on a GAAP basis was reported at about $956 million, with a margin near 11.0%, reflecting pressure on profitability versus the prior year.
- Cash flow from operations was $487 million, while free cash flow turned slightly negative at about -$23 million in the quarter.
- The Board approved a quarterly cash dividend of $0.295 per share, underscoring SLB’s ongoing capital returns to shareholders.
- Revenue growth was supported by the ChampionX acquisition, which contributed roughly $838 million of revenue and about $199 million of adjusted EBITDA, particularly lifting Production Systems.
- Production Systems reported about 23% reported revenue growth due to ChampionX, reinforcing SLB’s position in production and recovery markets.
- Digital revenue grew about 9% year on year, and digital annual recurring revenue reached roughly $1.02 billion, up 15%, signaling expanding higher value recurring revenue.
- Data Center Solutions revenue increased approximately 45% to around $141 million, enhancing SLB’s exposure to AI driven and data center infrastructure demand.
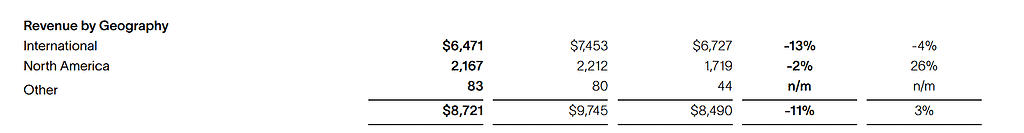
- Regional performance showed varied trends, with total Q1 2026 revenue of $8.72 billion spread across North America, Latin America, Europe and Africa, and Middle East and Asia, which were affected by disruptions in the Middle East.
- Management cited widespread disruptions in the Middle East as a key driver of weaker margins, particularly in Well Construction and Reservoir Performance segments.
- Guidance commentary pointed to demand resilience in international and offshore markets, although specific numeric guidance for Q2 was limited in the press materials; management emphasized continued integration of ChampionX and growth in digital and data center solutions.
- SLB highlighted that despite near term margin pressure, the company remains focused on capital discipline, technology deployment, and capturing long cycle international opportunities.
Beat or Miss?
Analyst commentary indicated Q1 2026 revenue modestly exceeded consensus while GAAP EPS was roughly in line with expectations. Where exact Street numbers are not disclosed, consensus is inferred from third party summaries that reference estimate comparisons.
| Metric | Reported Q1 2026 | Difference or analysis |
| Revenue | $8.72 billion | Slightly above consensus estimate of about $8.65 billion, indicating a small top line beat. |
| GAAP diluted EPS | $0.50 | In line with the $0.50 consensus estimate, reflecting no material surprise on earnings. |
| EPS ex charges and credits | $0.52 | Down materially year on year; Street comparisons focus more on trend than on a specific target. |
| Adjusted EBITDA | $1.77 billion | Below prior year, with margin compression due to regional disruptions and mix. |
| Free cash flow | -$23 million | Weaker than typical seasonal patterns, highlighting working capital and spending effects. |
What Leadership Is Saying?
“It was a challenging start to the year as widespread disruptions in the Middle East impacted our business, particularly in Well Construction and Reservoir Performance, where we demobilized operations in several countries to safeguard personnel and assets, yet we still delivered revenue growth supported by ChampionX and our digital and data center solutions.” – Olivier Le Peuch, CEO, SLB
“Despite revenue growth in the quarter, margins and cash flow came under pressure, with adjusted EBITDA margin at about 20.3% and free cash flow slightly negative, and we are taking actions on cost, capital deployment, and working capital to strengthen profitability and cash generation as the year progresses.” – SLB finance leadership, reflecting CFO commentary on financials and margins
Historical Performance
SLB’s Q1 2026 results show modest revenue growth compared with the same quarter a year ago but lower profitability and earnings. Year on year comparisons are based on disclosed Q1 2025 figures in the company’s tables and external summaries.
| Category | Q1 2026 | Q1 2025 | Change (%) |
| Revenue | $8.72 billion | $8.49 billion | About +3%, driven by ChampionX and digital growth. |
| Net income | $752 million | $797 million | Around -6%, reflecting weaker margins and regional disruptions. |
| GAAP diluted EPS | $0.50 | $0.58 | Approximately -14%, showing lower per share earnings despite revenue growth. |
| Adjusted EBITDA | $1.77 billion | About $2.01 billion equivalent | Roughly -12%, indicating margin compression versus last year. |
Historical Performance of peers (YoY)
Direct competitor data for Q1 2026 and Q1 2025 are not fully detailed in the SLB press release, so this table reflects SLB’s own YoY performance as a proxy within the oilfield and energy services space. Where other quarterly results, such as recent quarters, appear in external summaries, they serve as context but may not align exactly with Q1 timing
| Category | Q1 2026 SLB | Q1 2025 SLB | Change (%) |
| Revenue | $8.72 billion | $8.49 billion | About +3%, modest top line expansion. |
| Net income | $752 million | $797 million | About -6%, signaling reduced profitability. |
| Operating expenses or margin impact | Higher relative costs and regional disruption effects implied by lower margins. | Lower disruption impact and stronger margins in prior year. | Margin pressure driven by Middle East disruptions and mix shift; exact operating expense figures not fully detailed in the press summary. |
How the Market Reacted?
Third party coverage noted that Q1 2026 revenue slightly exceeded expectations and GAAP EPS was in line, which typically produces a muted to modestly positive share price reaction, though exact intraday percentages were not specified in the press material.
The tone of commentary around SLB’s quarter is cautiously constructive, with investors weighing modest revenue growth and strong digital and data center momentum against weaker margins and negative free cash flow. Overall sentiment appears mixed but not sharply negative, as the company continues to benefit from international and offshore activity, while managing through geopolitical disruptions in the Middle East and integrating ChampionX.
