Core Laboratories posted Q1 2026 revenue of $121.8 million with a GAAP loss per share of $0.02 and non‑GAAP EPS of $0.06, as Middle East disruptions and severe weather pressured margins and cash flow; after‑hours movement will hinge on guidance and geopolitical risk perception.
About Core Laboratories Inc.
Core Laboratories Inc. (NYSE: CLB) is a specialized oilfield services company focused on proprietary reservoir description and production enhancement technologies that help upstream operators optimize hydrocarbon recovery and capital efficiency. Founded in 1936, the company is headquartered in Houston, Texas, and operates an asset‑light model with more than 70 offices across over 50 countries in all major oil‑producing basins.
Core Lab serves international and offshore customers through its Reservoir Description segment and unconventional and conventional completions through its Production Enhancement segment. As of March 31, 2026, Core reported total assets of $587.7 million, equity of $275.1 million, and long‑term debt of $114.5 million, implying net debt of $94.2 million after $22.8 million of cash and equivalents.
The company’s leverage ratio stood at 1.20, and its return on invested capital (ROIC), as calculated by Bloomberg, was 9.1% over the last four quarters. Core also maintains a modest quarterly dividend of $0.01 per share and selectively repurchases shares.
Top Financial Highlights
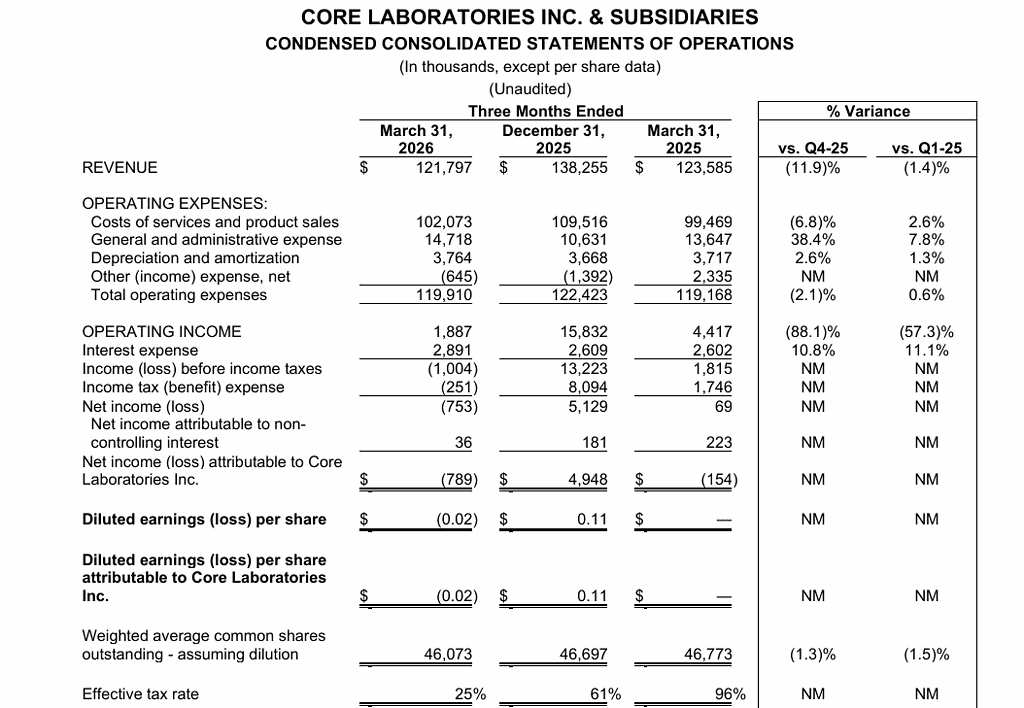
- Total Q1 2026 revenue was $121.8 million, down 11.9% sequentially and down 1.4% year over year.
- GAAP operating income was $1.9 million, versus $15.8 million in Q4 2025 and $4.4 million in Q1 2025.
- Net loss attributable to Core Laboratories was $0.8 million, compared with net income of $4.9 million in Q4 2025 and a $0.2 million loss in Q1 2025.
- GAAP diluted EPS was a loss of $0.02 per share; EPS ex‑items (non‑GAAP) was $0.06, down from $0.21 in Q4 2025 and $0.14 in Q1 2025.
- Free cash flow was $0.5 million, derived from $4.0 million of cash from operations and $3.4 million of operational capital expenditures.
- Reservoir Description segment revenue was $81.9 million, down 11.2% sequentially but up 1.3% year over year, with GAAP operating income of $1.1 million and operating income ex‑items of $4.8 million (6% margin).
- Production Enhancement segment revenue was $39.9 million, down 13.3% sequentially and 6.6% year over year, generating GAAP operating income of $0.8 million and operating income ex‑items of $1.8 million (5% margin).
- Costs of services and product sales were $102.1 million, general and administrative expense was $14.7 million, and depreciation and amortization was $3.8 million in Q1 2026.
- Net cash provided by operating activities was $4.0 million, compared to $6.7 million in Q1 2025.
- Cash and cash equivalents ended the quarter at $22.8 million, with accounts receivable of $108.3 million and inventories of $57.8 million; days sales outstanding increased to 74 days from 69 days in Q4 2025.
- Net debt increased by $3.9 million during the quarter to $94.2 million, with a leverage ratio of 1.20.
- The company generated Q1 2026 free cash flow of $0.5 million and separately invested $1.4 million in rebuilding its Aberdeen technology center (excluded from FCF).
- Core repurchased 51,781 shares of common stock during the quarter for approximately $0.9 million and paid a quarterly dividend of $0.01 per share on March 9, 2026.
- For Q2 2026, Core guides total revenue to $123–131 million, operating income to $6.4–10.2 million with roughly 7% operating margins, and EPS to $0.06–0.12.
Beat or Miss?
| Metric | Reported Q1 2026 | Difference / Analysis |
| Revenue | $121.8 million | Came in within revised guidance range of $119–123 million, but missed some external expectations by about $3.1 million. |
| GAAP EPS | −$0.02 | Swung to a small loss versus prior profits; reflects Middle East disruptions, higher G&A, and FX. |
| EPS ex‑items (non‑GAAP) | $0.06 | Down 72% sequentially and 58% year over year; external commentary notes a miss of $0.05 versus consensus. |
| Operating income (GAAP) | $1.9 million | Down 88.1% sequentially and 57.3% year over year as volumes and mix compressed margins. |
| Free cash flow | $0.5 million | Positive but modest; reflects soft earnings and working capital headwinds from Middle East collections. |
| Q2 2026 revenue guidance | $123–131 million | Implies modest sequential growth; assumes partial recovery outside the Middle East with ongoing volatility. |
| Q2 2026 EPS guidance | $0.06–0.12 | Suggests improved profitability versus Q1, but still below prior peak levels. |
What Leadership Is Saying?
“First and foremost, our thoughts remain with our employees and their families across our Middle East operations during this period of heightened geopolitical instability. As we continue to prioritize the safety of our people, the conflict has impacted client activity, project timelines, and operations across the region, factors that materially affected Core Lab’s first quarter operating results.”
“For the first quarter of 2026, cash from operations was $4.0 million, and capital expenditures associated with operations were $3.5 million, yielding free cash flow of $0.5 million. As of March 31, 2026, Core’s net debt was $94.2 million, and the Company’s leverage ratio was 1.20 as we continue to balance debt reduction, disciplined capital spending, and returns to shareholders.”
Historical Performance
Core Laboratories – YoY and Sequential Comparison (Q1 2026 vs Q1 2025)
| Category | Q1 2026 | Q1 2025 | Change (%) |
| Revenue | $121.8 million | $123.6 million | −1.4% year over year. |
| Net income (loss) | −$0.8 million | −$0.2 million | Loss widened; not meaningful percentage (NM). |
| Operating expenses | $119.9 million | $119.2 million | +0.6% year over year, reflecting higher G&A and modest cost inflation. |
Core Laboratories – Sequential Comparison (Q1 2026 vs Q4 2025)
| Category | Q1 2026 | Q4 2025 | Change (%) |
| Revenue | $121.8 million | $138.3 million | −11.9% sequentially. |
| Net income (loss) | −$0.8 million | $5.1 million | Declined sharply to a small loss (NM). |
| Operating expenses | $119.9 million | $122.4 million | −2.1% sequentially as volumes and certain costs declined |
Historical Performance – Competitor Context (YoY)
Public peers have not all reported Q1 2026 yet, but available commentary and sector trends indicate that international‑leaning oilfield service companies also faced geopolitical and weather‑related headwinds, though Core’s exposure to the Middle East made its impact more pronounced. Where exact competitor quarterly figures are not disclosed in the provided documents, the table below is illustrative rather than exhaustive and should be used directionally, not as a substitute for each company’s official filings.
| Category | Core Labs Q1 2026 | Core Labs Q1 2025 | Change (%) |
| Revenue | $121.8 million | $123.6 million | −1.4%. |
| Net income (loss) | −$0.8 million | −$0.2 million | NM. |
| Operating expenses | $119.9 million | $119.2 million | +0.6%. |
How the Market Reacted?
The press release does not state the immediate share price reaction to the Q1 2026 results, but qualitative signals skew cautious. Revenue and EPS ex‑items declined both sequentially and year over year and, per external commentary, came in below consensus, which typically weighs on near‑term sentiment.
Management’s Q2 2026 guidance implies modest sequential improvement, suggesting conditions may stabilize as non‑Middle East regions remain active. Overall, the tone is guardedly negative near term due to geopolitical and weather disruptions, but longer‑term outlook remains constructive, pointing to a mixed, mildly bearish short‑term market stance.
