





Initiation
Dietary Sugar Statistics: Sugar is a regular part of our daily diet, but eating too much can harm your health. It is naturally found in fruits, vegetables, and milk, while added sugar is common in soft drinks, candies, desserts, breakfast cereals, and many packaged foods. Although our body needs some sugar for energy, excess intake can increase the risk of obesity, type 2 diabetes, heart disease, and tooth decay.
Many people consume more added sugar than health experts recommend, often without realizing it. Knowing how much sugar we eat, where it comes from, and how it affects our body can help us make healthier food choices. This article covers the latest dietary sugar statistics, trends, and key facts.
Top Selection
- Global sugar production is forecast to reach 189.3 million tons in MY 2025/26, while consumption is expected at 178.1 million tons.
- Brazil dominates global exports with 35.7 million tons, representing about 54% of worldwide sugar exports.
- The World Bank forecasts the average sugar price at USD 0.37/kg in 2026.
- The average American consumes 17 teaspoons (71.14 grams) of added sugar every day.
- Excessive sugar intake is associated with a 200% higher obesity risk when added sugar exceeds 25% of daily calories.
- Regular consumption of sugary drinks can increase type 2 diabetes risk by 26% and heart disease risk by up to 38%.
- Mexico has the world’s highest sugar-sweetened beverage consumption at 163 liters per person annually.
- The natural sweeteners market is projected to reach USD 29.6 billion in 2026.
- Around 72% of consumers are actively trying to reduce or avoid sugar intake.
- Stevia is up to 300× sweeter than sugar, while sucralose is approximately 600× sweeter with 0 calories.
Global Sugar Trade Trends and Market Outlook
- The global sugar market in 2026 remains highly concentrated, with Brazil, Thailand, and India supplying most exportable sugar, while demand is spread across Asia, the Middle East, North Africa, and Sub-Saharan Africa.
- According to USDA FAS (December 2025), global sugar production for MY 2025/26 is forecast at 189.3 million tons, while consumption is expected to reach 178.1 million tons.
- A report published by academia.edu stated that world sugar exports are projected at 66 million tons, and ending stocks are expected to increase from 42.4 million tons in 2024/25 to 44.5 million tons in 2025/26.
- Brazil is forecast to export 35.7 million tons, accounting for about 54% of global exports. Thailand is expected to export 7.0 million tons, while India is projected to export 4.5 million tons.
- Major importers include China (5.3 million tons) and Indonesia (5.15 million tons), with additional demand from the UAE, Algeria, Malaysia, Bangladesh, Saudi Arabia, and Nigeria.
- The World Bank forecasts the average 2026 sugar price at USD 0.37/kg, down slightly from USD 0.38/kg in 2025 (about 16.8¢/lb).
Key Sugar Consumption Facts
- The average American consumes about 17 teaspoons (71.14 grams) of added sugar every day.
- In the United Kingdom, teenagers and adults consume 3 times the recommended daily limit of added sugar.
- High sugar intake increases the risk of obesity and overweight, which affects more than 650 million adults worldwide.
- Eating too much sugar is linked to a higher risk of type 2 diabetes, affecting around 422 million people globally.
- Drinking sugary beverages regularly can increase the risk of heart disease by up to 20%.
- Tooth decay is the most common diet-related disease, affecting nearly 50% of the global population, largely because of high sugar intake.
- Mexico has one of the world’s highest sugar-sweetened beverage consumption rates, averaging 163 liters per person per year.
Natural Sweeteners Market Outlook
(Source: market.us)
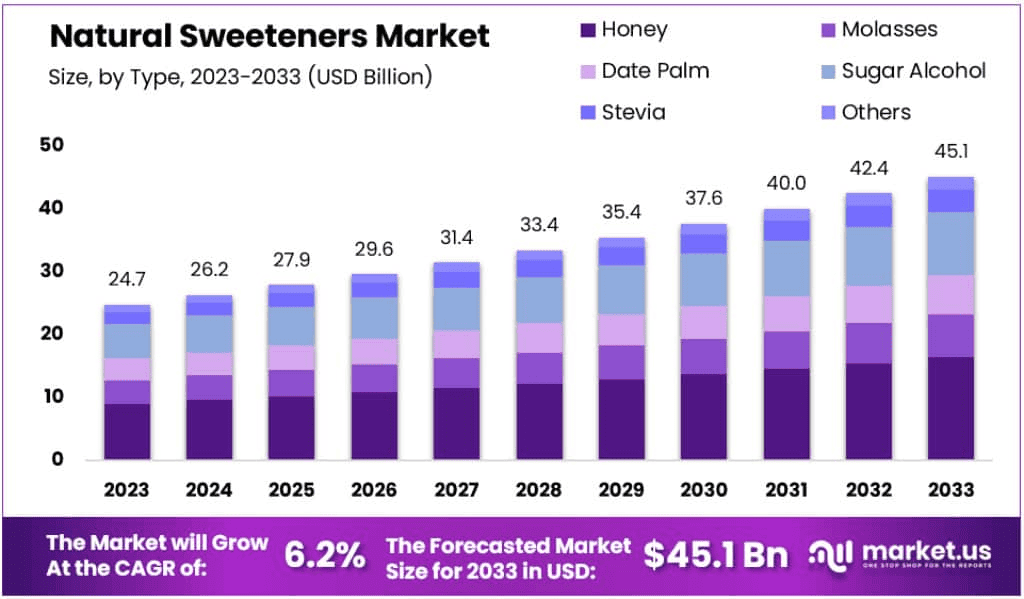
- By 2025, the natural sweeteners market is projected to reach about USD 27.9 billion, increasing further to roughly USD 29.6 billion in 2026.
- Driven by rising demand for honey, stevia, date palm, and sugar alcohols, the market is forecast to expand at a CAGR of 6.2%.
- By 2033, the overall market value is expected to climb to approximately USD 45.1 billion.
Global Sugar Consumption Trend
(Source: webapi.czapp.com)
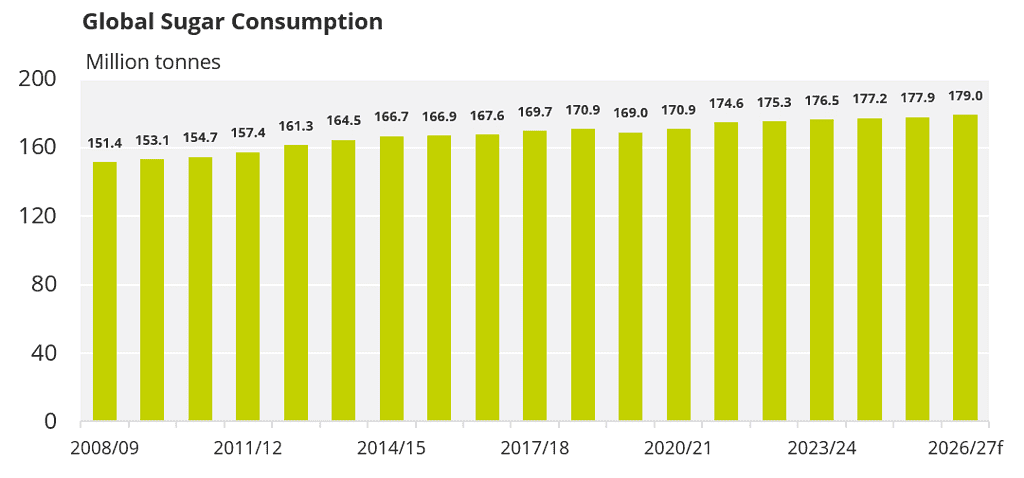
- In 2025, global sugar consumption is about 177.3 million tonnes, equivalent to roughly USD 177.3 billion at USD 1,000 per tonne.
- In 2026, consumption rises to 177.9 million tonnes, or about USD 177.9 billion.
- By 2027, it is projected at 179.0 million tonnes, around USD 179.0 billion.
Global Sugar Production
(Source: webapi.czapp.com)
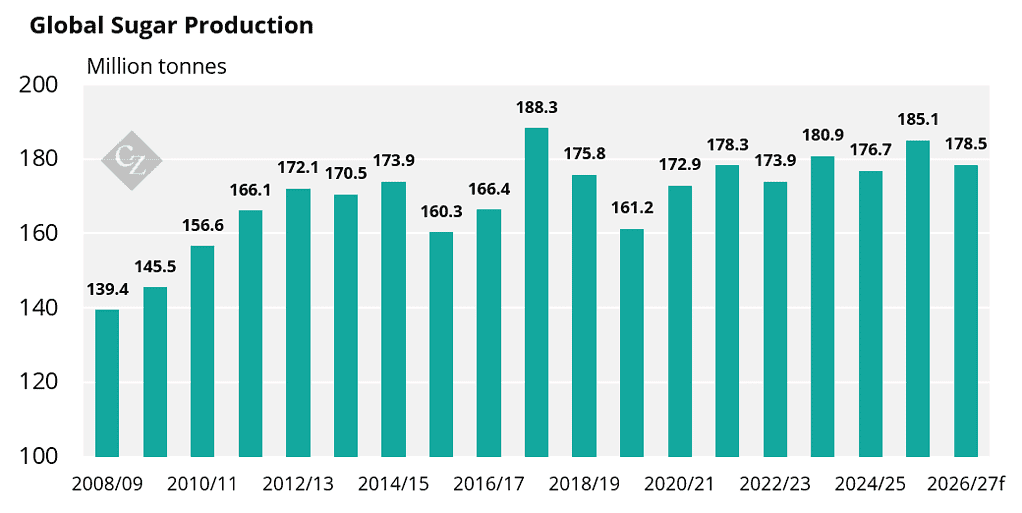
- In 2025, global sugar production is around 176.7 million tonnes, equal to about USD 176.7 billion at USD 1,000 per tonne.
- In 2026, output increases to 185.1 million tonnes, or roughly USD 185.1 billion.
- For 2027, production is projected at 178.5 million tonnes, nearly USD 178.5 billion.
Global Sugar Production Surplus/Deficit
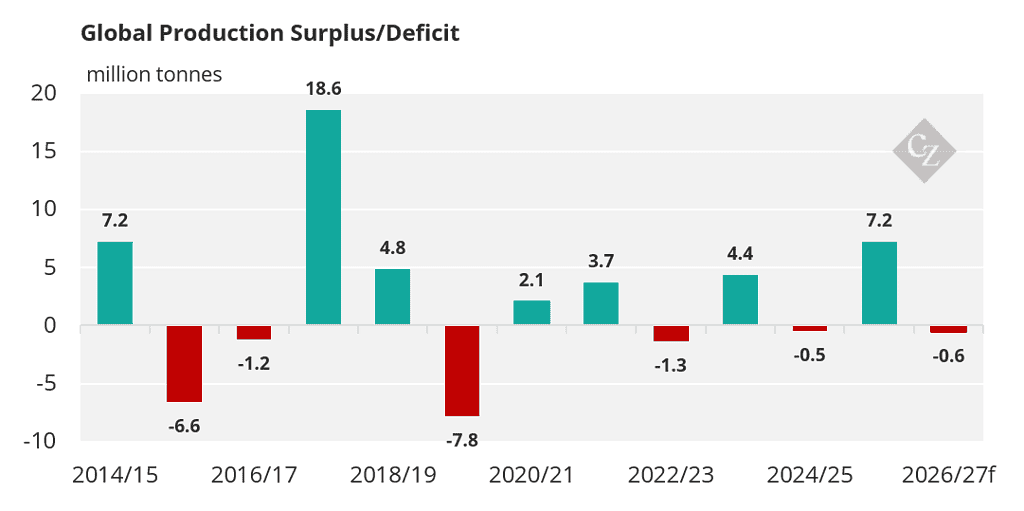
(Source: webapi.czapp.com)
- In 2025, the global sugar market shows a surplus of 7.2 million tonnes (about USD 7.2 billion), followed by a small deficit of 0.5 million tonnes (around USD 0.5 billion) in 2026.
- For 2027, the deficit is projected at 0.6 million tonnes (roughly USD 0.6 billion).
Average Daily Sugar Intake by Country
- According to Market.us Media, Mexico records the highest daily sugar intake, with about 135 grams per person, accounting for around 23% of total sugar consumption among these five countries.
- The United States follows at roughly 126 grams per person per day, representing close to 21% of the group’s sugar use.
- Brazil shows an average of about 117 grams per person daily, contributing nearly 20% of combined consumption.
- Argentina’s intake is around 116 grams per person per day, equal to about 19% of the total.
- Australia has a lower but still high level, at approximately 103 grams of sugar per person per day, accounting for roughly 17% of this sample’s sugar consumption.
Dietary Sugar Consumption by Age Group
| Age Group (years) | Added sugar (teaspoons/day) | Added sugar (grams/day) |
| 10-20 | 19-22 | 76-88 |
| 21-30 | 18-25 | 72-100 |
| 31-40 | 17-24 | 68-96 |
| 41-50 | 16-22 | 64-88 |
| 51-60 | 15-21 | 60-84 |
| 60 and above | 14-20 | 56-80 |
Top Sources of Added Sugar in Daily Diets
| Source | Children 2 to 18 | Adults 19+ |
| Sweetened beverages (excluding coffee & tea) | 32.9% | 34.1% |
| Cookies & brownies | 6.7% | 5.1% |
| Ready-to-eat cereals | 5.5% | 2.3% |
| Candy (chocolate and non-chocolate) | 8% | 5.8% |
| Ice cream and frozen dairy desserts | 4.9% | 4.2% |
| Cakes & pies | 4.5% | 5.8% |
| Jams, syrups, honey, toppings | 3.6% | 5% |
| Coffee & tea | 5.2% | 8.2% |
| Doughnuts, pastries | 3.4% | 2.3% |
Health Impact of Excessive Sugar Consumption
- Consuming more than 25% of daily calories from added sugar is associated with a 200% higher risk of obesity.
- According to Healthline, regular intake of sugar‑sweetened beverages can raise type 2 diabetes risk by about 26%, and cardiovascular disease risk by roughly 38%.
- High added sugar diets increase non‑alcoholic fatty liver disease risk by around 40%-50%, and are linked to a 10%-20% higher risk of certain cancers.
- Excessive sugar intake contributes to very high dental caries prevalence, affecting an estimated 60%-90% of school‑age children worldwide.
Dietary Sugar Recommendations and Guidelines
- The World Health Organization recommends that added sugars provide less than 10% of total daily energy intake. For greater health benefits, it advises reducing added sugar intake to below 5%.
- The Dietary Guidelines for Americans recommend that added sugars make up no more than 10% of total daily calorie intake.
- The European Food Safety Authority also advises limiting added sugars to 10% or less of total daily energy intake.
- In the United Kingdom, adults and children aged 2 years and older are advised to keep free sugars below 5% of their total daily energy intake. Canada also provides similar guidance on reducing sugar intake.
- The American Heart Association recommends stricter daily limits, advising women to consume no more than 6 teaspoons (25 grams) of added sugar per day and men no more than 9 teaspoons (38 grams) per day to support better heart health, according to health.heart.org.
Sugar Alternatives and Sweetener Statistics
- According to a report published by the U.S. Food and Drug Administration, Aspartame is approximately 200 times sweeter than regular table sugar.
- Stevia, a natural sweetener from the Stevia rebaudiana plant, is up to 300 times sweeter than sucrose and contains 0 calories.
- Sucralose is about 600 times sweeter than sucrose and also provides 0 calories.
- Erythritol, a sugar alcohol, is about 60%-80% as sweet as sucrose and contains only a small amount of calories.
- Monk fruit extract is up to 250 times sweeter than sucrose and contains 0 calories.
- Saccharin provides a sweetness level that is approximately 300-400 times greater than sucrose.
- Xylitol is about as sweet as sucrose but provides around 40% fewer calories.
- Agave nectar is about 85% as sweet as sucrose, while coconut sugar is 70%-79% as sweet.
- Sorbitol is about 50%-60% as sweet as sucrose and contains fewer calories than regular sugar.
Consumer Behavior and Awareness, 2026
- Amra and Elma’s report also mentioned that around 40% of adults in the United States consume sugar‑sweetened beverages every day. In comparison, 63% of U.S. adults report drinking them at least once daily.
- The average American takes about 17 teaspoons (71.14 grams) of added sugar per day, far above recommended limits.
- Survey data indicate that roughly 72% of consumers are now looking to limit or avoid sugar altogether, reflecting rising health awareness and label scrutiny.
- Globally, average sugar consumption is about 17 kilograms per person per year, with some countries exceeding 40 kilograms per person annually.
Bottom Line
Sugar is a part of many everyday foods, but eating too much can harm your health over time. High sugar intake is linked to weight gain, type 2 diabetes, heart disease, and tooth decay. Choosing whole foods, cutting back on sugary drinks, and checking food labels can help reduce added sugar. Small changes in your daily diet can make a big difference and support better health in the long run.
FAQ
Natural sugar occurs naturally in fruits and dairy, while added sugar is added during processing, cooking, or food preparation.
Limit added sugar to under 10% of your daily calorie intake.
Foods highest in added sugar include soft drinks, candies, pastries, sweetened cereals, flavored yogurt, desserts, and sugary coffee drinks.

Sources