Microsoft delivered a strong FY26 Q3, reporting diluted EPS of $4.27 (beat est. $4.04-$4.07) and revenue of $82.9 billion (+18% YoY, beat est. ~$81.4B). Shares fell approximately 1.8%-2% in after-hours trading on April 29, 2026, as Q4 guidance midpoint slightly trailed consensus expectations.
About Microsoft Corporation
Microsoft Corporation (Nasdaq: MSFT), founded in 1975 and headquartered in Redmond, Washington, is one of the world’s largest technology companies, designing and selling software, cloud platforms, devices, and AI solutions. The company’s flagship offerings span the Azure cloud platform, Microsoft 365 productivity suite, LinkedIn, Dynamics 365, Xbox, and the Bing/Copilot AI ecosystem.
As of April 30, 2026, Microsoft’s market capitalization stood at approximately $3.15 trillion, with a trailing P/E ratio of 26.55, a forward dividend yield of approximately 0.86%, and a global workforce of roughly 228,000 employees. The company has been a central beneficiary of enterprise AI adoption, with its AI business surpassing an annual revenue run rate of $37 billion – up 123% year-over-year.
Top Financial Highlights
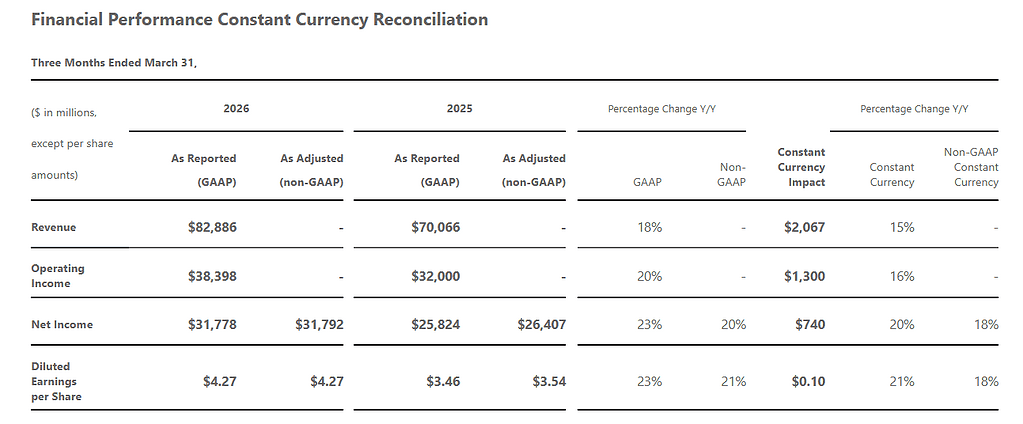
- Total revenue reached $82.9 billion, reflecting an 18% year over year increase and 15% growth in constant currency.
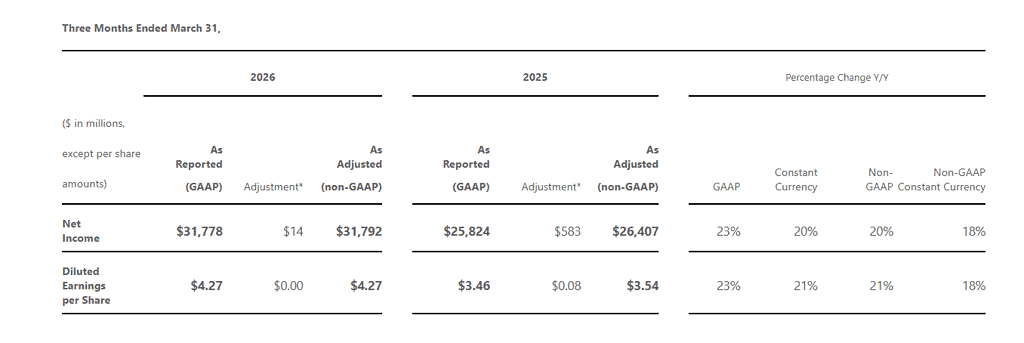
- Net income on a GAAP basis was $31.78 billion, showing a 23% increase compared to the previous year.
- Diluted EPS on a GAAP basis stood at $4.27, up 23%, while non GAAP EPS also reached $4.27, increasing by 21%.
- Gross margin was reported at $56.06 billion, representing an approximate margin rate of 67.6%.
- Operating income reached $38.4 billion, reflecting a 20% year over year increase.
- Operating cash flow was strong at $46.68 billion for the quarter.
- Microsoft Cloud revenue reached $54.5 billion, showing a 29% increase year over year.
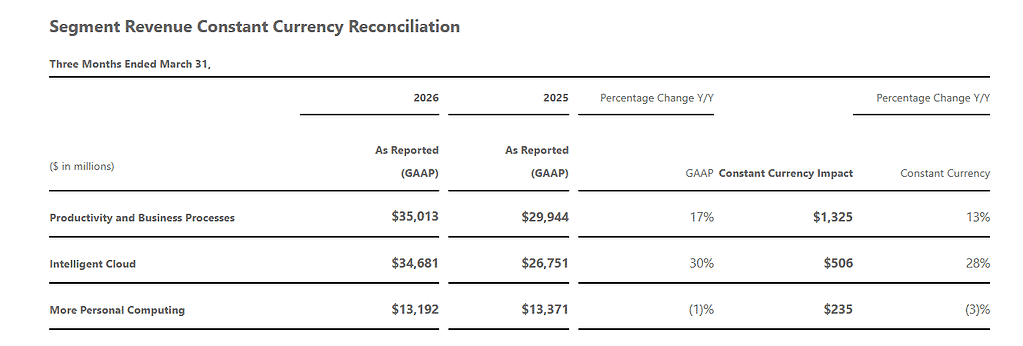
- Intelligent Cloud revenue was $34.68 billion, rising 30%, with Azure growing by 40%.
- Productivity and Business Processes revenue reached $35.01 billion, increasing by 17% year over year.
- More Personal Computing revenue stood at $13.19 billion, showing a 1% decline compared to the previous year.
- Commercial remaining performance obligation reached $627 billion, reflecting a 99% increase year over year.
- Cash, cash equivalents, and short term investments totaled $78.27 billion.
- Q4 FY2026 revenue guidance is expected in the range of $86.7 billion to $87.8 billion, indicating 13% to 15% growth.
- Capital expenditures for the full year FY2026 are projected at $190 billion.
Beat or Miss?
| Metric | Reported | Estimated (Consensus) | Difference/Analysis |
| Total Revenue | $82.9B | ~$81.4B | Beat by ~$1.5B (+1.8%) |
| Diluted EPS (non-GAAP) | $4.27 | $4.04-$4.07 | Beat by $0.20-$0.23 (+4.97%-5.7%) |
| Intelligent Cloud Revenue | $34.68B | $34.27B | Beat by ~$0.41B |
| Productivity & Business Processes | $35.01B | $34.43B | Beat by ~$0.58B |
| Azure Growth (YoY) | 40% | ~38%-39% | Beat by ~1-2 points |
| Q4 FY26 Revenue Guidance (midpoint) | $87.25B | $87.53B | Slightly missed by ~$280M |
| Net Margin | ~38.3% | N/A | Up from 36.9% in Q3 FY25 |
What Leadership Is Saying?
“We are focused on delivering cloud and AI infrastructure and solutions that empower every business to eval-max their outcomes in the agentic computing era. Our AI business surpassed an annual revenue run rate of $37 billion, up 123% year-over-year.” – Satya Nadella, Chairman and Chief Executive Officer
“We delivered results that exceeded expectations across revenue, operating income, and earnings per share, reflecting strong execution and growing demand for the Microsoft Cloud.” – Amy Hood, Executive Vice President and Chief Financial Officer
Historical Performance: Microsoft YoY
The table below compares Microsoft’s Q3 FY2026 (quarter ended March 31, 2026) against Q3 FY2025 (quarter ended March 31, 2025).
| Category | Q3 FY2026 | Q3 FY2025 | Change (%) |
| Total Revenue | $82.89B | $70.07B | 18.30% |
| Net Income | $31.78B | $25.82B | 23.10% |
| Operating Income | $38.40B | $32.00B | 20.00% |
| Gross Margin | $56.06B | $48.15B | 16.40% |
| Operating Expenses (R&D + S&M + G&A) | $17.66B | $16.15B | 9.40% |
| Diluted EPS | $4.27 | $3.46 | 23.40% |
| Operating Cash Flow | $46.68B | $37.04B | 26.00% |
Competitor Comparison: Big Tech Q1 CY2026
The following table compares Microsoft (fiscal Q3, ended March 31, 2026) against Alphabet and Amazon for the same calendar quarter (Q1 2026, ended March 31, 2026), and their respective prior-year results for the same period.
| Company / Metric | Q1 CY2026 Revenue | Q1 CY2025 Revenue | Change (%) | Q1 CY2026 Net Income | Q1 CY2025 Net Income | Change (%) |
| Microsoft (MSFT) | $82.9B | $70.1B | 18% | $31.78B | $25.82B | 23% |
| Alphabet (GOOGL) | $109.9B | ~$90.2B | 22% | $62.58B | ~$34.5B | 81% |
| Amazon (AMZN) | $181.5B | $155.7B | 17% | $30.26B | $17.1B | 77% |
Cloud Segment Spotlight (Q1 CY2026 YoY):
| Cloud Platform | Q1 CY2026 Revenue | YoY Growth |
| Microsoft Azure (within Intelligent Cloud $34.7B) | N/A disclosed separately | 40% |
| Google Cloud | $20.03B | 63% |
| AWS (Amazon Web Services) | $37.59B | 28% |
How the Market Reacted?
Microsoft shares closed at $424.46 on April 29, 2026, down 1.12% during regular trading hours, reflecting a year-to-date decline of approximately 12% heading into the earnings release. Despite beating estimates on both the top and bottom lines, MSFT fell approximately 1.8%-2% in extended trading after the results, as investors focused on the slightly below-consensus Q4 guidance midpoint of $87.25 billion versus the $87.53 billion Street estimate.
The outlook for operating margin compression to roughly 44% in Q4 (from 46.3% in Q3) and the announcement of $190 billion in full-year 2026 capital expenditures also tempered enthusiasm. The after-hours reaction was notably muted given the degree of earnings beats, reflecting a broader investor sentiment shift toward demanding not just solid results but forward execution clarity on AI monetization and margin preservation.
