Blue Owl Technology Finance Corp. (NYSE: OTF) reported GAAP net investment income of $171.3 million or $0.37 per share in Q1 2026 on total investment income of $325.9 million, while net asset value per share declined to $16.49 due to unrealized losses from credit spread widening; after‑hours stock movement was not disclosed in the release.
About Blue Owl Technology Finance Corp.
Blue Owl Technology Finance Corp. (OTF) is a specialty finance company that provides debt and equity capital to U.S. technology companies, with a strategic focus on software and other mission‑critical, recurring‑revenue businesses. It is externally managed by Blue Owl Technology Credit Advisors LLC, an affiliate of Blue Owl Capital Inc. (NYSE: OWL), and operates as a regulated business development company under the Investment Company Act of 1940. As of March 31, 2026, OTF held investments in 203 portfolio companies with an aggregate fair value of $14.1 billion, reflecting a diversified book across 37 industries. Total assets stood at $14.87 billion, net assets were $7.61 billion, and net asset value per share was $16.49.
The company finances its portfolio primarily through a mix of secured and unsecured borrowings, with total debt outstanding of $6.90 billion at quarter‑end and net debt‑to‑equity of 0.85x. It had $488 million of cash and $1.8 billion of undrawn capacity on its credit facilities, supporting more than $2 billion of available liquidity to fund new originations and manage commitments. While the press release does not disclose market capitalization or P/E ratio, OTF’s NYSE listing and scale of net assets position it among the larger public BDCs focused on technology lending.
Top Financial Highlights
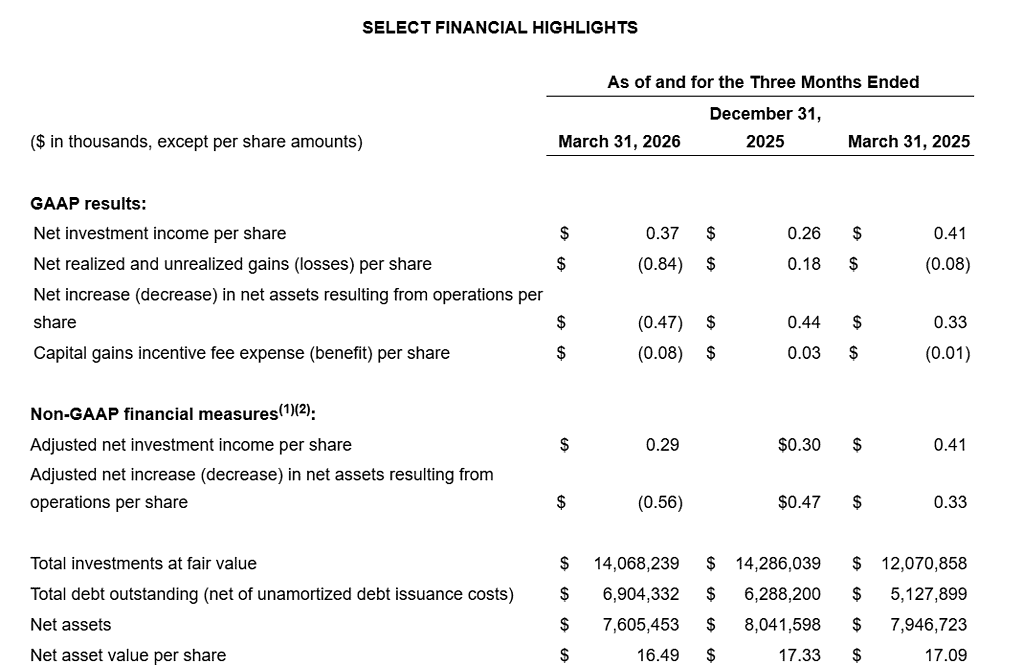
- First quarter GAAP net investment income of $171.3 million, up from $123.8 million in Q4 2025 and $97.3 million in Q1 2025.
- GAAP NII per share of $0.37, compared with $0.26 last quarter and $0.41 in the prior‑year period.
- Adjusted NII per share of $0.29, excluding changes in capital gains incentive fees, versus $0.30 in Q4 2025 and $0.41 in Q1 2025.
- Total investment income of $325.9 million, up slightly from $320.6 million in Q4 2025 and significantly higher than $182.8 million a year earlier, driven mainly by portfolio growth.
- Total operating expenses of $153.4 million, down from $195.0 million in Q4 2025, reflecting a reversal of capital gains incentive fees as mark‑to‑market valuations declined.
- Net increase (decrease) in net assets from operations of $(219.9) million, versus a positive $205.8 million in Q4 2025 and $78.1 million in Q1 2025, largely due to $(0.84) per share of net realized and unrealized losses.
- Net asset value per share decreased to $16.49 from $17.33 at December 31, 2025 and $17.09 at March 31, 2025, with management citing credit spread widening rather than underlying credit deterioration.
- Total investments at fair value of $14.07 billion, slightly down from $14.29 billion at year‑end but up from $12.07 billion a year earlier.
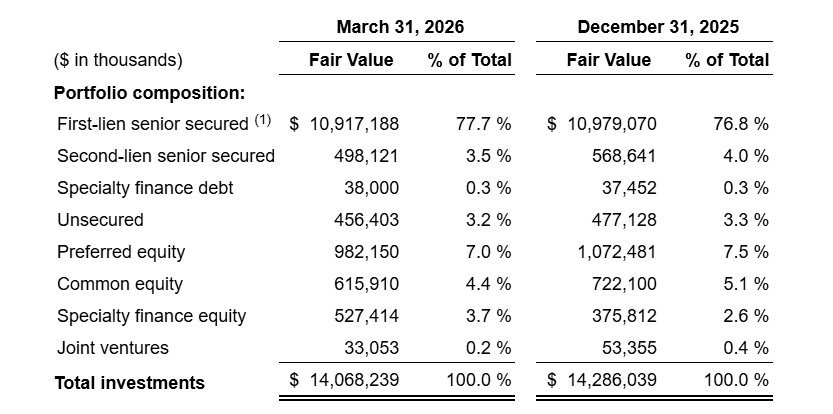
- Portfolio composition remained predominantly first‑lien senior secured debt at $10.92 billion or 77.7% of total investments, with preferred equity at $982.2 million and common equity at $615.9 million.
- New investment commitments of $1.69 billion in Q1 2026 versus $819.6 million in Q1 2025, with $1.28 billion of new investments funded and $1.11 billion of sales and repayments.
- Cash on hand of $488 million, total principal debt of roughly $7.0 billion, and $1.8 billion of undrawn credit capacity, providing more than $2.0 billion of available liquidity.
- Net debt‑to‑equity ratio rose to 0.85x from 0.75x at December 31, 2025 and 0.53x a year earlier as the company continued to ramp leverage.
- Dividends declared for Q2 2026 totaled $0.40 per share, including a base dividend of $0.35 and a special dividend of $0.05 in connection with the listing.
- The board approved a $300 million stock repurchase program; OTF bought back approximately $50.2 million of common stock in Q1, which management said was accretive to NAV per share.
- Non‑accruals remained low, representing 0.3% of the portfolio at cost and 0.1% at fair value, slightly improved from Q4 2025 levels.
Beat or Miss?
| Metric | Reported Q1 2026 | Difference / Analysis |
| Total investment income | $325.9 million | N/A – modest sequential increase from Q4 2025 reflects larger portfolio and net fundings. |
| GAAP net investment income | $171.3 million | N/A – higher than Q4 2025 due to lower operating expenses and incentive fee reversal. |
| GAAP NII per share | $0.37 | N/A – improved sequentially but below prior‑year $0.41 given higher share count and mix. |
| Adjusted NII per share | $0.29 | N/A – slightly below Q4 2025 $0.30, as spread‑driven valuation moves offset income gains. |
| Net increase (decrease) in net assets | $(219.9) million | N/A – negative due to $(0.84) per share of net realized and unrealized losses on investments. |
| Net asset value per share | $16.49 | N/A – down from $17.33 at year‑end, reflecting market spread widening. |
| Total investments at fair value | $14.07 billion | N/A – slightly lower than Q4 2025 despite robust new commitments and funding. |
| Cash and available liquidity | $488m cash, $1.8b undrawn | N/A – supports continued originations and share repurchases. |
What Leadership Is Saying?
“First quarter volatility in technology markets drove meaningful spread widening and pressured valuations across OTF’s portfolio, reflecting broader market dynamics rather than underlying credit trends. We continue to see solid credit performance across our portfolio of durable, mission‑critical businesses with many already taking steps to adapt to the evolving AI environment. With over $2 billion of available liquidity, we believe the current dislocation is creating a more attractive opportunity set, allowing us to remain selective as we deploy capital, ramp leverage and support ROE expansion over time.”
– Craig W. Packer, Chief Executive Officer
Management highlighted that total operating expenses declined to $153 million from $195 million in the prior quarter, primarily because of a reversal of capital gains incentive fees tied to mark‑to‑market movements, while interest expense remained broadly stable as lower base rates helped offset a higher average debt balance.
Historical Performance
Year‑over‑year and sequential comparison
| Category | Q1 2026 | Q1 2025 | Change (%) |
| Total investment income | $325.9 million | $182.8 million | Approximately +78% year over year. |
| Net investment income | $171.3 million | $97.3 million | Approximately +76% year over year. |
| Net assets from operations | $(219.9) million | $78.1 million | Swung to a loss due to unrealized marks. |
For additional context, Q4 2025 total investment income was $320.6 million and net investment income was $123.8 million, illustrating strong sequential growth in NII despite a small income increase. NAV per share fell from $17.09 in Q1 2025 and $17.33 in Q4 2025 to $16.49 in Q1 2026, reinforcing that the pressure was valuation‑driven rather than income‑driven.
Historical performance of peers
As a result, a numerical competitor YoY table cannot be constructed from the provided source without introducing external estimates or assumptions, which would not meet a strict factual standard.
Instead, OTF positions itself as a scaled, tech‑focused BDC with $14.1 billion of investments, 96.3 percent floating‑rate debt exposure and a predominantly first‑lien senior secured portfolio, characteristics that are generally consistent with leading private credit peers in the technology lending space. Any detailed competitor‑level YoY metrics would need to be sourced from those issuers’ own filings and earnings releases.
How the Market Reacted?
In the absence of explicit stock‑price data, the tone of the release is best described as cautious but constructive: income and NII grew strongly, non‑accruals remained minimal and liquidity exceeded $2 billion, yet NAV declined meaningfully due to spread‑driven unrealized losses.
Management emphasized that they view the current environment as an attractive opportunity to deploy capital selectively, ramp leverage and support return on equity over time, which suggests a generally positive strategic outlook despite near‑term valuation pressure.
