
Ryerson (NYSE: RYZ) reported Q1 2026 revenue of $1.57 billion, up 37.9% year-over-year, fueled by its merger with Olympic Steel. Diluted EPS came in at $0.10 (GAAP) and $0.30 (adjusted), beating the FactSet consensus of $0.28. Stock gained approximately 2.19% on the day of the earnings release.
About Ryerson Holding Corporation
Ryerson Holding Corporation (NYSE: RYZ) is a leading value-added processor and distributor of industrial metals, headquartered in Chicago, Illinois. Founded in 1842, the company processes and distributes products in stainless steel, aluminum, carbon steel, and alloy steels across the United States, Canada, Mexico, and China. Following its February 13, 2026 merger with Olympic Steel, Ryerson operates approximately 160 locations with around 6,400 employees, positioning itself as North America’s second-largest metals service center.
The company serves end-markets including oil and gas, industrial equipment, transportation, and heavy equipment, and offers value-added services such as laser cutting, roll forming, stamping, and tube manufacturing. As of the Q1 2026 earnings date, Ryerson carried a market capitalization of approximately $889 million to $957 million, a dividend yield of approximately 2.66% to 2.7%, and trailing twelve-month revenue of $4.57 billion.
Top Financial Highlights
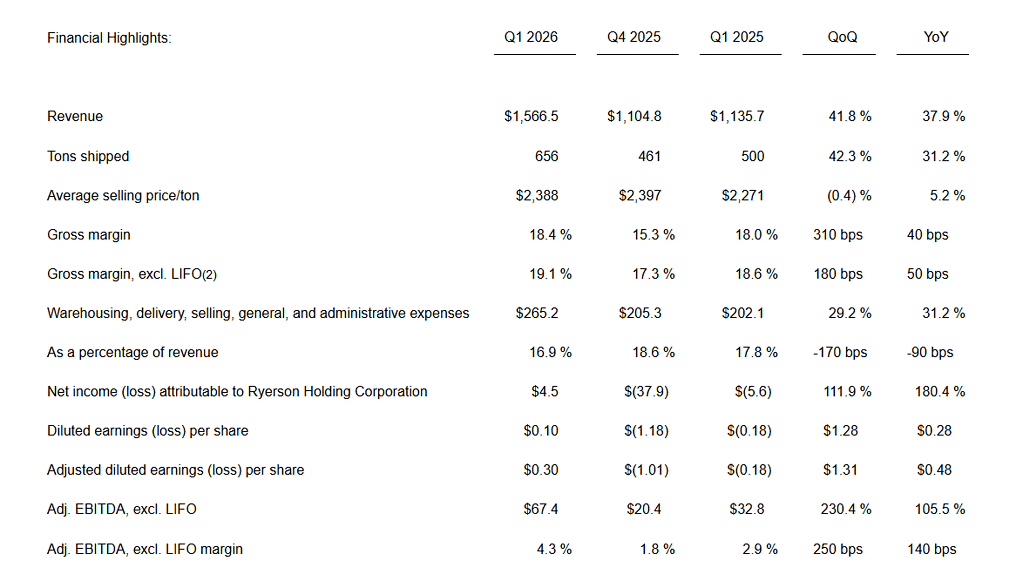
- Total Q1 2026 revenue reached $1,566.5 million, increasing 37.9% year over year and 41.8% sequentially.
- Same-store revenue, excluding Olympic Steel, totaled $1.29 billion, rising 13.9% compared to the prior year.
- Net income attributable to the company was $4.5 million, improving from a net loss of $5.6 million in Q1 2025.
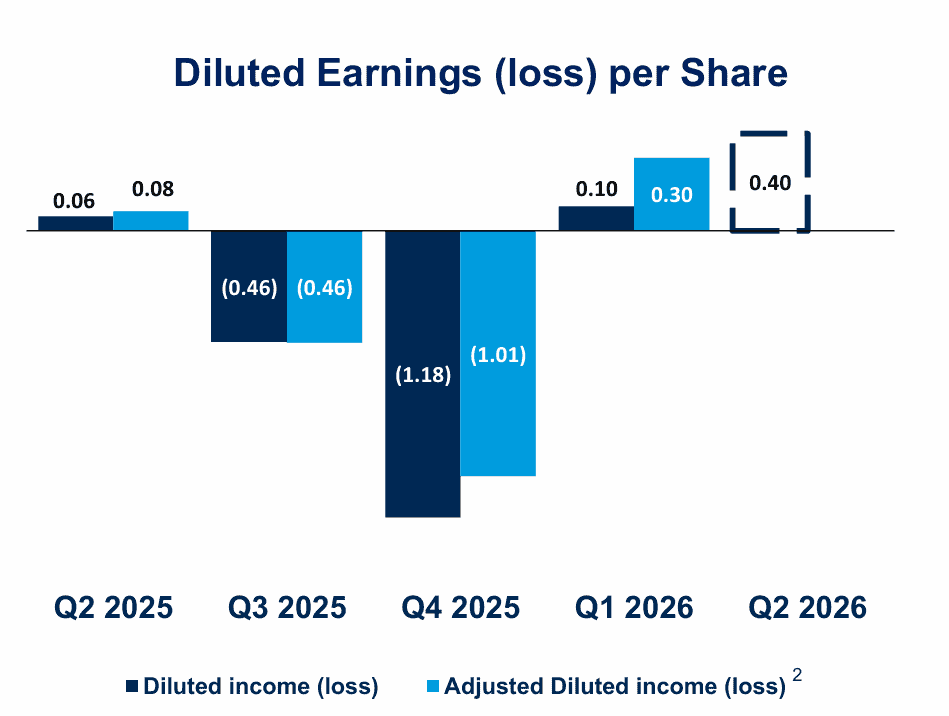
- GAAP diluted EPS was $0.10 per share, compared to a loss of $0.18 per share in the prior-year quarter.
- Adjusted diluted EPS reached $0.30 per share, improving from a loss of $0.18 per share in Q1 2025.
- Gross margin expanded to 18.4%, improving by 310 basis points sequentially and 40 basis points year over year.
- Adjusted EBITDA excluding LIFO was $67.4 million, more than doubling from $32.8 million in Q1 2025.
- Tons shipped totaled 656,000 tons, increasing 31.2% year over year and 42.3% sequentially.
- Olympic Steel contributed $272.7 million in net sales and $12.5 million in adjusted EBITDA during the final six weeks of the quarter.
- Operating cash flow reflected a use of $179.2 million, primarily related to merger costs and seasonal working capital requirements.
- Cash and cash equivalents stood at $25.1 million as of March 31, 2026.
- Total debt increased to $907.7 million, compared to $463.1 million at year-end 2025, mainly due to acquisition-related financing and merger expenses.
- Q2 2026 net sales guidance is projected between $1.86 billion and $1.93 billion.
- Q2 2026 net income guidance is expected in the range of $20 million to $22 million, or $0.38 to $0.42 per diluted share.
- Dividends paid during Q1 totaled $9.7 million, while a Q2 2026 dividend of $0.1875 per share has been declared.
Beat or Miss?
| Metric | Reported | Estimated (FactSet/Consensus) | Difference / Analysis |
| Revenue | $1,566.5M | $1,720M | Missed estimate; same-store basis was $1.29B, in-line with prior guidance of $1.26B-$1.30B |
| Adjusted Diluted EPS | $0.30 | $0.28 | Beat by $0.02 |
| GAAP Diluted EPS | $0.10 | N/A | Swing from loss of $0.18 in Q1 2025 |
| Adj. EBITDA (excl. LIFO) | $67.4M | $63M-$67M (prior guidance) | Above guidance range top end |
| Gross Margin | 18.4% | ~17%-18% (prior guidance implied) | Expanded meaningfully from 15.3% in Q4 2025 |
| LIFO Expense | $10.0M | $6M-$8M (guidance) | Slightly above guidance |
What Leadership Is Saying?
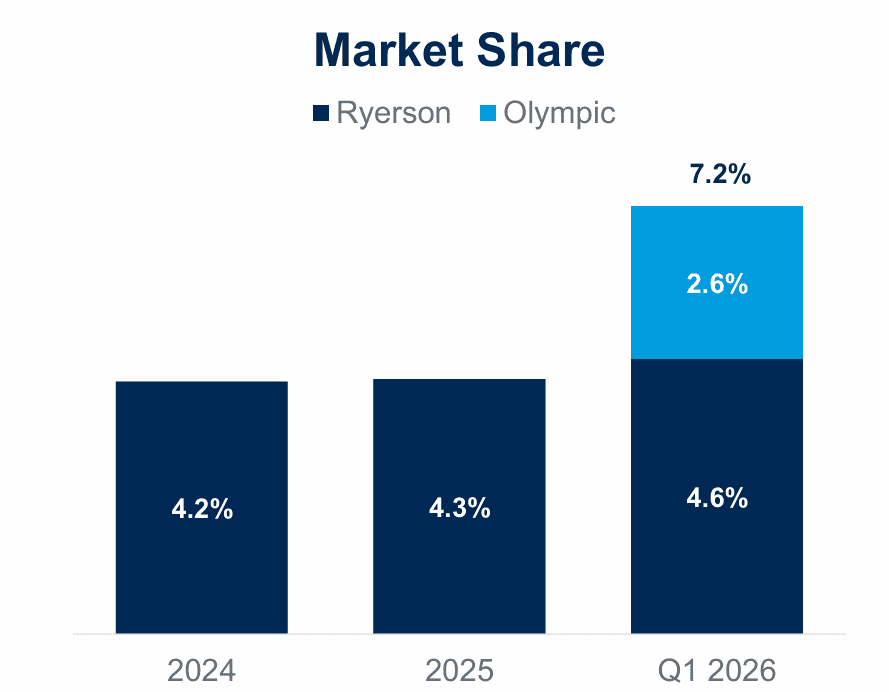
“Our first quarter results reflect a promising start to 2026 with sequential and year-over-year improvement in shipments, margins, and profitability within a notably better industrial market backdrop relative to the past two years while establishing excellent early integration and synergy momentum with Olympic Steel. While the current market environment continues to be characterized by a myriad of riptides and cross-currents, quote and order activity increased meaningfully through the quarter both sequentially and year-over-year, particularly in our transactional book of business. We gained market share on a same-store and combined-company basis while seeing more and more of the benefits from the growth capex investments we have discussed with stakeholders over the past several years.”
Eddie Lehner, CEO and Director
“In this environment, we executed well in support of service center fundamentals with disciplined pricing and inventory management strategies to support margin expansion, a lean cash conversion cycle, and Adjusted EBITDA, excl. LIFO attainment above our guidance range. And, importantly, with only six weeks together before the end of the quarter, we made meaningful progress on the integration of Olympic Steel and are encouraged by the early traction in capturing synergies, advancing commercial alignment, and leveraging our combined scale to better serve our customers.”
Rick Marabito, President and COO
Historical Performance
| Category | Q1 2026 | Q1 2025 | Change (%) |
| Revenue | $1,566.5M | $1,135.7M | 37.90% |
| Net Income (Loss) | $4.5M | $(5.6)M | 180.40% |
| Warehousing, Delivery, SGA Expenses | $265.2M | $202.1M | 31.20% |
| Gross Margin | 18.4% | 18.0% | +40 bps |
| Adjusted EBITDA (excl. LIFO) | $67.4M | $32.8M | 105.50% |
| Tons Shipped | 656K tons | 500K tons | 31.20% |
| Avg. Selling Price per Ton | $2,388 | $2,271 | 5.20% |
| Diluted EPS | $0.10 | $(0.18) | $0.28 |
Competitor Historical Performance
The following compares select metals distribution and service center peers for Q1 2026 versus Q1 2025:
| Company | Q1 2026 Revenue | Q1 2025 Revenue | Change (%) | Q1 2026 Net Income | Q1 2025 Net Income | Change (%) |
| Ryerson (RYZ) | $1,566.5M | $1,135.7M | 37.90% | $4.5M | $(5.6)M | 180.40% |
| Reliance, Inc. (RS) | $4,026M | $3,485M (est. derived) | +15.5% | $264.9M | $199.6M (est. derived) | +32.7% |
| Steel Dynamics (STLD) | $5,204.9M | ~$4,800M | +8.4% | $403.4M | $217M | +85.9% |
| Metallus | $308.3M | $280.5M | +9.9% | $5.4M | $1.3M | +315.4% |
How the Market Reacted?
Ryerson’s stock (NYSE: RYZ) closed up 2.19% to $28.51 on the day of the earnings announcement (May 6, 2026), with shares reaching a daily high of $29.03 during the session. In after-hours trading, shares edged slightly lower to $28.35, a dip of 0.56%, as investors digested the revenue miss versus the FactSet estimate of $1.72 billion despite the adjusted EPS beat. The overall sentiment leaned moderately bullish, supported by the return to profitability, strong Q2 guidance of $1.86 billion to $1.93 billion in net sales, and the Board’s new $100 million share repurchase authorization through April 2028.
