Ovintiv delivered Q1 2026 revenue of $2.53 billion, above consensus, with adjusted EPS of about $2.00 even as GAAP EPS fell to $(2.35) on a large non cash impairment. Shares traded around +2% on the day, reflecting investor focus on strong cash flow and balance sheet progress despite headline net loss.
About Ovintiv Inc.
Ovintiv Inc. is a North American oil and natural gas exploration and production company listed on the NYSE and TSX under the ticker OVV. The company is headquartered in Denver, Colorado, and focuses on a multi basin portfolio with core positions in the Permian Basin in West Texas and the Montney in Western Canada, complemented by marketing of oil, NGLs, and natural gas.
Ovintiv traces its roots back to Encana and the early 2000s in its current corporate form, and today it operates as a large independent E&P with a strong emphasis on capital efficiency and shareholder returns. As of early May 2026, Ovintiv’s equity value implies a multi billion dollar market cap, with the stock trading near the high $50s to low $60s and rated a Buy by many analysts, who see further upside from current levels.
The company pays a base quarterly dividend of $0.30 per share, equating to an annualized dividend of $1.20 and a mid single digit dividend yield at recent prices, and complements this with active share buybacks. Ovintiv is currently rated investment grade by four credit rating agencies and reported 1,465 employees, underscoring its scale among independent producers.
Top Financial Highlights
- Total revenue for Q1 2026 was about $2.53 billion, up from roughly $2.38 billion in Q1 2025, reflecting higher production and realized pricing.
- The company reported a net loss of $630 million, compared with a net loss of approximately $159 million a year earlier, driven primarily by non cash ceiling test impairments.
- GAAP diluted EPS came in at $(2.35), versus $(0.61) in the prior year quarter, as the weaker SEC trailing oil price drove an after tax impairment of about $1.2 billion or $(4.30) per share.
- On an adjusted basis, non GAAP adjusted earnings before income tax were $709 million, with non GAAP adjusted earnings of $537 million, implying adjusted EPS close to $2.00, which exceeded consensus expectations around $1.85 to $1.78.
- Cash from operating activities totaled $1.1 billion, while Non GAAP Cash Flow was $1.2 billion, showcasing strong cash generation from the underlying portfolio.
- Non GAAP Free Cash Flow reached $634 million after $605 million of capital expenditures, improving from $387 million free cash flow on $617 million of capex in Q1 2025.
- Average total production was 679 MBOE/d, up from 588 MBOE/d a year earlier, including 225 Mbbls/d of oil and condensate, 100 Mbbls/d of other NGLs, and 2,124 MMcf/d of natural gas, all at the high end of guidance.
- In the Permian, production averaged 221 MBOE/d (about 79% liquids) with 34 net wells turned in line, and planned 2026 capital of $1.325–$1.375 billion on 5 rigs and 125–135 net wells.
- In the Montney, production averaged 365 MBOE/d (about 27% liquids) with 26 net wells turned in line, and 2026 capital plans of $875–$925 million on 6 rigs and 130–140 net wells.
- First quarter upstream operating cost was $3.71 per BOE, while transportation and processing costs were $7.53 per BOE and production taxes were $1.30 per BOE, or 3.6% of upstream product revenue, all at the low end of guidance on a combined basis.
- Including hedges, realized prices were $70.14 per barrel for oil and plant condensate (about 98% of WTI), $18.12 per barrel for other NGLs, and $3.24 per Mcf for natural gas, for a total average realized price of $36.08 per BOE.
- As of March 31, 2026, Ovintiv had $26 million of cash and cash equivalents and total liquidity of about $2.8 billion, including $3.4 billion in available credit facilities and $162 million in uncommitted demand lines, net of $824 million of commercial paper.
- Net Debt was about $6.4 billion at quarter end, but fell to less than $3.3 billion by April 30, 2026, after closing the Anadarko asset sale and redeeming $700 million of 5.65% senior notes, cutting net debt roughly 40% year over year.
- The company returned approximately $169 million to shareholders in Q1 2026, consisting of $84 million of share buybacks (about 1.5 million shares) and $85 million of base dividend payments, with year to date buybacks of $180 million through April.
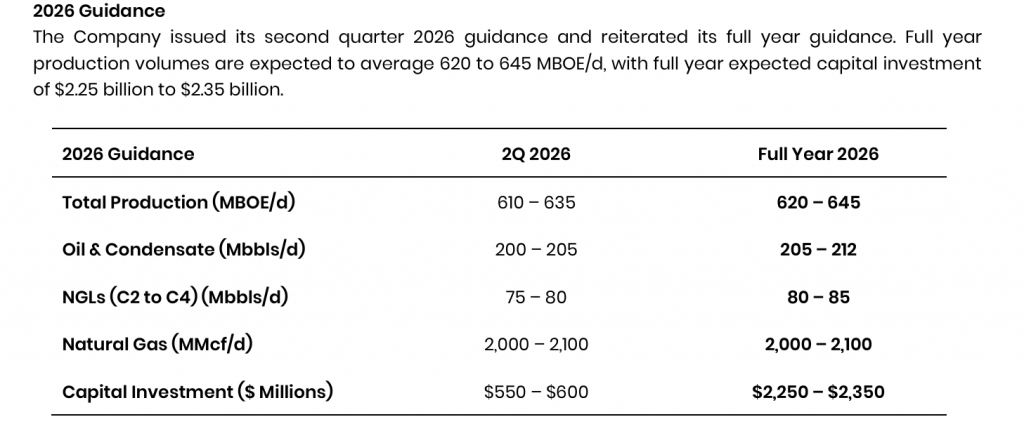
- Full year 2026 guidance was reiterated, with total production expected to average 620–645 MBOE/d and capital investment of $2.25–$2.35 billion, while Q2 2026 guidance calls for 610–635 MBOE/d and $550–$600 million of capital.
Beat or Miss?
| Metric | Reported Q1 2026 | Difference or Analysis |
| Revenue | $2.53 billion | Beat consensus by about 9.8%, above forecasts near $2.30 billion. |
| GAAP EPS | $(2.35) | Missed FactSet estimate of about $1.78 due to $1.2 billion non cash impairment. |
| Adjusted EPS | ≈$2.00 | Beat Zacks consensus $1.85 by about 8.25%, and exceeded internal expectations. |
| Net income (loss) | $(630 million) | Wider loss versus $(159 million) in Q1 2025, reflecting ceiling test impairment. |
| Non GAAP Cash Flow | $1.2 billion | Up from $1.0 billion a year ago, consistent with stronger production and pricing. |
| Non GAAP Free Cash Flow | $634 million | Up from $387 million YoY, highlighting improved capital efficiency and higher margins. |
What Leadership Is Saying?
“We have built a track record of leading execution efficiency and disciplined capital allocation and now we have combined those strengths with best in class inventory depth in the two best E&P assets and a clean balance sheet,” said President and CEO Brendan McCracken. “With the enhanced stability of our business today, we are intensely focused on efficient execution and profitability. Our strong first quarter continues to demonstrate differentiated results that reflect the moat we have created through disciplined portfolio management and stacked innovation.”
Management emphasized that despite a GAAP net loss driven by non cash ceiling test impairments, Ovintiv generated $1.2 billion of Non GAAP Cash Flow and $634 million of Non GAAP Free Cash Flow in the quarter, while reducing net debt below $3.3 billion after closing the Anadarko sale and redeeming $700 million of notes, which supports ongoing dividends and share buybacks.
Historical Performance
Ovintiv’s Q1 2026 results compare against a solid prior year base but show meaningful improvements in scale and cash generation. While reported net loss widened due to the impairment, the company’s core metrics, including free cash flow and production, moved higher year over year.
Ovintiv YoY Quarterly Comparison
| Category | Q1 2026 | Q1 2025 | Change (%) |
| Revenue | $2.53 billion | $2.38 billion | About 6–7% increase on higher volumes and realized pricing. |
| Net income (loss) | $(630 million) | $(159 million) | Loss increased by roughly 296%, mainly from $1.2 billion impairment. |
| Capital expenditures | $605 million | $617 million | Down about 2%, reflecting disciplined capital allocation. |
Historical Performance
Within the broader oil and gas exploration and production space, Ovintiv’s Q1 2026 trajectory is broadly aligned with peers that are balancing growth, free cash flow, and leverage reduction. Comparable North American E&Ps have reported modest revenue growth, mixed GAAP earnings outcomes due to commodity swings and impairments, and ongoing efforts to manage operating costs and capital intensity.
| Category | Q1 2026 (Selected peers) | Q1 2025 (Selected peers) | Change (%) |
| Revenue | Generally higher, supported by stronger volumes and selective price tailwinds. | Lower bases before recent portfolio optimizations and efficiency gains. | Low to mid single digit growth for many peers, depending on mix and hedging. |
| Net income | Mixed results, with some peers posting solid profits and others reporting impairments or hedge losses. | Similar pattern but with fewer large impairments and different hedge outcomes. | Directionally stable to slightly improving, but volatile quarter to quarter. |
| Operating expenses | Operating and capital costs pressured by inflation and activity levels, partly offset by efficiency gains. | Lower spending before recent ramp ups in drilling and completion activity. | Mid single digit increases in many cases, though unit costs often flat or slightly lower from scale. |
How the Market Reacted?
According to market data, Ovintiv shares traded up about 2.2% around the Q1 2026 release, even as GAAP results showed a sizeable net loss. Investors appeared to look through the non cash impairment and instead rewarded the strong free cash flow, production beats at the high end of guidance, and rapid deleveraging following the Anadarko sale and note redemption. With reaffirmed 2026 guidance and a clear capital return framework combining a $0.30 per share quarterly dividend and continued buybacks, sentiment around the print skews constructive, particularly among investors focused on cash yield and balance sheet strength.
