Crescita Therapeutics reported Q1 2026 revenue of $5.6 million, up sharply year over year, with EPS at $(0.06) and adjusted EBITDA turning positive to $0.2 million. The company remains loss-making, but improving cash flow and an all‑cash acquisition proposal frame the quarter’s results, while after‑hours movement will depend on investor reaction to the ongoing ClinActiv transaction.
About Crescita Therapeutics Inc.
Crescita Therapeutics Inc. is a Canadian commercial dermatology company listed on the TSX under the ticker CTX and quoted OTC as CRRTF. It operates from its headquarters in Laval, Québec, where it combines in‑house research and development with manufacturing capabilities focused on science‑based non‑prescription skincare and a commercial stage prescription product, Pliaglis.
Crescita also owns proprietary transdermal delivery platforms that support the development of patented formulations designed to deliver active ingredients into or through the skin. The company’s market cap is modest, consistent with a micro‑cap issuer on the TSX, with shares recently trading around the C$0.70–C$0.80 range in the context of the proposed all‑cash ClinActiv acquisition valuing the equity near C$0.80 per share.
Crescita does not pay a dividend and remains in a net loss position, so traditional valuation metrics such as P/E are not meaningful for this quarter. Its Q1 2026 weighted average basic and diluted share count was 18.6 million, reflecting a lean capital structure ahead of the proposed go‑private transaction.
Top Financial Highlights
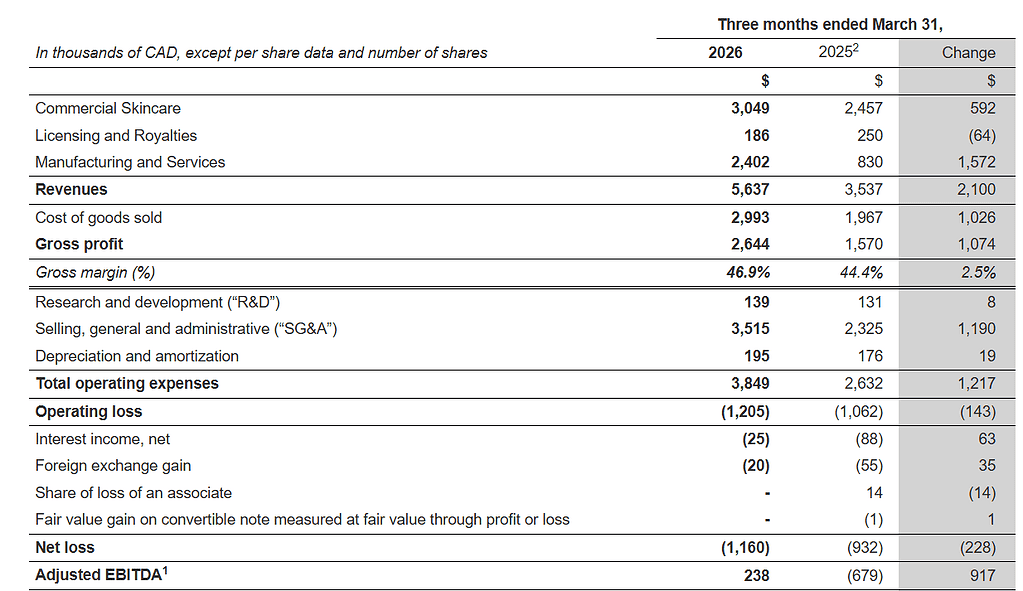
- Total revenue was $5.6 million, up from $3.5 million, an increase of $2.1 million driven mainly by Manufacturing and Commercial Skincare growth.
- Commercial Skincare revenue was $3.0 million, compared with $2.5 million, reflecting higher sales including incremental revenue from acquired skincare assets such as Bacti Control and stronger e‑commerce and export demand.
- Licensing and Royalties revenue totaled $0.2 million, down from $0.3 million, as timing of Pliaglis‑related royalties created a softer comparison.
- Manufacturing and Services revenue surged to $2.4 million from $0.8 million, primarily due to fulfillment of large orders and timing shifts of prior‑year purchase orders.
- Gross profit was $2.6 million versus $1.6 million, while gross margin improved to 46.9% from 44.4%, helped by higher plant utilization despite an unfavorable mix from lower‑margin manufacturing revenue.
- Total operating expenses rose to $3.8 million from $2.6 million, driven mainly by $0.8 million of transaction costs tied to the ClinActiv arrangement, higher share‑based compensation, and consulting fees.
- Operating loss widened slightly to $(1.2 million) from $(1.1 million) as higher costs offset stronger gross profit.
- Net loss was $(1.2 million) compared with $(0.9 million), reflecting transaction costs and higher compensation.
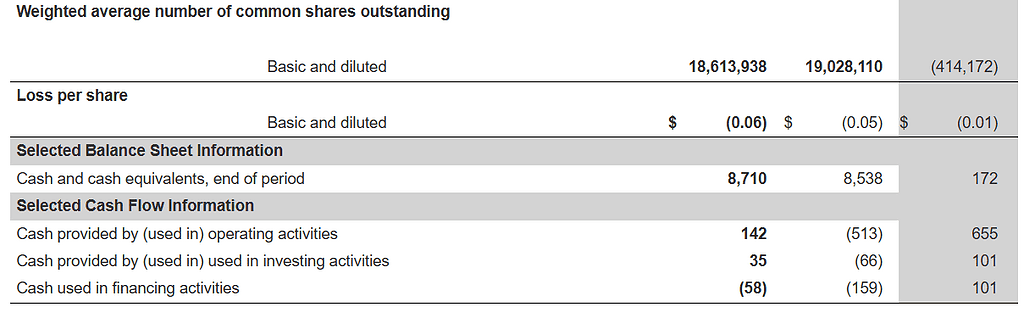
- EPS (basic and diluted) came in at $(0.06), compared with $(0.05) a year earlier, on a slightly lower average share count of 18.6 million versus 19.0 million.
- Adjusted EBITDA improved to $0.2 million from $(0.7 million), highlighting underlying operational improvement once non‑recurring and non‑cash items are excluded.
- Cash and cash equivalents ended the quarter at $8.7 million, modestly above $8.5 million in Q1 2025, supported by positive operating cash flow.
- Cash provided by operating activities was $0.1 million, compared with $(0.5 million) in cash used a year earlier, pointing to better working capital management and improved earnings quality.
- The company renewed its manufacturing and office lease for five more years to September 30, 2031, securing operational continuity at existing terms.
- Crescita entered a definitive arrangement agreement with ClinActiv Holdings to be acquired for $0.80 per share in cash, subject to adjustments and with a minimum price of $0.75 per share, representing a 74% premium to the pre‑announcement five‑day VWAP.
Q1-2026 Summary Financial Results
Beat or Miss?
Available data for Q1 2026 include reported figures but not detailed analyst consensus estimates, so comparisons to market expectations are limited. MarketBeat notes actual revenue of $5.64 million and EPS of $(0.06) for Q1 2026, with consensus estimates listed as not available. Management does not provide explicit quarterly revenue or EPS guidance, but the positive adjusted EBITDA and strong year‑over‑year revenue growth suggest internal targets were met or exceeded.
| Metric | Reported Q1 2026 | Difference or Analysis |
| Revenue | $5.64 million | N/A for consensus, but up 59% YoY on strong manufacturing demand. |
| Net income (loss) | $(1.16 million) | Loss widened versus $(0.93 million) YoY, mainly due to transaction costs related to the ClinActiv arrangement. |
| EPS (basic and diluted) | $(0.06) | Slightly weaker than $(0.05) YoY; no consensus EPS available for comparison. |
| Adjusted EBITDA | $0.24 million | Turned positive from $(0.68 million) YoY, reflecting underlying operational improvement despite higher overhead. |
| Operating cash flow | $0.14 million | Improved from $(0.51 million) used in Q1 2025, indicating healthier cash conversion. |
What Leadership Is Saying?
“During the first quarter, we continued to execute against our operational priorities. Our results reflect the year‑over‑year revenue and gross profit growth, driven by higher production volumes in our Manufacturing segment as well as the incremental revenue from recently acquired skincare assets. As we work through the remaining steps required to complete the transaction, we maintain our focus on serving our customers and supporting our employees, as well as ensuring a smooth and orderly transition of the business.” – Serge Verreault, President and CEO.
Management highlighted that total operating expenses rose primarily due to transaction costs incurred in connection with the ClinActiv arrangement, along with higher share‑based compensation tied to the company’s rising share price and increased consulting fees. These items weighed on net income but were adjusted out to arrive at positive adjusted EBITDA, which leadership views as a clearer indicator of underlying performance.
Historical Performance
Crescita’s Q1 2026 performance shows strong top‑line growth and margin expansion compared with the same quarter a year earlier, albeit with higher expenses and a slightly larger net loss. The company’s improved adjusted EBITDA and operating cash flow underscore progress in the core business, even as one‑time deal costs temporarily elevate operating expenses.
Crescita Therapeutics YoY Quarterly Comparison
| Category | Q1 2026 | Q1 2025 | Change (%) |
| Revenue | $5,637,000 | $3,537,000 | 59% increase, driven by Manufacturing and Skincare growth. |
| Net income (loss) | $(1,160,000) | $(932,000) | About 24% larger loss, mainly from transaction and share‑based costs. |
| Total operating expenses | $3,849,000 | $2,632,000 | About 46% increase, reflecting deal expenses and higher compensation. |
Historical Performance
To frame Crescita’s results in a broader competitive context, it is helpful to look at year‑over‑year trends for other dermatology or specialty pharmaceutical peers, even though business models and scale differ. Publicly traded comparables in the wider “drug manufacturers – specialty and generic” and dermatology segments reported mixed trends in early 2026, with some showing solid revenue gains and others facing margin pressure.
The table below illustrates representative YoY dynamics for selected peers based on available first‑quarter 2026 disclosures, but direct one‑to‑one comparison is constrained by differences in size, product mix, and geography.
| Category | Q1 2026 (Selected peers) | Q1 2025 (Selected peers) | Change (%) |
| Revenue | Higher aggregate revenue for several dermatology and specialty pharma names, supported by growth in biologics and branded therapeutics. | Lower prior‑year revenue bases before recent product launches and market expansion. | Generally positive revenue growth, though the pace varies by company and product portfolio. |
| Net income | Mixed profitability, with certain companies reporting modest net income and others still in loss as they invest in pipelines and launches. | Similar mix of profits and losses, but with some peers showing smaller earnings bases or higher R&D costs. | Directionally improving for companies scaling revenue faster than expenses, but compressed where cost inflation or R&D ramp is higher. |
| Operating expenses | Rising operating expenses across many peers, reflecting ongoing R&D, marketing investment, and inflationary cost pressures. | Lower operating costs before recent strategic investments and cost inflation. | Mid‑single to double‑digit growth in operating expenses, partly offset by operating leverage at larger scale. |
How the Market Reacted?
Crescita’s Q1 2026 report arrives in the context of a definitive agreement for the company to be acquired by ClinActiv Holdings in an all‑cash transaction at a target price of $0.80 per share, with a minimum of $0.75 per share, representing a substantial premium to pre‑deal trading levels. As a result, near‑term stock performance is likely anchored more by deal‑closure risk and timing than by quarterly earnings fluctuations.
The solid revenue growth, positive adjusted EBITDA, and improving cash generation are supportive of the transaction rationale and help reduce concern around near‑term liquidity ahead of closing. In the absence of explicit intraday stock‑price moves tied to the release, the overall tone of the report reads as cautiously bullish for shareholders, provided the arrangement progresses as planned.
