
DOOR (OTC: LTCH) posted Q1 2026 total revenue of $15.7 million, essentially flat year-over-year. EPS came in at $(0.04) per basic and diluted share, a significant improvement from $(0.07) in Q1 2025. Net loss narrowed 47.2% to $5.9 million. Shares traded between $0.17 and $0.24 on the day of the announcement, with after-hours movement limited given OTC trading constraints.
About Latch, Inc. (Now DOOR)
Latch, Inc., operating under its new brand DOOR (OTC: LTCH), is a Building Intelligence company headquartered in St. Louis, Missouri. The company was founded in 2017 and went public via a SPAC merger with TS Innovation Acquisitions Corp. on June 4, 2021, at a valuation exceeding $1.5 billion. As of May 2026, DOOR trades on the OTCID Basic Market under the legacy ticker “LTCH,” with a market capitalization of approximately $32.85 million.
The company rebranded from Latch to DOOR to reflect its evolution into a full-stack Building Intelligence platform that combines cloud-based access control, smart hardware, software subscriptions, and automated services for multifamily and purpose-built communities.
The company employs a hybrid revenue model across hardware, software, and professional services, and its platform integrates with major property management software systems including Yardi, RealPage, Entrata, and AppFolio. The company carries a negative P/E ratio of -0.60, reflecting its ongoing path toward profitability.
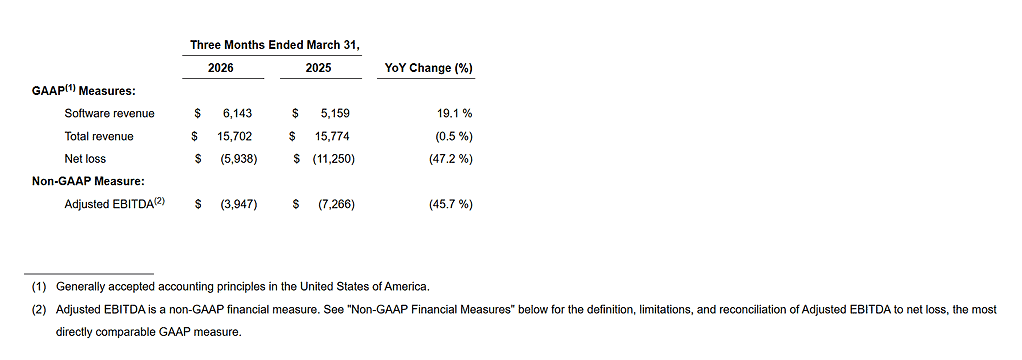
Top Financial Highlights
- Total revenue was $15.7 million, nearly flat year over year compared to $15.774 million in Q1 2025.
- Software revenue reached $6.143 million, increasing 19.1% year over year, supported by continued subscription growth.
- Hardware revenue was $4.357 million, rising 7.9% due to higher unit shipments.
- Professional services revenue declined 20.9% to $5.202 million, mainly due to lower installation activity.
- Gross profit increased to $8.219 million, while gross margin improved to 52.3% from 47.4%.
- Total operating expenses fell 25.6% to $13.763 million, reflecting stronger cost control.
- Net loss narrowed 47.2% to $5.938 million, compared to $11.250 million in Q1 2025.
- Basic and diluted EPS improved to -$0.04, from -$0.07 in the prior-year quarter.
- Adjusted EBITDA loss improved 45.7% to $3.947 million, compared to $7.266 million in Q1 2025.
- Cash and investments totaled $28.5 million at quarter end.
- Cash used in Q1 2026 was $6.1 million, improving by $18.6 million year over year.
- Net inventory stood at approximately $25.0 million.
- A new $5.0 million revolving credit facility was secured on May 11, 2026, replacing the previous facility.
Beat or Miss?
| Metric | Reported (Q1 2026) | Estimated / Expected | Difference / Analysis |
| Total Revenue | $15.702 million | N/A (no consensus) | Flat YoY; inline with trend of stabilizing revenue |
| Software Revenue | $6.143 million | N/A | Exceeded internal strategic priority of software-led growth at 19.1% YoY |
| Net Loss | $(5.938) million | N/A | Strong improvement; 47.2% narrower than Q1 2025 $(11.250) million |
| EPS (Basic/Diluted) | ($0.04) | N/A | Improved from $(0.07) in Q1 2025 |
| Adjusted EBITDA | $(3.947) million | N/A | 45.7% improvement YoY; approx. $3.3 million narrower vs. Q1 2025 |
| Gross Margin | 52.30% | N/A | Expanded from 47.4% in Q1 2025, driven by services efficiency and product mix |
| Cash on Hand | $28.5 million | N/A | Cash usage of $6.1M vs. $24.7M in Q1 2025; $18.6M improvement |
What Leadership Is Saying?
CEO David Lillis on strategy and vision:
“Our first quarter performance reflects continued execution against the strategic priorities driving DOOR forward. We believe the multifamily industry is shifting toward integrated, software-driven building systems, and we believe demand is increasing for scalable platforms capable of improving operating efficiency, reducing costs, streamlining portfolio management, and enhancing resident experiences. DOOR’s combination of cloud-based access control, software, connected infrastructure, and automation positions us to capitalize on these long-term trends. We remain focused on three priorities for the remainder of 2026: continued revenue growth by adding new buildings to the DOOR ecosystem, disciplined expense management as legacy costs normalize, and ongoing progress toward profitability and operating cash flow improvement.”
CFO Jeff Mayfield on financials and liquidity:
“We narrowed our Adjusted EBITDA loss by approximately $3.3 million and reduced cash usage by $18.6 million compared to the first quarter of 2025, reflecting continued progress toward a more efficient and scalable operating model. We also recently refinanced our debt through a new revolving credit facility with Truist Bank on improved economic terms, further strengthening our near-term liquidity position. We ended the quarter with $28.5 million in cash and investments, and $25.0 million in net inventory, which we believe provides the resources to support execution of our 2026 plan.”
Historical Performance
Year-over-year comparison for Q1 2026 versus Q1 2025:
| Category | Q1 2026 | Q1 2025 | Change (%) |
| Total Revenue | $15.702 million | $15.774 million | -0.50% |
| Software Revenue | $6.143 million | $5.159 million | 19.10% |
| Hardware Revenue | $4.357 million | $4.037 million | 7.90% |
| Professional Services Revenue | $5.202 million | $6.578 million | -20.90% |
| Gross Profit | $8.219 million | $7.479 million | 9.90% |
| Gross Margin | 52.30% | 47.40% | +490 bps |
| Total Operating Expenses | $13.763 million | $18.503 million | -25.60% |
| Research and Development | $3.793 million | $5.633 million | -32.70% |
| Sales and Marketing | $4.272 million | $3.577 million | 19.40% |
| General and Administrative | $4.691 million | $7.771 million | -39.60% |
| Net Loss | $(5.938) million | $(11.250) million | -47.20% |
| Adjusted EBITDA | $(3.947) million | $(7.266) million | -45.70% |
| EPS (Basic/Diluted) | ($0.04) | ($0.07) | +42.9% improvement |
| Cash and Investments | $28.5 million | $50.7 million | -43.80% |
| Net Cash Used in Operations | $(5.143) million | $(10.137) million | -49.30% |
Competitor Comparison: Q1 2026 vs Q1 2025
The closest publicly traded peer in the smart building and multifamily access control space is SmartRent (NASDAQ: SMRT). Brivo and ButterflyMX are private companies and do not publish quarterly results. The table below compares DOOR against SmartRent, the primary listed comparable.
| Category | DOOR Q1 2026 | DOOR Q1 2025 | DOOR Change (%) | SmartRent Q1 2026 | SmartRent Q1 2025 | SmartRent Change (%) |
| Total Revenue | $15.702 million | $15.774 million | -0.50% | $38.683 million | $41.344 million | -6.00% |
| Net Loss | $(5.938) million | $(11.250) million | -47.20% | $(4.448) million | $(40.184) million | -88.90% |
| EPS (Diluted) | ($0.04) | ($0.07) | Improved | ($0.02) | ($0.21) | Improved |
| Gross Margin | 52.30% | 47.40% | +490 bps | N/A (improved +630 bps) | N/A | +630 bps |
SmartRent is a larger company serving the same multifamily smart home and access market. SmartRent’s Q1 2026 revenue decline of 6% contrasts with DOOR’s flat revenue, while both companies showed meaningful improvement in net losses. SmartRent’s IoT unit footprint reached 911,000 deployed units in Q1 2026, with annual recurring revenue growing 9% year-over-year. Brivo merged with Eagle Eye Networks in December 2025, creating a private AI cloud-native physical security company, and does not publicly report quarterly financials. ButterflyMX remains a private competitor in the multifamily access control space and does not release earnings data.
How the Market Reacted?
DOOR’s shares traded on the OTC market under the symbol “LTCH” at $0.20 as of May 14-15, 2026, with intraday movement between $0.17 and $0.24 on the earnings announcement day of May 15. The company’s stock has gained 100% over the trailing one-year period and is up approximately 33.3% year-to-date, reflecting improving sentiment around the company’s narrowing losses and operational improvement progress.
Given the OTC listing and the absence of formal institutional analyst coverage beyond a single Hold rating with a $0.16 price target, trading volumes remain thin and post-earnings movement is largely sentiment-driven rather than driven by institutional re-rating.
The overall tone of the Q1 2026 report is cautiously bullish: while revenue growth remains muted, the 47% reduction in net loss, 19% software revenue growth, 490 basis point gross margin expansion, and $18.6 million improvement in quarterly cash usage signal a company making measurable progress on its path toward profitability.
