








Quick Verdict
Agilent (NYSE: A) posted Q3 FY2026 non-GAAP EPS of $1.62 (vs. $1.48 consensus) on revenue of $1.88 billion (vs. ~$1.84 billion expected), a clean beat-and-raise quarter. Shares jumped 3.17% in after-hours trading to $160, near the 52-week high, as management lifted full-year guidance across revenue, margins, and EPS. These results highlight the strong performance in Agilent Technologies’ Q3 Fiscal 2026 Earnings report.
About Agilent Technologies
Agilent Technologies, Inc. (NYSE: A) is a Santa Clara, California-headquartered global leader in analytical and clinical laboratory technologies, spun off from Hewlett-Packard in 1999. The company designs instruments, software, consumables, and services used across life sciences, diagnostics, and applied chemical markets, generating $6.95 billion in revenue in fiscal 2025 with roughly 18,000 employees worldwide.
Agilent currently trades at a market capitalization of approximately $43.8 billion, with a trailing P/E ratio of about 30.5x and a dividend yield near 0.7%. Under CEO Padraig McDonnell, the company has been executing its “Ignite Operating System,” an enterprise-wide operational transformation program credited with driving pricing gains, margin expansion, and faster decision-making.
Top Financial Highlights
- Total revenue of $1.88 billion, up 8.1% reported and 7.3% core/organic year-over-year.
- GAAP net income of $362 million, up from $336 million a year ago.
- GAAP diluted EPS of $1.28, up 8% year-over-year.
- Non-GAAP net income of $459 million (including a $17 million tariff-refund benefit).
- Non-GAAP diluted EPS of $1.62 (including $0.06 tariff-refund benefit), up 18% year-over-year; $1.56 ex-refunds, up 14%.
- GAAP operating margin of 23.6%, up 290 basis points year-over-year.
- Non-GAAP operating margin of 28.3%, up 320 basis points year-over-year (27.2% excluding tariff refunds).
- Gross margin of 56.4% including tariff refunds, 54.9% excluding, up 180 basis points year-over-year.
- Operating cash flow of $519 million for the quarter; free cash flow of $439 million.
- Nine-month operating cash flow of $1,064 million.
- Cash and cash equivalents of $1.76 billion as of July 31, 2026.
- Life Sciences and Diagnostics Markets Group (LDG) revenue: $746 million, up 11% reported/10% core, 23.5% operating margin.
- Agilent CrossLab Group (ACG) revenue: $786 million, up 6% reported/5% core, 34.3% operating margin.
- Applied Markets Group (AMG) revenue: $346 million, up 7% reported/7% core, 24.9% operating margin.
- Q4 FY2026 guidance: revenue of $1.98–$2.0 billion (6.4%–7.4% reported growth) and non-GAAP EPS of $1.71–$1.74.
- Raised FY2026 guidance: revenue of $7.49–$7.51 billion and non-GAAP EPS of $6.18–$6.21, up 15 cents at the midpoint from prior guidance.
Life Sciences And Diagnostics Markets Segment
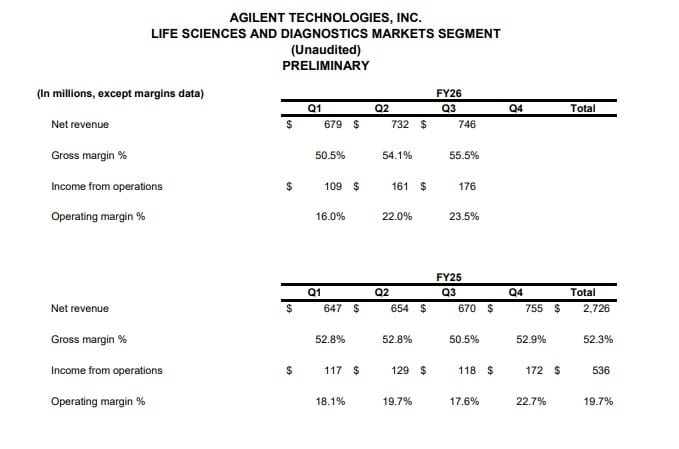
- The table presents Agilent Technologies’ Life Sciences and Diagnostics Markets Segment performance for FY26 through Q3, compared with FY25. In FY26, net revenue increased from USD 679 million in Q1 to USD 732 million in Q2 and USD 746 million in Q3, showing steady quarterly growth. Gross margin also improved from 50.5% in Q1 to 54.1% in Q2 and 55.5% in Q3.
- Income from operations rose significantly from USD 109 million in Q1 FY26 to USD 161 million in Q2 and USD 176 million in Q3. Accordingly, operating margin expanded from 16.0% to 22.0% and then to 23.5%. In comparison, FY25 generated total net revenue of USD 2,726 million, with a full-year gross margin of 52.3%, income from operations of USD 536 million, and an operating margin of 19.7%.
- Overall, the FY26 results through Q3 indicate improving revenue, profitability, and operating efficiency compared with the earlier quarters.
Beat or Miss?
| Metric | Reported | Difference/Analysis |
| Revenue | $1.88 billion | Beat consensus of ~$1.84 billion by ~2.08% |
| Non-GAAP EPS | $1.62 | Beat Zacks consensus of $1.48 by 9.46%; beat MarketBeat consensus of $1.49 by $0.13 |
| GAAP EPS | $1.28 | Up 8% YoY from $1.18 in Q3 FY2025 |
| Non-GAAP operating margin | 28.3% | 80 bps ahead of implied guidance of 26.4% (ex-refunds: 27.2%, still 80 bps ahead) |
What Leadership Is Saying
“Agilent’s exceptional third-quarter performance reflects the sustained momentum created by our strategy, our execution discipline, and the compounding impact of the Ignite Operating System. We are seeing improving end markets, stronger demand in key regions, and excellent customer response to our innovative product launches. All of this gives us confidence in our increased outlook and our ability to sustainably outperform our end markets.” — Padraig McDonnell, CEO
“Operating margin was 28.3% in the quarter. Excluding an approximately 110 basis point net benefit from tariff refunds, operating margin was 27.2%, an increase of 210 basis points year-over-year, driven by our healthy gross margin performance and compounding Ignite efficiencies.” — Adam Elinoff, CFO
Historical Performance (YoY)
| Category | Q3 FY2026 | Q3 FY2025 | Change (%) |
| Revenue | $1,878 million | $1,738 million | +8.1% |
| Net Income (GAAP) | $362 million | $336 million | +7.7% |
| Non-GAAP EPS | $1.62 | $1.37 | +18.2% |
| Operating Expenses (Total costs and expenses) | $1,434 million | $1,378 million | +4.1% |
Peer Comparison: Recent Quarterly Performance
| Category | Agilent (Q3 FY26) | Thermo Fisher (Q2 FY26) | Danaher (Q2 FY26) |
| Revenue | $1.88 billion (+8.1% YoY) | $11.99 billion (+10% YoY) | $6.3 billion (+5.5% YoY) |
| Net Income | $362 million GAAP (+7.7% YoY) | $1.74 billion GAAP (roughly flat-to-up YoY) | $870 million GAAP (+60% YoY) |
| Adjusted/Non-GAAP EPS | $1.62 (+18% YoY) | $6.03 (+13% YoY) | $1.94 (+8% YoY) |
Note: Agilent, Thermo Fisher and Danaher report on different fiscal calendars — Thermo Fisher and Danaher’s most recent reported quarters are Q2 FY2026 (through June 2026), while Agilent’s is Q3 FY2026 (through July 2026).
How the Market Reacted?
Agilent shares rose 3.17% in after-hours trading to approximately $160, up from a regular-session close of $155.08, pushing the stock to within 0.51 of its 52-week high of $160.51. The move indicates the market interpreted the results as a clear positive, driven by the earnings beat and the raised full-year outlook across revenue, margin expansion, and non-GAAP EPS. Analyst sentiment ahead of the print was already a “Moderate Buy” with an average price target of $160.24, and the post-earnings pop pushed shares roughly in line with that target. Overall commentary from earnings analysts characterized the report and outlook as bullish, citing accelerating core growth, record margins, and continued demand from biopharma and instrument-replacement cycles.



